| Fire incidents reported |
|---|
| Sreet name | Count |
|---|
| US RT 11 | 30 | | US RTE 11 | 20 | | BUSH ROAD | 12 | | COUNTY ROUTE 138 | 12 | | GERALD AVE | 12 | | SR 342 | 12 | | JEWETT PLACE | 10 | | VIRGINA SMITH DR | 10 | | LYNN CIR | 8 | | ST RT 283 | 8 | | STATE ROUTE 283 | 8 | | VIRGINIA SMITH DR | 8 | | LYNN CIRCLE | 6 | | NYS RTE 11 RT | 6 | | NYS RTE 342 RT | 6 | | ST RT 342 | 6 | | STATE ROUTE 342 | 6 | | US ROUTE 11 | 6 | | BUSH RD | 4 | | COOPER AVE | 4 | | COUNTY RTE 138 | 4 | | CT RT 138 | 4 | | GERALD AVE | 4 | | GOULDS CORNERS RD. | 4 | | JAMES ST | 4 |
| | | Fire incidents reported |
|---|
| Sreet name | Count |
|---|
| JEWETT PL | 4 | | MOUNTAIN LN | 4 | | NYS RT 342 | 4 | | NYS RTE 283 RT | 4 | | PLANK RD | 4 | | PLANK ROAD | 4 | | STALDER RD | 4 | | WILLIAM ST | 4 | | 25018 GERALD AVE | 2 | | 25358 VIRGINIA SMITH DR. | 2 | | 25368 VIRGINIA SMITH DR. | 2 | | 25383 VIRGINIA SMITH DR. | 2 | | 25737 ST. RT. 11 | 2 | | 25737 US. ROUTE 11 | 2 | | 26061 MOUNTAIN LN. | 2 | | 26274 GOLDEN DR | 2 | | 26411 LYNN CIRCLE | 2 | | 26462 HERRICK DR | 2 | | 26470 VIRGINIA SMITH DR. | 2 | | BUSH RD | 2 | | CALIUM SCHOOL | 2 | | CASE AVE | 2 | | CASEY | 2 | | CASEY AVE | 2 | | |
|
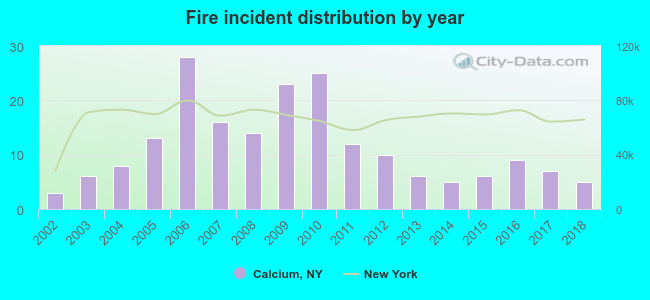 Based on the data from the years 2002 - 2018 the average number of fires per year is 12. The highest number of reported fires - 28 took place in 2006, and the least - 3 in 2002. The data has a rising trend.
 33.2% incidents where reported in the morning and 66.8% in the evening. The most fires (17.3%) took place on Friday, and the least (10.7%) on Wednesday.
 According to the 196 incident reports from years 2002 - 2018 most fires (15.8%) took place during July, and the least (3.1%) in August.
 Out of all 1,348 cases reported during the years 2002 - 2018, the most belonged to the categories: Rescue & EMS (38.3%), Good Intent Call (19.7%), and Hazardous Condition (17.6%).
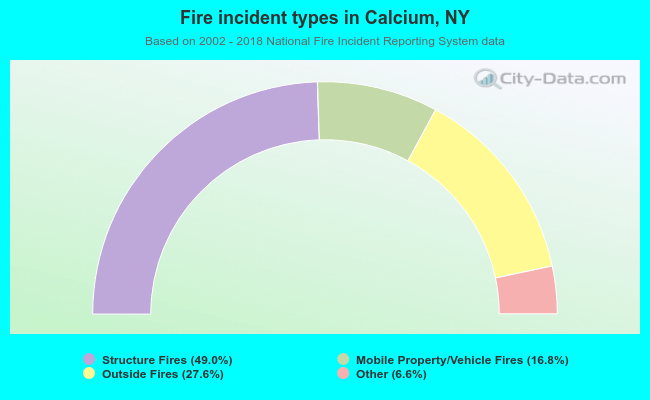 When looking into fire subcategories, the most reports belonged to: Structure Fires (49.0%), and Outside Fires (27.6%).