Byron: Fire Incidents, New York (NY)
Where are fire incidents reported in Byron, NY
Something went wrong! Please refresh the page.
|
| |||||||||||||||||||||||||||||||||||||||||||||||||||||||||||||||||||||||||||||||||||||||||||||||||||||||||||||
2002 - 2018 National Fire Incident Reporting System (NFIRS) incidents
- Incident types reported to NFIRS in Byron, NY
- 78849.8%Rescue & EMS
- 26016.4%Fire
- 23915.1%Hazardous Condition
- 1177.4%Service Call
- 1076.8%Good Intent Call
- 613.9%False Alarm
- 100.6%Special Incident
- Fire incident types reported to NFIRS in Byron, NY
- 11142.7%Structure Fires
- 10239.2%Outside Fires
- 3212.3%Mobile Property/Vehicle Fires
- 155.8%Other
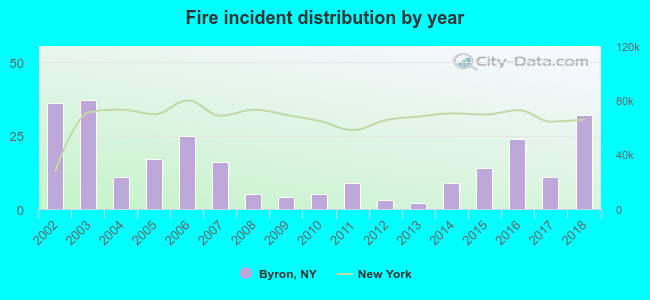 Based on the data from the years 2002 - 2018 the average number of fires per year is 15. The highest number of reported fires - 37 took place in 2003, and the least - 2 in 2013. The data has a declining trend.
 21.5% incidents where reported in the morning and 78.5% in the evening. The most fires (16.9%) took place on Sunday, and the least (9.6%) on Tuesday.
 According to the 260 incident reports from years 2002 - 2018 most fires (14.6%) took place during October, and the least (3.5%) in January.
 Out of all 1,583 cases reported during the years 2002 - 2018, the most belonged to the categories: Rescue & EMS (49.8%), Fire (16.4%), and Hazardous Condition (15.1%).
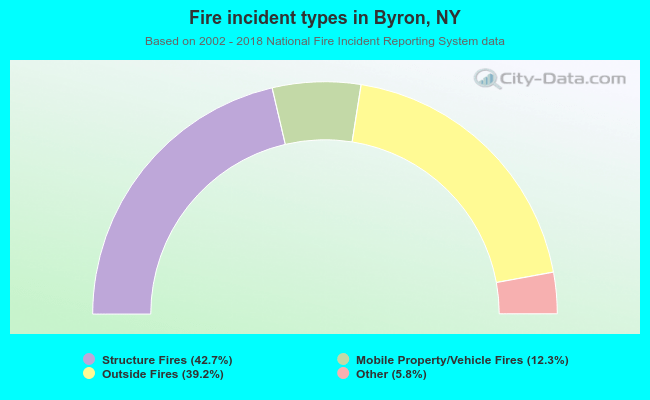 When looking into fire subcategories, the most reports belonged to: Structure Fires (42.7%), and Outside Fires (39.2%).