Buffalo: Fire Incidents, Minnesota (MN)
Where are fire incidents reported in Buffalo, MN
Something went wrong! Please refresh the page.
|
| |||||||||||||||||||||||||||||||||||||||||||||||||||||||||||||||||||||||||||||||||||||||||||||||||||||||||||||
| Other | 7 | |||||||||||||||||||||||||||||||||||||||||||||||||||||||||||||||||||||||||||||||||||||||||||||||||||||||||||||
2002 - 2018 National Fire Incident Reporting System (NFIRS) incidents
- Incident types reported to NFIRS in Buffalo, MN
- 76533.0%Fire
- 45219.5%False Alarm
- 38116.4%Rescue & EMS
- 37816.3%Hazardous Condition
- 1375.9%Good Intent Call
- 1225.3%Service Call
- 431.9%Overpressure Rupture
- 391.7%Severe Weather
- 40.2%Special Incident
- Fire incident types reported to NFIRS in Buffalo, MN
- 29738.8%Structure Fires
- 24632.2%Outside Fires
- 15320.0%Mobile Property/Vehicle Fires
- 699.0%Other
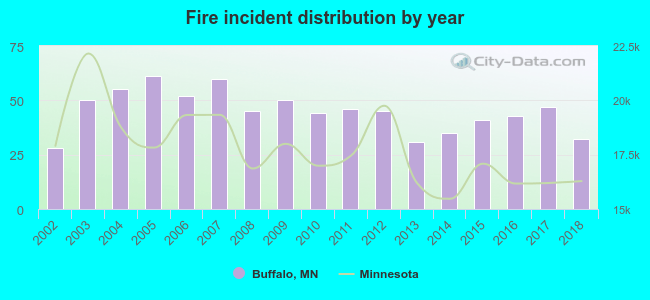 According to the data from the years 2002 - 2018 the average number of fire incidents per year is 45. The highest number of reported fires - 61 took place in 2005, and the least - 28 in 2002. The data has an increasing trend.
The average number of yearly fire incidents per 10k residents in Buffalo, MN compared to nearest cities:
(Note: Based on data for the last 3 years, including only cities with population 5,000 and above)
| Buffalo: | 25.6 |
| Monticello: | 29.2 |
| Delano: | 28.9 |
| Albertville: | 17.9 |
| Big Lake: | 31.9 |
| Otsego: | 11.7 |
| Rogers: | 22.1 |
| Corcoran: | 35.0 |
| Elk River: | 24.0 |
 The median response time based on all reported fire incidents is 5 minutes. This is lower than the Minnesota median value.
The median response time in Buffalo, MN compared to nearest cities:
(Note: Based on data for all years, including only cities with at least 500 fire incidents)
| Buffalo: | 5 minutes |
| Monticello: | 10 minutes |
| Big Lake: | 9 minutes |
| Becker: | 10 minutes |
| Rogers: | 7 minutes |
| Elk River: | 8 minutes |
| Maple Grove: | 7 minutes |
| Ramsey: | 7 minutes |
| Zimmerman: | 8 minutes |
 31.9% incidents where reported in the morning and 68.1% in the evening. The most fires (15.8%) took place on Wednesday, and the least (11.5%) on Tuesday.
 Based on the 765 fire incidents from years 2002 - 2018 most fires (13.9%) took place during April, and the least (5.5%) in August.
 Out of all 2,321 cases reported during the years 2002 - 2018, the most belonged to the categories: Fire (33.0%), False Alarm (19.5%), and Rescue & EMS (16.4%).
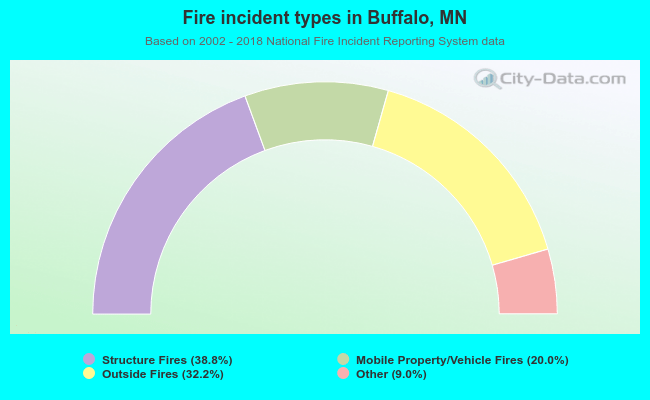 When looking into fire subcategories, the most reports belonged to: Structure Fires (38.8%), and Outside Fires (32.2%).