| Fire incidents reported |
|---|
| Sreet name | Count |
|---|
| ROUTE 31 | 60 | | RT 31 | 44 | | STATE ROUTE 31 | 40 | | RINALDO BLVD | 22 | | NYS RT 31 | 18 | | TUTTLE RD | 16 | | EISENHOWER BLVD | 12 | | MOORE RD | 12 | | RT. 31 | 12 | | SMITHRIDGE RD | 12 | | TUTTLE RD | 12 | | BULL ST | 10 | | BULL ST | 10 | | BULL STREET | 10 | | JOHN HUSS AVE | 10 | | PEGLER BLVD | 10 | | EASTWOOD RD | 8 | | MACAURTHUR BLVD | 8 | | PEGLER BLVD | 8 | | RUGBY RD | 8 | | SAVANAROLA DR | 8 | | WINDVIEW CIRCLE | 8 | | WOODS RD | 8 | | BLACK POINT RD | 6 | | BRIDGEPORT KIRKVILLE RD | 6 |
| | | Fire incidents reported |
|---|
| Sreet name | Count |
|---|
| BRIDGEPORT KIRKVILLE RD | 6 | | EASTWOOD RD | 6 | | GALILEO CIRCLE | 6 | | LARKIN AVE | 6 | | LESTINA BEACH RD | 6 | | LESTINA BEACH RD | 6 | | MACARTHUR BLVD | 6 | | NORTH RD | 6 | | PETRIE RD | 6 | | ROUTE 31 RT | 6 | | WINDVIEW CIR | 6 | | WOODS RD | 6 | | AREOPAGITICA AVE | 4 | | BARRETT LN | 4 | | BLACK CREEK RD | 4 | | CLARK RD. | 4 | | COULTER COVE RD | 4 | | DAMON POINT RD | 4 | | DAMON POINT RD | 4 | | DAMONS POINT RD | 4 | | EAST AVE | 4 | | EISENHOWER BLVD | 4 | | ERSKINE DR | 4 | | FOX | 4 | | FOX RD | 4 |
|
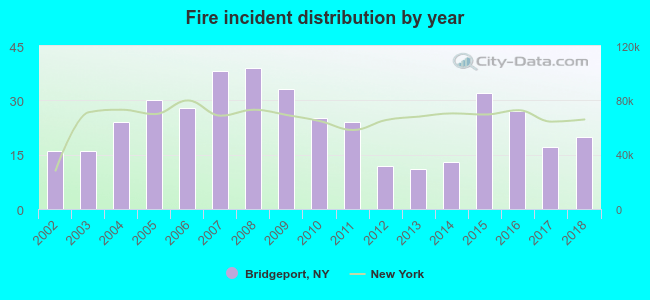 Based on the data from the years 2002 - 2018 the average number of fire incidents per year is 24. The highest number of fire incidents - 39 took place in 2008, and the least - 11 in 2013. The data has an increasing trend.
 28.1% incidents where reported in the morning and 71.9% in the evening. The most fires (18.5%) took place on Friday, and the least (10.1%) on Wednesday.
 Based on the 405 fires from years 2002 - 2018 most fires (14.3%) took place during April, and the least (4.4%) in October.
 Out of all 2,648 cases reported during the years 2002 - 2018, the most belonged to the categories: Rescue & EMS (49.3%), Good Intent Call (21.6%), and Fire (15.3%).
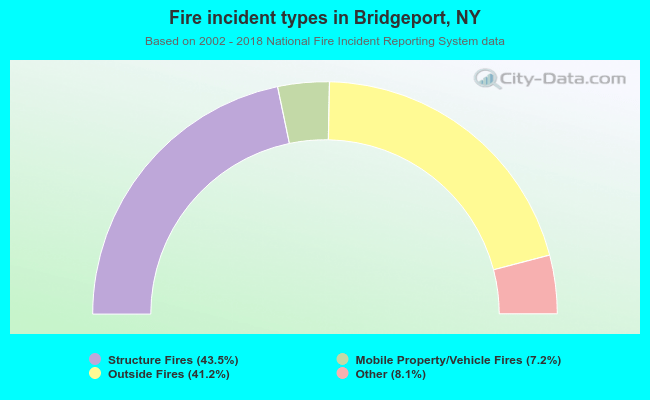 When looking into fire subcategories, the most reports belonged to: Structure Fires (43.5%), and Outside Fires (41.2%).