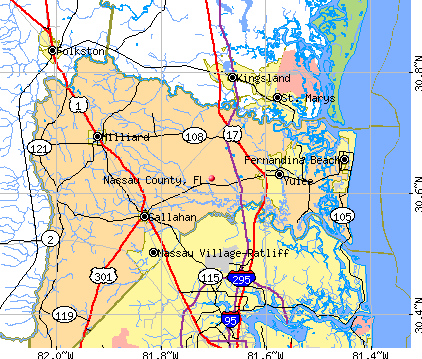
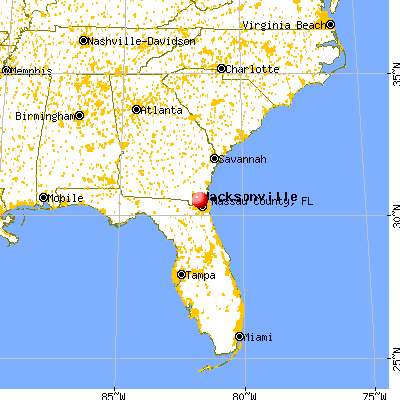
Nassau County, Florida (FL)
County owner-occupied free and clear houses and condos in 2010: 7,544
County owner-occupied houses and condos in 2000: 17,732
Renter-occupied apartments: 6,345 (it was 4,248 in 2000)
| % of renters here: | 19% |
| State: | 33% |
Land area: 652 sq. mi.
Water area: 74.3 sq. mi.
Population density: 150 people per square mile (average).
Industries providing employment: Educational, health and social services (16.9%), Professional, scientific, management, administrative, and waste management services (14.0%), Arts, entertainment, recreation, accommodation and food services (11.2%).
Type of workers:
- Private wage or salary: 80%
- Government: 14%
- Self-employed, not incorporated: 5%
- Unpaid family work: 0%
- OSM Map
- General Map
- Google Map
- MSN Map

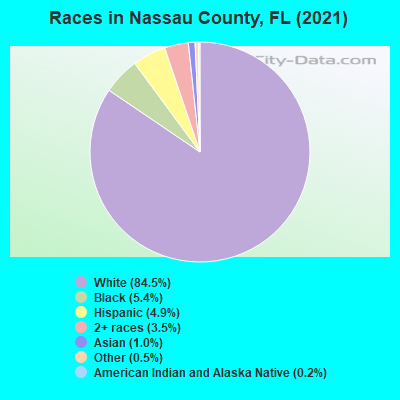
- 82,20184.0%White Non-Hispanic Alone
- 5,9646.1%Black Non-Hispanic Alone
- 5,4245.5%Hispanic or Latino
- 2,0922.1%Two or more races
- 1,0431.1%Asian alone
- 9551.0%Some other race alone
- 1590.2%American Indian and Alaska Native alone
- 610.06%Native Hawaiian and Other
Pacific Islander alone
| Median resident age: | 47.6 years |
| Florida median age: | 42.7 years |
| Males: 47,395 | |
| Females: 50,504 |

 | Why isn't Jacksonville the most sought after city in Florida? (139 replies) |
| Demographics of people moving into Florida (69 replies) |
| Jacksonville heading for a White Flight (23 replies) |
| What area of St. Johns County might work best for me? (44 replies) |
| High School teacher moving to Florda (92 replies) |
| Why is Jacksonville the only major Florida city not experiencing a boom? (158 replies) |
| Nassau County: | 2.0 people |
| Florida: | 2 people |
Estimated median household income in 2022: $90,883 ($46,022 in 1999)
| This county: | $90,883 |
| Florida: | $69,303 |
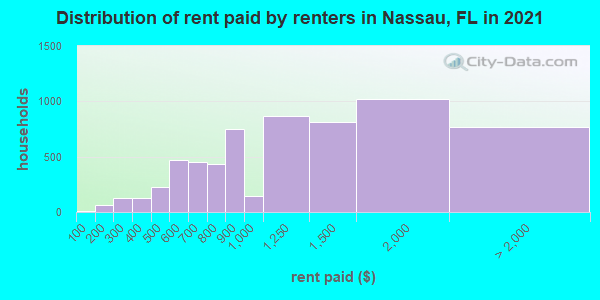
Median contract rent in 2022 for apartments: $1,461 (lower quartile is $647, upper quartile is $1,870)
| This county: | $1461 |
| State: | $1367 |
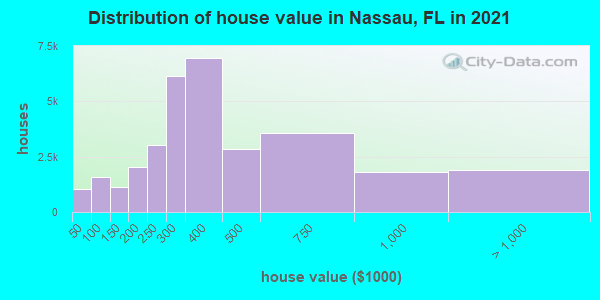
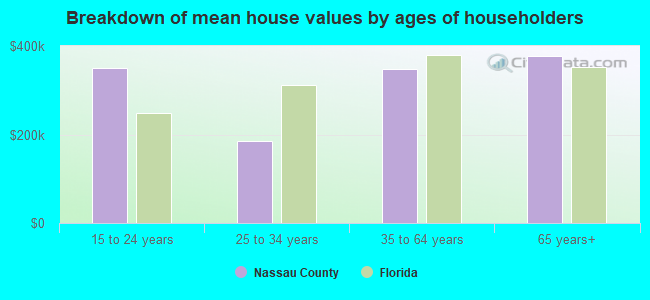
Estimated median house or condo value in 2022: $382,900 (it was $98,000 in 2000)
| Nassau: | $382,900 |
| Florida: | $354,100 |
Mean price in 2022:
Median monthly housing costs for homes and condos with a mortgage: $1,635Detached houses: $504,284
Here: $504,284 State: $500,941 Townhouses or other attached units: $658,779
Here: $658,779 State: $370,869 In 2-unit structures: $1,120,424
Here: $1,120,424 State: $423,188 In 3-to-4-unit structures: $422,383
Here: $422,383 State: $309,944 In 5-or-more-unit structures: $970,264
Here: $970,264 State: $447,145 Mobile homes: $162,349
Here: $162,349 State: $113,202 Occupied boats, RVs, vans, etc.: $33,250
Here: $33,250 State: $73,933
Median monthly housing costs for units without a mortgage: $603
Institutionalized population: 432
Crime in 2020 (reported by the sheriff's office or county police, not the county total):
- Murders: 1
- Rapes: 30
- Robberies: 7
- Assaults: 114
- Burglaries: 310
- Thefts: 490
- Auto thefts: 100
Crime in 2019 (reported by the sheriff's office or county police, not the county total):
- Murders: 1
- Rapes: 35
- Robberies: 4
- Assaults: 134
- Burglaries: 332
- Thefts: 514
- Auto thefts: 73
Health of residents in Nassau County based on CDC Behavioral Risk Factor Surveillance System Survey Questionnaires from 2013 to 2021:
General health status score of residents in this county from 1 (poor) to 5 (excellent) is 3.4. This is about average.69.2% of residents exercised in the past month. This is less than average.
46.4% of residents smoked 100+ cigarettes in their lives. This is about average.
52.3% of adult residents drank alcohol in the past 30 days. This is less than average.
64.1% of residents visited a dentist within the past year. This is less than average.
Average weight of males is 199 pounds. This is about average.
Average weight of females is 163 pounds. This is about average.
Health of residents in Nassau County based on CDC Behavioral Risk Factor Surveillance System Survey Questionnaires from 2003 to 2012:
General health status score of residents in this county from 1 (poor) to 5 (excellent) is 3.4. This is about average.75.5% of residents exercised in the past month. This is about average.
56.4% of residents smoked 100+ cigarettes in their lives. This is more than average.
99.2% of adult residents drank alcohol in the past 30 days. This is more than average.
64.2% of residents visited a dentist within the past year. This is less than average.
Average weight of males is 199 pounds. This is about average.
Average weight of females is 157 pounds. This is about average.
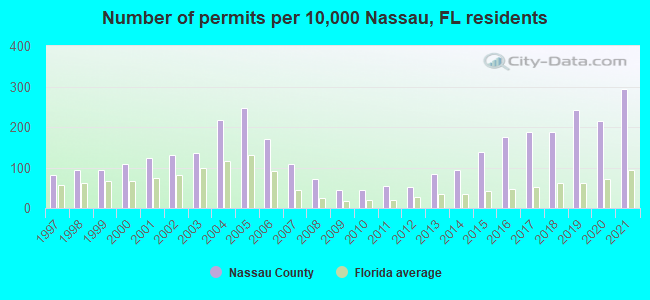
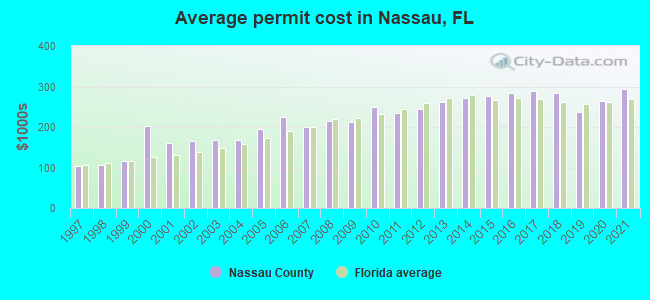
Single-family new house construction building permits:
- 2022: 1417 buildings, average cost: $374,800
- 2021: 1694 buildings, average cost: $293,400
- 2020: 1237 buildings, average cost: $264,800
- 2019: 1401 buildings, average cost: $236,300
- 2018: 1085 buildings, average cost: $283,400
- 2017: 1078 buildings, average cost: $288,800
- 2016: 1007 buildings, average cost: $284,400
- 2015: 800 buildings, average cost: $276,500
- 2014: 545 buildings, average cost: $271,100
- 2013: 481 buildings, average cost: $261,100
- 2012: 305 buildings, average cost: $245,400
- 2011: 309 buildings, average cost: $235,000
- 2010: 251 buildings, average cost: $249,500
- 2009: 252 buildings, average cost: $213,300
- 2008: 418 buildings, average cost: $213,700
- 2007: 626 buildings, average cost: $200,800
- 2006: 986 buildings, average cost: $225,000
- 2005: 1418 buildings, average cost: $194,500
- 2004: 1252 buildings, average cost: $168,100
- 2003: 781 buildings, average cost: $166,700
- 2002: 755 buildings, average cost: $165,300
- 2001: 708 buildings, average cost: $160,900
- 2000: 620 buildings, average cost: $203,200
- 1999: 549 buildings, average cost: $115,700
- 1998: 549 buildings, average cost: $104,700
- 1997: 471 buildings, average cost: $103,000
Median real estate property taxes paid for housing units with mortgages in 2022: $2,369 (0.6%)
Median real estate property taxes paid for housing units with no mortgage in 2022: $2,594 (0.6%)

| Nassau County: | 5.3% |
| Florida: | 12.7% |
Median age of residents in 2022: 47.6 years old
(Males: 46.7 years old, Females: 48.7 years old)
(Median age for: White residents: 49.0 years old, Black residents: 48.5 years old, Asian residents: 45.6 years old, Hispanic or Latino residents: 37.3 years old, Other race residents: 30.4 years old)
Area name: Jacksonville, FL HUD Metro FMR Area
Fair market rent in 2006 for a 1-bedroom apartment in Nassau County is $643 a month.
Fair market rent for a 2-bedroom apartment is $749 a month.
Fair market rent for a 3-bedroom apartment is $940 a month.
Cities in this county include: Fernandina Beach, Yulee, Nassau Village-Ratliff, Hilliard, Callahan.
| Zip Code | City | Certified Residential Database | Mandatory Residential Database | Mandatory Non-Residential Database | |||
|---|---|---|---|---|---|---|---|
| Buildings Measured | Above 4 pCi/L (%) | Buildings Measured | Above 4 pCi/L (%) | Buildings Measured | Above 4 pCi/L (%) | ||
| 32009 | Bryceville | 2 | 0 | - | - | - | - |
| 32034 | Fernandina Beach | 38 | 0 | 1 | 0 | 1 | 0 |
| 32046 | Hilliard | 5 | 0 | 2 | 0 | 2 | 0 |
| 32097 | Yulee | 6 | 0 | 1 | 0 | 1 | 0 |
Neighboring counties: Escambia County  , Leon County , Lanier County, Georgia
  , Llano County, Texas .
| Here: | 2.8% |
| Florida: | 2.9% |

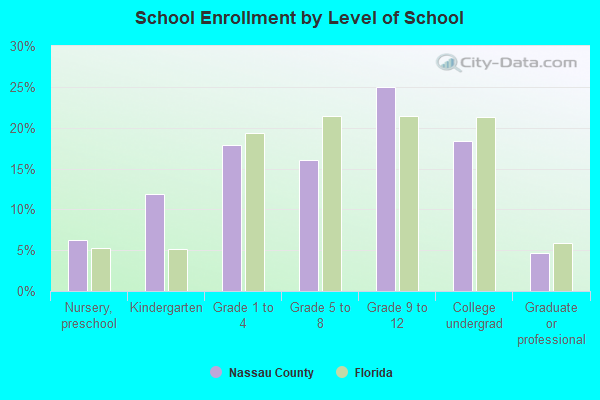
Current college students: 2,188
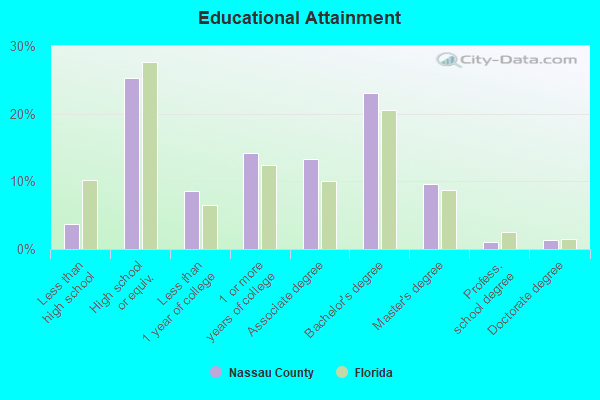
People 25 years of age or older with a high school degree or higher: 94.1%
People 25 years of age or older with a bachelor's degree or higher: 36.5%
Number of foreign born residents: 2,989 (83.7% naturalized citizens)
| Nassau County: | 3.1% |
| Whole state: | 21.7% |
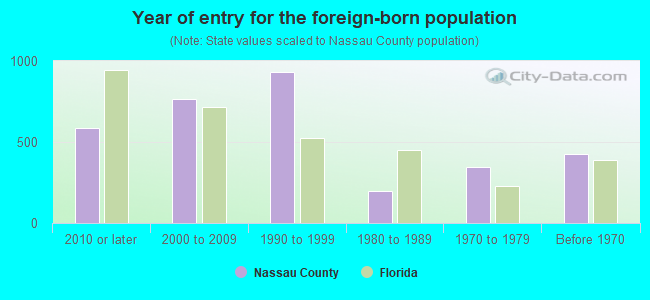
- Year of entry for the foreign-born population
- 5242010 or later
- 6792000 to 2009
- 9791990 to 1999
- 1961980 to 1989
- 3431970 to 1979
- 429Before 1970
Mean travel time to work (commute): minutes
Percentage of county residents living and working in this county: 93.0%
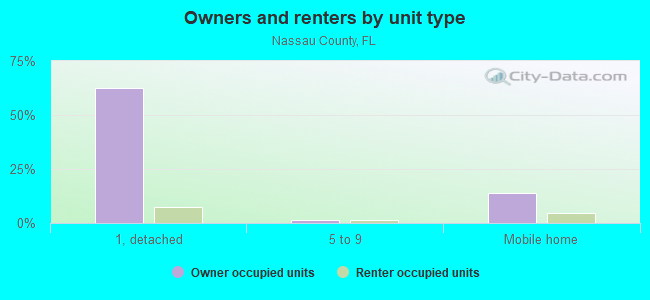
Housing units in structures:
- One, detached: 30,545
- One, attached: 1,897
- Two: 1,033
- 3 or 4: 1,009
- 5 to 9: 572
- 10 to 19: 1,269
- 20 to 49: 894
- 50 or more: 581
- Mobile homes: 7,278
- Boats, RVs, vans, etc.: 148
Housing units in Nassau County with a mortgage: 22,844 (1,509 second mortgage, 72 home equity loan, 1,152 both second mortgage and home equity loan)
Houses without a mortgage: 270
| Here: | 7.5% with mortgage |
| State: | 97.6% with mortgage |
Religion statistics for Nassau County
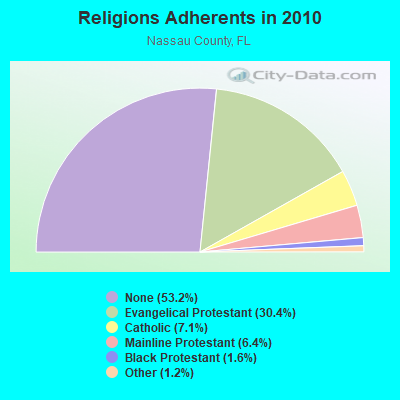
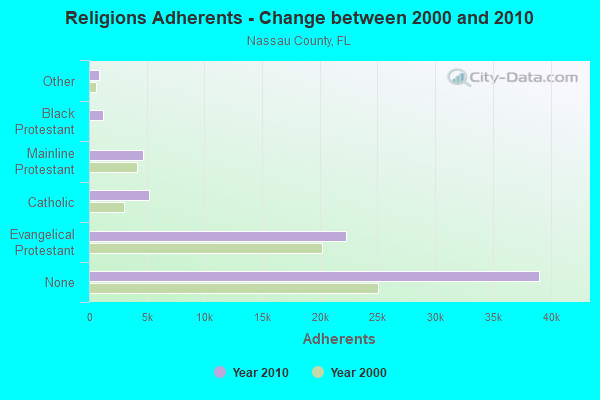
| Religion | Adherents | Congregations |
|---|---|---|
| Evangelical Protestant | 22,310 | 77 |
| Catholic | 5,192 | 2 |
| Mainline Protestant | 4,701 | 10 |
| Black Protestant | 1,181 | 7 |
| Other | 892 | 5 |
| None | 39,038 | - |
Source: Clifford Grammich, Kirk Hadaway, Richard Houseal, Dale E.Jones, Alexei Krindatch, Richie Stanley and Richard H.Taylor. 2012. 2010 U.S.Religion Census: Religious Congregations & Membership Study. Association of Statisticians of American Religious Bodies. Jones, Dale E., et al. 2002. Congregations and Membership in the United States 2000. Nashville, TN: Glenmary Research Center.
Food Environment Statistics:
| Nassau County: | 1.61 / 10,000 pop. |
| State: | 2.04 / 10,000 pop. |
| Here: | 0.15 / 10,000 pop. |
| Florida: | 0.11 / 10,000 pop. |
| This county: | 0.88 / 10,000 pop. |
| Florida: | 1.28 / 10,000 pop. |
| Nassau County: | 4.83 / 10,000 pop. |
| Florida: | 3.04 / 10,000 pop. |
| This county: | 8.93 / 10,000 pop. |
| State: | 7.45 / 10,000 pop. |
| Nassau County: | 9.7% |
| Florida: | 9.2% |
| Nassau County: | 24.6% |
| State: | 23.7% |
| Here: | 10.4% |
| State: | 14.0% |
Agriculture in Nassau County:
Average value of agricultural products sold per farm: $87,291Average value of crops sold per acre for harvested cropland: $792.39
The value of livestock, poultry, and their products as a percentage of the total market value of agricultural products sold: 92.22%
Average total farm production expenses per farm: $81,037
Average market value of all machinery and equipment per farm: $17,452
The percentage of farms operated by a family or individual: 92.70%
Average age of principal farm operators: 57 years
Corn for grain: 162 harvested acres
Vegetables: 15 harvested acres
Land in orchards: 100 acres
Earthquake activity:
Nassau County-area historical earthquake activity is significantly above Florida state average. It is 80% smaller than the overall U.S. average.On 11/22/1974 at 05:25:55, a magnitude 4.7 (4.7 MB, Class: Light, Intensity: IV - V) earthquake occurred 182.2 miles away from Nassau County center
On 8/2/1974 at 08:52:09, a magnitude 4.9 (4.3 MB, 4.9 LG) earthquake occurred 229.3 miles away from the county center
On 9/10/2006 at 14:56:08, a magnitude 5.9 (5.9 MB, 5.5 MS, 5.8 MW, Class: Moderate, Intensity: VI - VII) earthquake occurred 425.6 miles away from the county center
On 8/21/1992 at 16:31:55, a magnitude 4.4 (4.1 MB, 4.1 LG, 4.4 LG, Depth: 6.2 mi) earthquake occurred 192.1 miles away from the county center
On 11/11/2002 at 23:39:29, a magnitude 4.0 (4.0 MB, Depth: 1.5 mi) earthquake occurred 161.4 miles away from Nassau County center
On 10/24/1997 at 08:35:17, a magnitude 4.9 (4.8 MB, 4.2 MS, 4.9 LG, Depth: 6.2 mi) earthquake occurred 332.3 miles away from the county center
Magnitude types: regional Lg-wave magnitude (LG), body-wave magnitude (MB), surface-wave magnitude (MS), moment magnitude (MW)
Most recent natural disasters:
- Florida Covid-19 Pandemic, Incident Period: January 20, 2020, FEMA Id: 4486, Natural disaster type: Other
- Florida Hurricane Dorian, Incident Period: August 28, 2019 - September 9, 2019, FEMA Id: 4468, Natural disaster type: Hurricane
- Florida Hurricane Irma, Incident Period: September 4, 2017 - October 18, 2017, FEMA Id: 4337, Natural disaster type: Hurricane
- Florida Hurricane Matthew, Incident Period: October 03, 2016 to October 19, 2016, Emergency Declared EM-3377: October 06, 2016, FEMA Id: 3377, Natural disaster type: Hurricane
- Florida Hurricane Matthew, Incident Period: October 03, 2016 to October 19, 2016, Major Disaster (Presidential) Declared DR-4283: October 08, 2016, FEMA Id: 4283, Natural disaster type: Hurricane
- Florida Tropical Storm Debby, Incident Period: June 23, 2012 to July 26, 2012, Major Disaster (Presidential) Declared DR-4068: July 03, 2012, FEMA Id: 4068, Natural disaster type: Tropical Storm
- Florida Tropical Storm Fay, Incident Period: August 18, 2008 to September 12, 2008, Major Disaster (Presidential) Declared DR-1785: August 24, 2008, FEMA Id: 1785, Natural disaster type: Tropical Storm
- Florida Tropical Storm Fay, Incident Period: August 18, 2008 to September 12, 2008, Emergency Declared EM-3288: August 21, 2008, FEMA Id: 3288, Natural disaster type: Tropical Storm
- Florida Hurricane Katrina Evacuation, Incident Period: August 29, 2005 to October 01, 2005, Emergency Declared EM-3220: September 05, 2005, FEMA Id: 3220, Natural disaster type: Hurricane
- Florida Hurricane Jeanne, Incident Period: September 24, 2004 to November 17, 2004, Major Disaster (Presidential) Declared DR-1561: September 26, 2004, FEMA Id: 1561, Natural disaster type: Hurricane
- 13 other natural disasters have been reported since 1953.
The number of natural disasters in Nassau County (23) is greater than the US average (15).
Major Disasters (Presidential) Declared: 13
Emergencies Declared: 5
Causes of natural disasters: Hurricanes: 10, Fires: 4, Floods: 4, Tropical Storms: 4, Storms: 3, Tornadoes: 3, Freeze: 1, Wind: 1, Other: 1 (Note: some incidents may be assigned to more than one category).
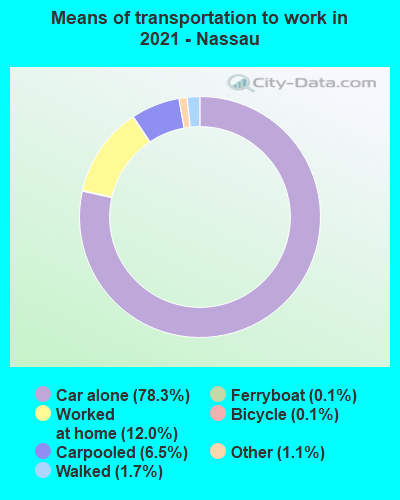
Means of transportation to work:
- Drove a car alone: 21,793 (71.3%)
- Carpooled: 2,285 (7.5%)
- Bus: 2 (0.0%)
- Ferryboat: 25 (0.1%)
- Taxicab, motorcycle, or other means: 309 (1.0%)
- Bicycle: 37 (0.1%)
- Walked: 393 (1.3%)
- Worked at home: 5,960 (19.5%)


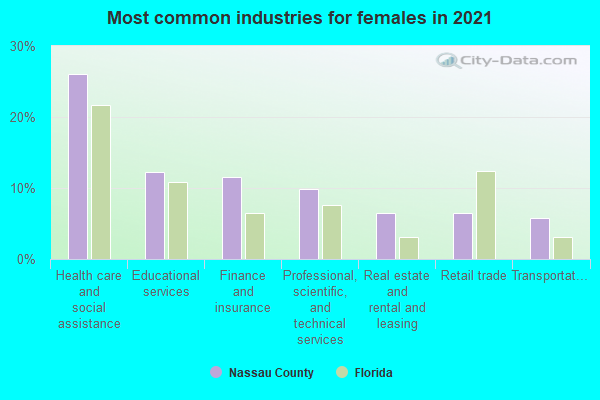
- Health care and social assistance (14%)
- Accommodation and food services (11%)
- Educational services (11%)
- Retail trade (10%)
- Public administration (7%)
- Finance and insurance (6%)
- Professional, scientific, and technical services (6%)
- Health care and social assistance (15%)
- Accommodation and food services (13%)
- Educational services (12%)
- Retail trade (12%)
- Public administration (8%)
- Finance and insurance (7%)
- Professional, scientific, and technical services (7%)
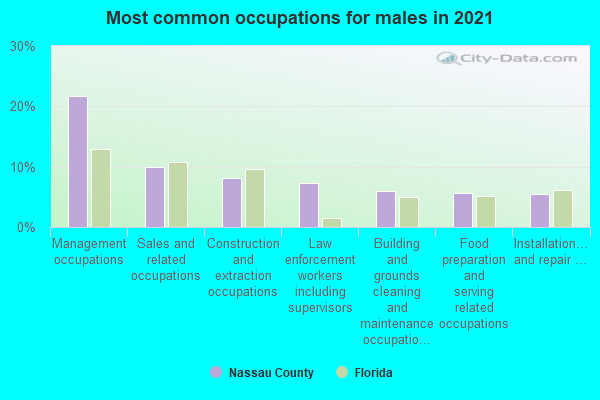
- Management occupations (14%)
- Transportation occupations (9%)
- Installation, maintenance, and repair occupations (9%)
- Construction and extraction occupations (8%)
- Office and administrative support occupations (7%)
- Sales and related occupations (7%)
- Material moving occupations (6%)

- Office and administrative support occupations (24%)
- Management occupations (12%)
- Sales and related occupations (12%)
- Educational instruction, and library occupations (8%)
- Food preparation and serving related occupations (7%)
- Health diagnosing and treating practitioners and other technical occupations (7%)
- Business and financial operations occupations (6%)
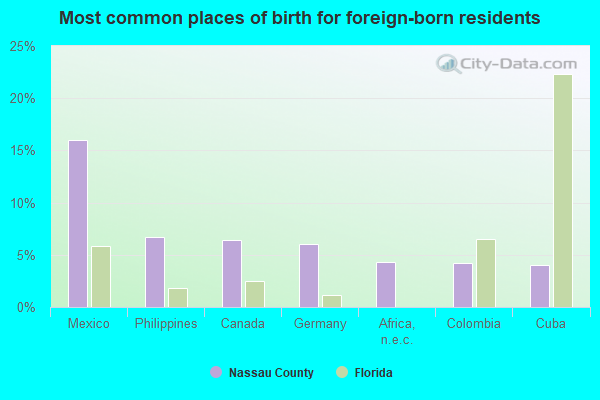
- Mexico (10%)
- Philippines (7%)
- Canada (6%)
- Germany (6%)
- Czechoslovakia (includes Czech Republic and Slovakia) (4%)
- India (4%)
- Colombia (4%)

- American (33%)
- English (14%)
- Irish (7%)
- German (7%)
- Italian (3%)
- European (2%)
- Scotch-Irish (1%)
People in group quarters in Nassau County, Florida in 2010:
- 233 people in nursing facilities/skilled-nursing facilities
- 196 people in local jails and other municipal confinement facilities
- 81 people in residential treatment centers for adults
- 30 people in emergency and transitional shelters (with sleeping facilities) for people experiencing homelessness
- 3 people in correctional facilities intended for juveniles
People in group quarters in Nassau County, Florida in 2000:
- 275 people in nursing homes
- 178 people in local jails and other confinement facilities (including police lockups)
- 94 people in other noninstitutional group quarters
- 78 people in other nonhousehold living situations
- 60 people in unknown juvenile institutions
- 2 people in other group homes
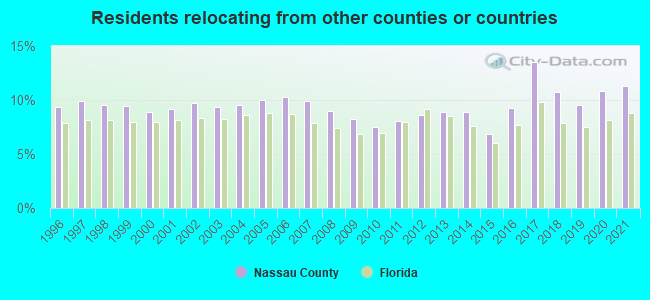
11.27% of this county's 2021 resident taxpayers lived in other counties in 2020 ($140,189 average adjusted gross income)
| Here: | 11.27% |
| Florida average: | 8.80% |
0.06% of residents moved from foreign countries ($436 average AGI)
Nassau County: 0.06% Florida average: 0.05%
4.88% relocated from other counties in Florida ($37,459 average AGI)
6.33% relocated from other states ($102,294 average AGI)
Nassau County: 6.33% Florida average: 4.38%
Top counties from which taxpayers relocated into this county between 2020 and 2021:
| from Duval County, FL | |
| from Camden County, GA | |
| from Clay County, FL | |
| from St. Johns County, FL | |
| from Cobb County, GA | |
| from Broward County, FL | |
| from Palm Beach County, FL |
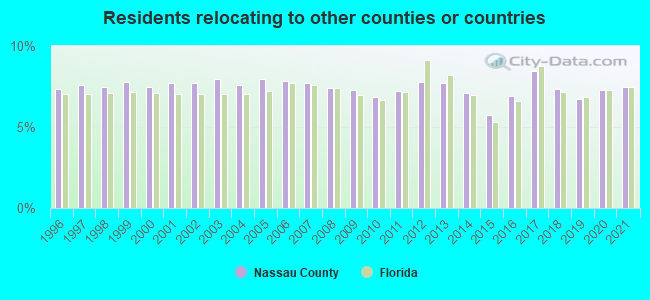
7.47% of this county's 2020 resident taxpayers moved to other counties in 2021 ($94,065 average adjusted gross income)
| Here: | 7.47% |
| Florida average: | 7.45% |
10 or fewer of this county's residents moved to foreign countries.
3.72% relocated to other counties in Florida ($50,001 average AGI)
3.75% relocated to other states ($44,064 average AGI)
Nassau County: 3.75% Florida average: 2.97%
Top counties to which taxpayers relocated from this county between 2020 and 2021:
| to Duval County, FL | |
| to Camden County, GA | |
| to Clay County, FL | |
| to St. Johns County, FL | |
| to Charlton County, GA | |
| to Baker County, FL | |
| to Orange County, FL |
Births per 1000 population from 1990 to 1999: 14.1
Births per 1000 population from 2000 to 2006: 11.9

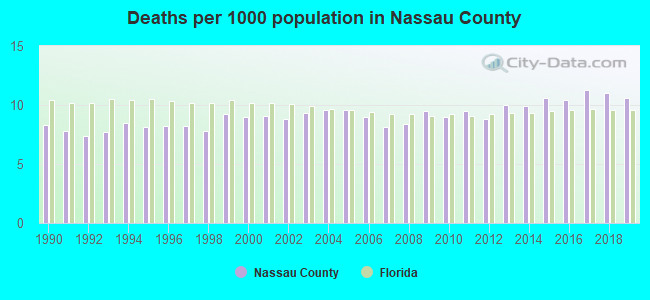
Deaths per 1000 population from 1990 to 1999: 8.1
Deaths per 1000 population from 2000 to 2009: 9.0
Deaths per 1000 population from 2010 to 2020: 10.3
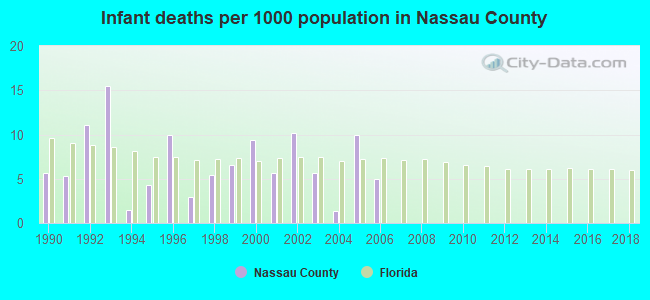
Infant deaths per 1000 live births from 1990 to 1999: 6.8
Infant deaths per 1000 live births from 2000 to 2006: 6.7
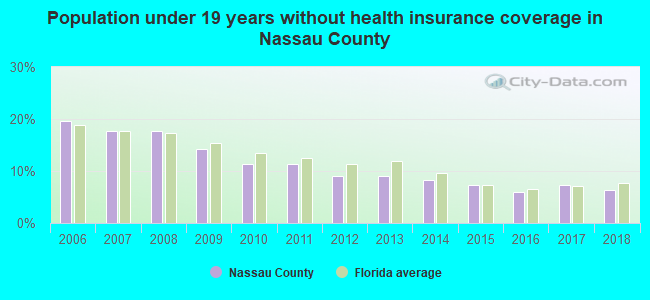
Persons under 19 years old without health insurance coverage in 2018: 6.4%

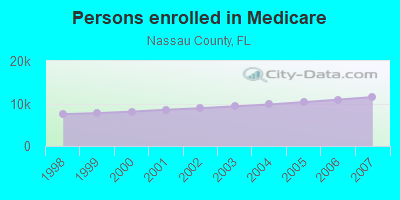
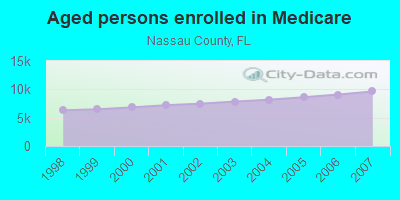
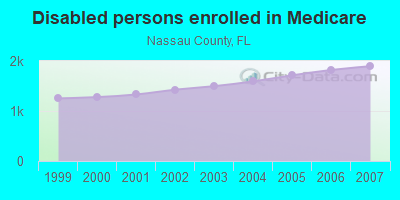
Persons enrolled in hospital insurance and/or supplemental medical insurance (Medicare) in July 1, 2007: 11,516 (9,620 aged, 1,896 disabled)
Children under 18 without health insurance coverage in 2007: 2,730 (17%)
Most common underlying causes of death in Nassau County, Florida in 1999 - 2019:
- Bronchus or lung, unspecified - Malignant neoplasms (1,157)
- Atherosclerotic heart disease (1,057)
- Chronic obstructive pulmonary disease, unspecified (835)
- Acute myocardial infarction, unspecified (638)
- Unspecified dementia (539)
- Alzheimer disease, unspecified (316)
- Stroke, not specified as haemorrhage or infarction (315)
- Pneumonia, unspecified (246)
- Breast, unspecified - Malignant neoplasms (206)
- Colon, unspecified - Malignant neoplasms (201)
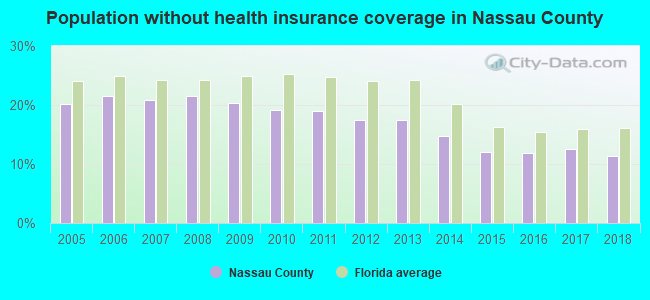
Population without health insurance coverage in 2000: 11%
Children under 18 without health insurance coverage in 2000: 8%
Short term general hospital admissions per 100,000 population in 2004: 4,015
Short term general hospital beds per 100,000 population in 2004: 51
Emergency room visits per 100,000 population in 2004: 28,635
General practice office based MDs per 100,000 population in 2005: 1,080
Medical specialist MDs per 100,000 population in 2005: 927
Dentists per 100,000 population in 1998: 8
Total births per 100,000 population, July 2005 - July 2006 : 25
Total deaths per 100,000 population, July 2005 - July 2006: 73
Limited-service eating places per 100,000 population in 2005 : 22
Homicides per 1,000,000 population from 2000 to 2006: 62.4. This is more than state average.
Suicides per 1,000,000 population from 2000 to 2006: 164.1. This is more than state average.
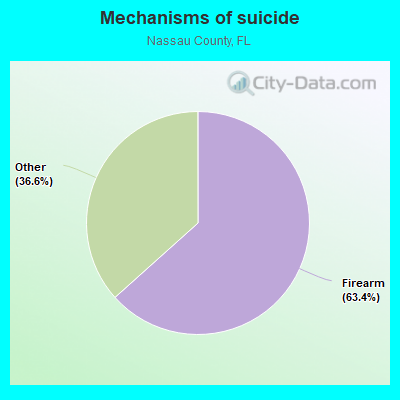
- Firearm - 104.0
- Other - 60.1
Household type by relationship:
Households: 97,899- Male householders: 21,515 (3,142 living alone), Female householders: 19,832 (5,377 living alone)
25,926 spouses (25,883 opposite-sex spouses), 2,437 unmarried partners, (2,238 opposite-sex unmarried partners), 21,809 children (18,869 natural, 1,368 adopted, 1,572 stepchildren), 1,888 grandchildren, 177 brothers or sisters, 693 parents, 84 foster children, 1,363 other relatives, 1,393 non-relatives
- In group quarters: 782
Size of family households: 16,460 2-persons, 7,828 3-persons, 4,024 4-persons, 1,513 5-persons, 581 6-persons, 78 7-or-more-persons.
Size of nonfamily households: 8,519 1-person, 2,146 2-persons, 198 4-persons.
12,664 married couples with children.
3,807 single-parent households (1,220 men, 2,587 women).
94.2% of residents of Nassau speak English at home.
3.2% of residents speak Spanish at home (60% speak English very well, 29% speak English well, 7% speak English not well, 4% don't speak English at all).
1.5% of residents speak other Indo-European language at home (84% speak English very well, 10% speak English well, 5% speak English not well).
0.5% of residents speak Asian or Pacific Island language at home (73% speak English very well, 18% speak English well, 8% speak English not well).
0.2% of residents speak other language at home (96% speak English very well, 4% speak English well).
In fiscal year 2004:
Federal Government expenditure: $365,717,000 ($5,791 per capita)
Department of Defense expenditure: $36,658,000
Federal direct payments to individuals for retirement and disability: $190,736,000
Federal other direct payments to individuals: $55,351,000
Federal direct payments not to individuals: $263,000
Federal grants: $43,571,000
Federal procurement contracts: $2,502,000 ($516,000 Department of Defense)
Federal salaries and wages: $73,294,000 ($10,935,000 Department of Defense)
Federal Government direct loans: $84,000
Federal guaranteed/insured loans: $50,404,000
Federal Government insurance: $1,765,512,000
Population change from April 1, 2000 to July 1, 2005:
Births: 3,724| Here: | 58 per 1000 residents |
| State: | 63 per 1000 residents |
Deaths: 2,904
| Here: | 45 per 1000 residents |
| State: | 49 per 1000 residents |
Net international migration: +214
| Here: | +3 per 1000 residents |
| State: | +30 per 1000 residents |
Net internal migration: +6,165
| Here: | +95 per 1000 residents |
| State: | +59 per 1000 residents |

Total withdrawal of fresh water for public supply: 6.81 millions of gallons per day (all from ground)
| Here: | 6.4 |
| State: | 5.9 |
| Here: | 4.5 |
| State: | 4.2 |
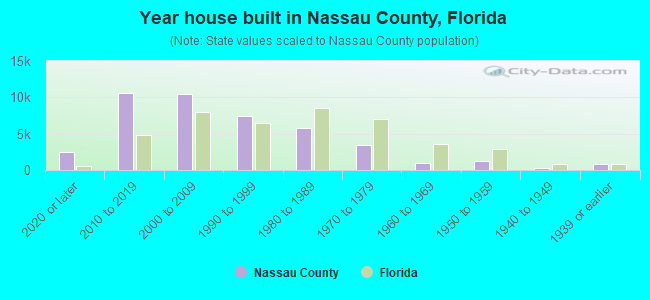
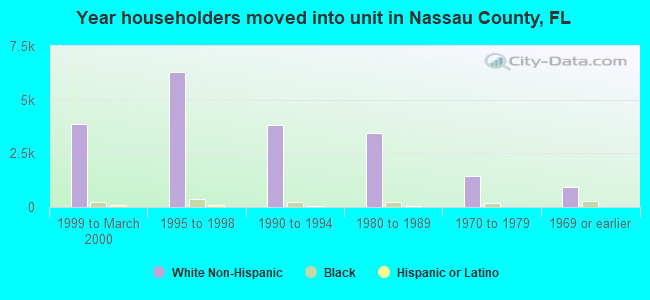
- Year house built in Nassau County, Florida
- 3,8282020 or later
- 10,5772010 to 2019
- 11,2682000 to 2009
- 8,2481990 to 1999
- 5,0431980 to 1989
- 3,0311970 to 1979
- 1,3701960 to 1969
- 1,0271950 to 1959
- 4591940 to 1949
- 3751939 or earlier
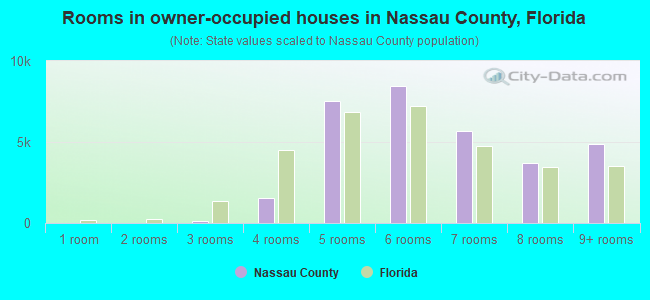
- Rooms in owner-occupied houses in Nassau County, Florida
- 571 room
- 1202 rooms
- 6523 rooms
- 3,1334 rooms
- 7,0295 rooms
- 7,4286 rooms
- 5,5007 rooms
- 5,4248 rooms
- 6,5449+ rooms
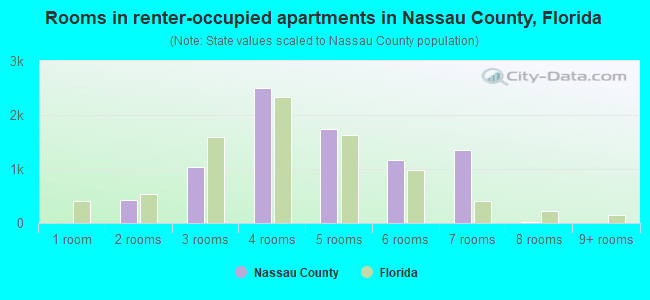
- Rooms in renter-occupied apartments in Nassau County, Florida
- 01 room
- 4612 rooms
- 1,2873 rooms
- 1,0254 rooms
- 1,2835 rooms
- 7016 rooms
- 2397 rooms
- 3348 rooms
- 1309+ rooms

- Bedrooms in owner-occupied houses in Nassau County, Florida
- 167no bedroom
- 4361 bedroom
- 4,2212 bedrooms
- 18,5613 bedrooms
- 11,2594 bedrooms
- 1,2435+ bedrooms
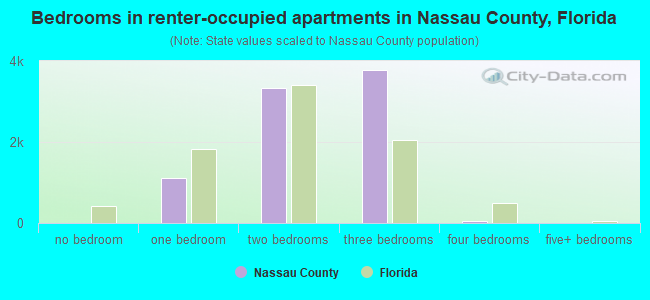
- Bedrooms in renter-occupied apartments in Nassau County, Florida
- 0no bedroom
- 1,1281 bedroom
- 2,1572 bedrooms
- 1,6683 bedrooms
- 4014 bedrooms
- 1065+ bedrooms
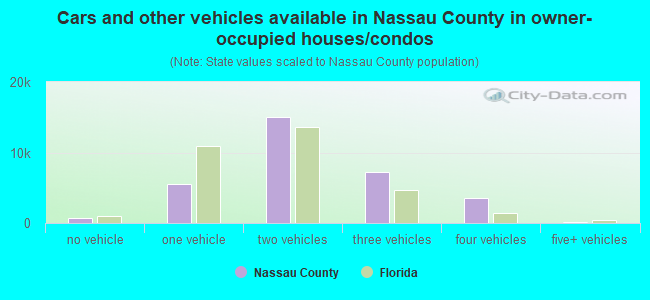
- Cars and other vehicles available in Nassau County in owner-occupied houses/condos
- 806no vehicle
- 9,9031 vehicle
- 16,5032 vehicles
- 5,2983 vehicles
- 1,9724 vehicles
- 1,4055+ vehicles
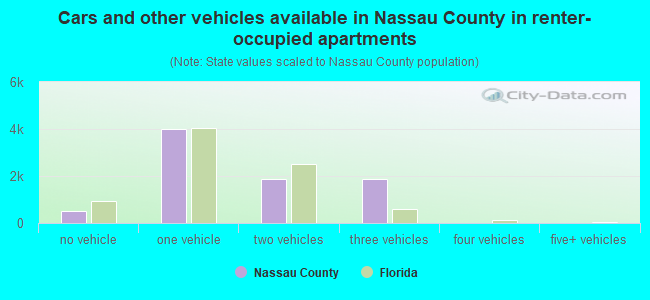
- Cars and other vehicles available in Nassau County in renter-occupied apartments
- 492no vehicle
- 2,7771 vehicle
- 1,9192 vehicles
- 2323 vehicles
- 404 vehicles
- 05+ vehicles
87.3% of Nassau County residents lived in the same house 1 years ago.
Out of people who lived in different houses, 25% lived in this county.
Out of people who lived in different counties, 36% lived in Florida.
| Nassau County: | 87.3% |
| State average: | 86.3% |
Place of birth for U.S.-born residents:
- This state: 41,014
- Other state: 52,395
- Northeast: 16,583
- Midwest: 7,763
- South: 23,317
- West: 4,732
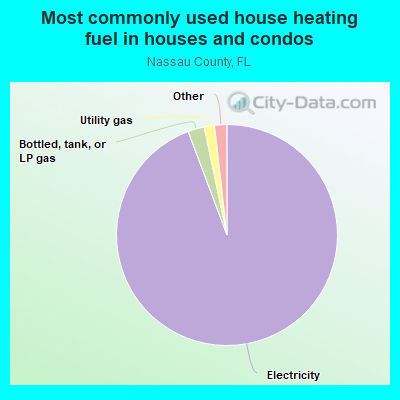
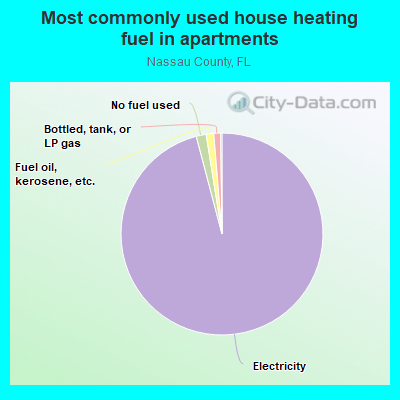
- 93.3%Electricity
- 2.9%Bottled, tank, or LP gas
- 1.9%Utility gas
- 1.0%No fuel used
- 0.4%Solar energy
- 0.4%Fuel oil, kerosene, etc.
- 0.1%Wood
- 93.7%Electricity
- 3.0%No fuel used
- 1.6%Fuel oil, kerosene, etc.
- 1.1%Bottled, tank, or LP gas
- 0.4%Utility gas
- 0.1%Solar energy
Private vs. public school enrollment:
| Here: | 28.7% |
| Florida: | 15.8% |
| Here: | 19.9% |
| Florida: | 12.9% |
| Here: | 28.2% |
| Florida: | 23.6% |


Nassau County government finances - Expenditure in 2020:
- Bond Funds - Cash and Securities: $17,688,000
Cash and Securities: $11,722,000
- Charges - Other: $5,441,000
Other: $5,407,000
Sewerage: $2,656,000
Sewerage: $2,458,000
Regular Highways: $186,000
Regular Highways: $69,000
Solid Waste Management: $6,000
- Construction - Regular Highways: $4,963,000
Regular Highways: $2,028,000
General - Other: $1,327,000
General - Other: $1,101,000
- Current Operations - General - Other: $15,859,000
Police Protection: $14,456,000
Police Protection: $12,563,000
General - Other: $11,579,000
Health - Other: $10,945,000
Financial Administration: $10,921,000
Health - Other: $10,517,000
Regular Highways: $8,722,000
Financial Administration: $8,618,000
Correctional Institutions: $8,470,000
Local Fire Protection: $7,621,000
Local Fire Protection: $7,168,000
Correctional Institutions: $7,040,000
Regular Highways: $6,796,000
Central Staff Services: $4,267,000
Natural Resources - Other: $3,287,000
Judicial and Legal Services: $2,959,000
Central Staff Services: $2,830,000
Sewerage: $2,723,000
Judicial and Legal Services: $2,394,000
Sewerage: $2,167,000
General Public Buildings: $1,795,000
General Public Buildings: $1,525,000
Libraries: $1,372,000
Solid Waste Management: $1,286,000
Libraries: $1,215,000
Solid Waste Management: $1,127,000
Natural Resources - Other: $1,118,000
Protective Inspection and Regulation - Other: $790,000
Parks and Recreation: $665,000
Housing and Community Development: $575,000
Protective Inspection and Regulation - Other: $566,000
Parks and Recreation: $545,000
Public Welfare - Other: $477,000
Public Welfare - Other: $470,000
Housing and Community Development: $332,000
Water Utilities: $92,000
Water Utilities: $86,000
- Federal Intergovernmental - Other: $8,481,000
Other: $1,600,000
- General - Interest on Debt: $1,819,000
Interest on Debt: $1,709,000
- Intergovernmental to State - Health - Other: $2,000,000
Health - Other: $2,000,000
- Local Intergovernmental - Other: $777,000
Other: $186,000
Public Welfare: $8,000
- Long Term Debt - Beginning Outstanding - Unspecified Public Purpose: $45,592,000
Outstanding Unspecified Public Purpose: $40,077,000
Beginning Outstanding - Unspecified Public Purpose: $36,475,000
Outstanding Unspecified Public Purpose: $33,723,000
Beginning Outstanding - Public Debt for Private Purpose: $9,875,000
Outstanding Nonguaranteed - Industrial Revenue: $9,715,000
Beginning Outstanding - Public Debt for Private Purpose: $9,555,000
Outstanding Nonguaranteed - Industrial Revenue: $9,395,000
Retired Unspecified Public Purpose: $5,053,000
Retired Unspecified Public Purpose: $4,322,000
Retired Nonguaranteed - Public Debt for Private Purpose: $160,000
Retired Nonguaranteed - Public Debt for Private Purpose: $160,000
- Miscellaneous - Special Assessments: $6,091,000
Special Assessments: $3,383,000
Interest Earnings: $2,423,000
General Revenue - Other: $1,669,000
General Revenue - Other: $1,359,000
Interest Earnings: $765,000
Fines and Forfeits: $635,000
Fines and Forfeits: $631,000
Donations From Private Sources: $234,000
Sale of Property: $193,000
Sale of Property: $66,000
Donations From Private Sources: $56,000
Rents: $19,000
Rents: $19,000
- Other Capital Outlay - Police Protection: $2,086,000
Police Protection: $2,050,000
Sewerage: $1,455,000
Local Fire Protection: $1,270,000
Health - Other: $1,079,000
Health - Other: $898,000
Sewerage: $625,000
General Public Building: $447,000
Parks and Recreation: $432,000
Solid Waste Management: $327,000
Correctional Institutions: $310,000
Natural Resources - Other: $244,000
Financial Administration: $226,000
Judicial and Legal Services: $200,000
Libraries: $191,000
Protective Inspection and Regulation - Other: $154,000
Libraries: $150,000
Solid Waste Management: $148,000
Central Staff Services: $129,000
Protective Inspection and Regulation - Other: $94,000
Local Fire Protection: $94,000
Correctional Institutions: $87,000
General Public Building: $77,000
Financial Administration: $62,000
Natural Resources - Other: $42,000
Central Staff Services: $33,000
Judicial and Legal Services: $26,000
Housing and Community Development: $18,000
Parks and Recreation: $1,000
Housing and Community Development: $1,000
- Other Funds - Cash and Securities: $102,096,000
Cash and Securities: $73,601,000
- Revenue - Water Utilities: $1,736,000
Water Utilities: $1,584,000
- Sinking Funds - Cash and Securities: $9,715,000
Cash and Securities: $9,395,000
- State Intergovernmental - General Local Government Support: $7,776,000
General Local Government Support: $6,878,000
Highways: $5,384,000
Highways: $3,033,000
Other: $1,666,000
Other: $1,085,000
Health and Hospitals: $223,000
Health and Hospitals: $223,000
- Tax - Property: $75,024,000
Property: $54,409,000
General Sales and Gross Receipts: $11,016,000
General Sales and Gross Receipts: $9,640,000
Other Selective Sales: $7,739,000
Other Selective Sales: $5,538,000
Motor Fuels Sales: $3,597,000
Other License: $2,998,000
Motor Fuels Sales: $2,861,000
Other License: $2,402,000
Public Utilities Sales: $679,000
Public Utilities Sales: $638,000
Documentary and Stock Transfer: $535,000
Documentary and Stock Transfer: $491,000
- Water Utilities - Interest on Debt: $307,000
Interest on Debt: $266,000
Nassau County government finances - Revenue in 2020:
- Bond Funds - Cash and Securities: $17,688,000
Cash and Securities: $11,722,000
- Charges - Other: $5,441,000
Other: $5,407,000
Sewerage: $2,656,000
Sewerage: $2,458,000
Regular Highways: $186,000
Regular Highways: $69,000
Solid Waste Management: $6,000
- Construction - Regular Highways: $4,963,000
Regular Highways: $2,028,000
General - Other: $1,327,000
General - Other: $1,101,000
- Current Operations - General - Other: $15,859,000
Police Protection: $14,456,000
Police Protection: $12,563,000
General - Other: $11,579,000
Health - Other: $10,945,000
Financial Administration: $10,921,000
Health - Other: $10,517,000
Regular Highways: $8,722,000
Financial Administration: $8,618,000
Correctional Institutions: $8,470,000
Local Fire Protection: $7,621,000
Local Fire Protection: $7,168,000
Correctional Institutions: $7,040,000
Regular Highways: $6,796,000
Central Staff Services: $4,267,000
Natural Resources - Other: $3,287,000
Judicial and Legal Services: $2,959,000
Central Staff Services: $2,830,000
Sewerage: $2,723,000
Judicial and Legal Services: $2,394,000
Sewerage: $2,167,000
General Public Buildings: $1,795,000
General Public Buildings: $1,525,000
Libraries: $1,372,000
Solid Waste Management: $1,286,000
Libraries: $1,215,000
Solid Waste Management: $1,127,000
Natural Resources - Other: $1,118,000
Protective Inspection and Regulation - Other: $790,000
Parks and Recreation: $665,000
Housing and Community Development: $575,000
Protective Inspection and Regulation - Other: $566,000
Parks and Recreation: $545,000
Public Welfare - Other: $477,000
Public Welfare - Other: $470,000
Housing and Community Development: $332,000
Water Utilities: $92,000
Water Utilities: $86,000
- Federal Intergovernmental - Other: $8,481,000
Other: $1,600,000
- General - Interest on Debt: $1,819,000
Interest on Debt: $1,709,000
- Intergovernmental to State - Health - Other: $2,000,000
Health - Other: $2,000,000
- Local Intergovernmental - Other: $777,000
Other: $186,000
Public Welfare: $8,000
- Long Term Debt - Beginning Outstanding - Unspecified Public Purpose: $45,592,000
Outstanding Unspecified Public Purpose: $40,077,000
Beginning Outstanding - Unspecified Public Purpose: $36,475,000
Outstanding Unspecified Public Purpose: $33,723,000
Beginning Outstanding - Public Debt for Private Purpose: $9,875,000
Outstanding Nonguaranteed - Industrial Revenue: $9,715,000
Beginning Outstanding - Public Debt for Private Purpose: $9,555,000
Outstanding Nonguaranteed - Industrial Revenue: $9,395,000
Retired Unspecified Public Purpose: $5,053,000
Retired Unspecified Public Purpose: $4,322,000
Retired Nonguaranteed - Public Debt for Private Purpose: $160,000
Retired Nonguaranteed - Public Debt for Private Purpose: $160,000
- Miscellaneous - Special Assessments: $6,091,000
Special Assessments: $3,383,000
Interest Earnings: $2,423,000
General Revenue - Other: $1,669,000
General Revenue - Other: $1,359,000
Interest Earnings: $765,000
Fines and Forfeits: $635,000
Fines and Forfeits: $631,000
Donations From Private Sources: $234,000
Sale of Property: $193,000
Sale of Property: $66,000
Donations From Private Sources: $56,000
Rents: $19,000
Rents: $19,000
- Other Capital Outlay - Police Protection: $2,086,000
Police Protection: $2,050,000
Sewerage: $1,455,000
Local Fire Protection: $1,270,000
Health - Other: $1,079,000
Health - Other: $898,000
Sewerage: $625,000
General Public Building: $447,000
Parks and Recreation: $432,000
Solid Waste Management: $327,000
Correctional Institutions: $310,000
Natural Resources - Other: $244,000
Financial Administration: $226,000
Judicial and Legal Services: $200,000
Libraries: $191,000
Protective Inspection and Regulation - Other: $154,000
Libraries: $150,000
Solid Waste Management: $148,000
Central Staff Services: $129,000
Protective Inspection and Regulation - Other: $94,000
Local Fire Protection: $94,000
Correctional Institutions: $87,000
General Public Building: $77,000
Financial Administration: $62,000
Natural Resources - Other: $42,000
Central Staff Services: $33,000
Judicial and Legal Services: $26,000
Housing and Community Development: $18,000
Parks and Recreation: $1,000
Housing and Community Development: $1,000
- Other Funds - Cash and Securities: $102,096,000
Cash and Securities: $73,601,000
- Revenue - Water Utilities: $1,736,000
Water Utilities: $1,584,000
- Sinking Funds - Cash and Securities: $9,715,000
Cash and Securities: $9,395,000
- State Intergovernmental - General Local Government Support: $7,776,000
General Local Government Support: $6,878,000
Highways: $5,384,000
Highways: $3,033,000
Other: $1,666,000
Other: $1,085,000
Health and Hospitals: $223,000
Health and Hospitals: $223,000
- Tax - Property: $75,024,000
Property: $54,409,000
General Sales and Gross Receipts: $11,016,000
General Sales and Gross Receipts: $9,640,000
Other Selective Sales: $7,739,000
Other Selective Sales: $5,538,000
Motor Fuels Sales: $3,597,000
Other License: $2,998,000
Motor Fuels Sales: $2,861,000
Other License: $2,402,000
Public Utilities Sales: $679,000
Public Utilities Sales: $638,000
Documentary and Stock Transfer: $535,000
Documentary and Stock Transfer: $491,000
- Water Utilities - Interest on Debt: $307,000
Interest on Debt: $266,000
Nassau County government finances - Debt in 2020:
- Bond Funds - Cash and Securities: $17,688,000
Cash and Securities: $11,722,000
- Charges - Other: $5,441,000
Other: $5,407,000
Sewerage: $2,656,000
Sewerage: $2,458,000
Regular Highways: $186,000
Regular Highways: $69,000
Solid Waste Management: $6,000
- Construction - Regular Highways: $4,963,000
Regular Highways: $2,028,000
General - Other: $1,327,000
General - Other: $1,101,000
- Current Operations - General - Other: $15,859,000
Police Protection: $14,456,000
Police Protection: $12,563,000
General - Other: $11,579,000
Health - Other: $10,945,000
Financial Administration: $10,921,000
Health - Other: $10,517,000
Regular Highways: $8,722,000
Financial Administration: $8,618,000
Correctional Institutions: $8,470,000
Local Fire Protection: $7,621,000
Local Fire Protection: $7,168,000
Correctional Institutions: $7,040,000
Regular Highways: $6,796,000
Central Staff Services: $4,267,000
Natural Resources - Other: $3,287,000
Judicial and Legal Services: $2,959,000
Central Staff Services: $2,830,000
Sewerage: $2,723,000
Judicial and Legal Services: $2,394,000
Sewerage: $2,167,000
General Public Buildings: $1,795,000
General Public Buildings: $1,525,000
Libraries: $1,372,000
Solid Waste Management: $1,286,000
Libraries: $1,215,000
Solid Waste Management: $1,127,000
Natural Resources - Other: $1,118,000
Protective Inspection and Regulation - Other: $790,000
Parks and Recreation: $665,000
Housing and Community Development: $575,000
Protective Inspection and Regulation - Other: $566,000
Parks and Recreation: $545,000
Public Welfare - Other: $477,000
Public Welfare - Other: $470,000
Housing and Community Development: $332,000
Water Utilities: $92,000
Water Utilities: $86,000
- Federal Intergovernmental - Other: $8,481,000
Other: $1,600,000
- General - Interest on Debt: $1,819,000
Interest on Debt: $1,709,000
- Intergovernmental to State - Health - Other: $2,000,000
Health - Other: $2,000,000
- Local Intergovernmental - Other: $777,000
Other: $186,000
Public Welfare: $8,000
- Long Term Debt - Beginning Outstanding - Unspecified Public Purpose: $45,592,000
Outstanding Unspecified Public Purpose: $40,077,000
Beginning Outstanding - Unspecified Public Purpose: $36,475,000
Outstanding Unspecified Public Purpose: $33,723,000
Beginning Outstanding - Public Debt for Private Purpose: $9,875,000
Outstanding Nonguaranteed - Industrial Revenue: $9,715,000
Beginning Outstanding - Public Debt for Private Purpose: $9,555,000
Outstanding Nonguaranteed - Industrial Revenue: $9,395,000
Retired Unspecified Public Purpose: $5,053,000
Retired Unspecified Public Purpose: $4,322,000
Retired Nonguaranteed - Public Debt for Private Purpose: $160,000
Retired Nonguaranteed - Public Debt for Private Purpose: $160,000
- Miscellaneous - Special Assessments: $6,091,000
Special Assessments: $3,383,000
Interest Earnings: $2,423,000
General Revenue - Other: $1,669,000
General Revenue - Other: $1,359,000
Interest Earnings: $765,000
Fines and Forfeits: $635,000
Fines and Forfeits: $631,000
Donations From Private Sources: $234,000
Sale of Property: $193,000
Sale of Property: $66,000
Donations From Private Sources: $56,000
Rents: $19,000
Rents: $19,000
- Other Capital Outlay - Police Protection: $2,086,000
Police Protection: $2,050,000
Sewerage: $1,455,000
Local Fire Protection: $1,270,000
Health - Other: $1,079,000
Health - Other: $898,000
Sewerage: $625,000
General Public Building: $447,000
Parks and Recreation: $432,000
Solid Waste Management: $327,000
Correctional Institutions: $310,000
Natural Resources - Other: $244,000
Financial Administration: $226,000
Judicial and Legal Services: $200,000
Libraries: $191,000
Protective Inspection and Regulation - Other: $154,000
Libraries: $150,000
Solid Waste Management: $148,000
Central Staff Services: $129,000
Protective Inspection and Regulation - Other: $94,000
Local Fire Protection: $94,000
Correctional Institutions: $87,000
General Public Building: $77,000
Financial Administration: $62,000
Natural Resources - Other: $42,000
Central Staff Services: $33,000
Judicial and Legal Services: $26,000
Housing and Community Development: $18,000
Parks and Recreation: $1,000
Housing and Community Development: $1,000
- Other Funds - Cash and Securities: $102,096,000
Cash and Securities: $73,601,000
- Revenue - Water Utilities: $1,736,000
Water Utilities: $1,584,000
- Sinking Funds - Cash and Securities: $9,715,000
Cash and Securities: $9,395,000
- State Intergovernmental - General Local Government Support: $7,776,000
General Local Government Support: $6,878,000
Highways: $5,384,000
Highways: $3,033,000
Other: $1,666,000
Other: $1,085,000
Health and Hospitals: $223,000
Health and Hospitals: $223,000
- Tax - Property: $75,024,000
Property: $54,409,000
General Sales and Gross Receipts: $11,016,000
General Sales and Gross Receipts: $9,640,000
Other Selective Sales: $7,739,000
Other Selective Sales: $5,538,000
Motor Fuels Sales: $3,597,000
Other License: $2,998,000
Motor Fuels Sales: $2,861,000
Other License: $2,402,000
Public Utilities Sales: $679,000
Public Utilities Sales: $638,000
Documentary and Stock Transfer: $535,000
Documentary and Stock Transfer: $491,000
- Water Utilities - Interest on Debt: $307,000
Interest on Debt: $266,000
Nassau County government finances - Cash and Securities in 2020:
- Bond Funds - Cash and Securities: $17,688,000
Cash and Securities: $11,722,000
- Charges - Other: $5,441,000
Other: $5,407,000
Sewerage: $2,656,000
Sewerage: $2,458,000
Regular Highways: $186,000
Regular Highways: $69,000
Solid Waste Management: $6,000
- Construction - Regular Highways: $4,963,000
Regular Highways: $2,028,000
General - Other: $1,327,000
General - Other: $1,101,000
- Current Operations - General - Other: $15,859,000
Police Protection: $14,456,000
Police Protection: $12,563,000
General - Other: $11,579,000
Health - Other: $10,945,000
Financial Administration: $10,921,000
Health - Other: $10,517,000
Regular Highways: $8,722,000
Financial Administration: $8,618,000
Correctional Institutions: $8,470,000
Local Fire Protection: $7,621,000
Local Fire Protection: $7,168,000
Correctional Institutions: $7,040,000
Regular Highways: $6,796,000
Central Staff Services: $4,267,000
Natural Resources - Other: $3,287,000
Judicial and Legal Services: $2,959,000
Central Staff Services: $2,830,000
Sewerage: $2,723,000
Judicial and Legal Services: $2,394,000
Sewerage: $2,167,000
General Public Buildings: $1,795,000
General Public Buildings: $1,525,000
Libraries: $1,372,000
Solid Waste Management: $1,286,000
Libraries: $1,215,000
Solid Waste Management: $1,127,000
Natural Resources - Other: $1,118,000
Protective Inspection and Regulation - Other: $790,000
Parks and Recreation: $665,000
Housing and Community Development: $575,000
Protective Inspection and Regulation - Other: $566,000
Parks and Recreation: $545,000
Public Welfare - Other: $477,000
Public Welfare - Other: $470,000
Housing and Community Development: $332,000
Water Utilities: $92,000
Water Utilities: $86,000
- Federal Intergovernmental - Other: $8,481,000
Other: $1,600,000
- General - Interest on Debt: $1,819,000
Interest on Debt: $1,709,000
- Intergovernmental to State - Health - Other: $2,000,000
Health - Other: $2,000,000
- Local Intergovernmental - Other: $777,000
Other: $186,000
Public Welfare: $8,000
- Long Term Debt - Beginning Outstanding - Unspecified Public Purpose: $45,592,000
Outstanding Unspecified Public Purpose: $40,077,000
Beginning Outstanding - Unspecified Public Purpose: $36,475,000
Outstanding Unspecified Public Purpose: $33,723,000
Beginning Outstanding - Public Debt for Private Purpose: $9,875,000
Outstanding Nonguaranteed - Industrial Revenue: $9,715,000
Beginning Outstanding - Public Debt for Private Purpose: $9,555,000
Outstanding Nonguaranteed - Industrial Revenue: $9,395,000
Retired Unspecified Public Purpose: $5,053,000
Retired Unspecified Public Purpose: $4,322,000
Retired Nonguaranteed - Public Debt for Private Purpose: $160,000
Retired Nonguaranteed - Public Debt for Private Purpose: $160,000
- Miscellaneous - Special Assessments: $6,091,000
Special Assessments: $3,383,000
Interest Earnings: $2,423,000
General Revenue - Other: $1,669,000
General Revenue - Other: $1,359,000
Interest Earnings: $765,000
Fines and Forfeits: $635,000
Fines and Forfeits: $631,000
Donations From Private Sources: $234,000
Sale of Property: $193,000
Sale of Property: $66,000
Donations From Private Sources: $56,000
Rents: $19,000
Rents: $19,000
- Other Capital Outlay - Police Protection: $2,086,000
Police Protection: $2,050,000
Sewerage: $1,455,000
Local Fire Protection: $1,270,000
Health - Other: $1,079,000
Health - Other: $898,000
Sewerage: $625,000
General Public Building: $447,000
Parks and Recreation: $432,000
Solid Waste Management: $327,000
Correctional Institutions: $310,000
Natural Resources - Other: $244,000
Financial Administration: $226,000
Judicial and Legal Services: $200,000
Libraries: $191,000
Protective Inspection and Regulation - Other: $154,000
Libraries: $150,000
Solid Waste Management: $148,000
Central Staff Services: $129,000
Protective Inspection and Regulation - Other: $94,000
Local Fire Protection: $94,000
Correctional Institutions: $87,000
General Public Building: $77,000
Financial Administration: $62,000
Natural Resources - Other: $42,000
Central Staff Services: $33,000
Judicial and Legal Services: $26,000
Housing and Community Development: $18,000
Parks and Recreation: $1,000
Housing and Community Development: $1,000
- Other Funds - Cash and Securities: $102,096,000
Cash and Securities: $73,601,000
- Revenue - Water Utilities: $1,736,000
Water Utilities: $1,584,000
- Sinking Funds - Cash and Securities: $9,715,000
Cash and Securities: $9,395,000
- State Intergovernmental - General Local Government Support: $7,776,000
General Local Government Support: $6,878,000
Highways: $5,384,000
Highways: $3,033,000
Other: $1,666,000
Other: $1,085,000
Health and Hospitals: $223,000
Health and Hospitals: $223,000
- Tax - Property: $75,024,000
Property: $54,409,000
General Sales and Gross Receipts: $11,016,000
General Sales and Gross Receipts: $9,640,000
Other Selective Sales: $7,739,000
Other Selective Sales: $5,538,000
Motor Fuels Sales: $3,597,000
Other License: $2,998,000
Motor Fuels Sales: $2,861,000
Other License: $2,402,000
Public Utilities Sales: $679,000
Public Utilities Sales: $638,000
Documentary and Stock Transfer: $535,000
Documentary and Stock Transfer: $491,000
- Water Utilities - Interest on Debt: $307,000
Interest on Debt: $266,000
Supplemental Security Income (SSI) in 2006:
- Total number of recipients: 941
- Number of aged recipients: 78
- Number of blind and disabled recipients: 863
- Number of recipients under 18: 157
- Number of recipients between 18 and 64: 613
- Number of recipients older than 64: 171
- Number of recipients also receiving OASDI: 326
- Amount of payments (thousands of dollars): 394
| Home Mortgage Disclosure Act Aggregated Statistics For Year 2009 (Based on 8 full tracts) | ||||||||||||||
| A) FHA, FSA/RHS & VA Home Purchase Loans | B) Conventional Home Purchase Loans | C) Refinancings | D) Home Improvement Loans | E) Loans on Dwellings For 5+ Families | F) Non-occupant Loans on < 5 Family Dwellings (A B C & D) | G) Loans On Manufactured Home Dwelling (A B C & D) | ||||||||
|---|---|---|---|---|---|---|---|---|---|---|---|---|---|---|
| Number | Average Value | Number | Average Value | Number | Average Value | Number | Average Value | Number | Average Value | Number | Average Value | Number | Average Value | |
| LOANS ORIGINATED | 379 | $175,860 | 361 | $229,579 | 1,392 | $213,210 | 63 | $69,825 | 0 | $0 | 318 | $252,145 | 150 | $89,193 |
| APPLICATIONS APPROVED, NOT ACCEPTED | 24 | $161,750 | 37 | $148,892 | 127 | $231,346 | 12 | $35,917 | 0 | $0 | 20 | $247,750 | 35 | $77,143 |
| APPLICATIONS DENIED | 80 | $170,038 | 112 | $184,152 | 658 | $222,310 | 63 | $73,762 | 1 | $1,600,000 | 122 | $329,902 | 147 | $89,435 |
| APPLICATIONS WITHDRAWN | 43 | $168,256 | 61 | $204,689 | 460 | $217,630 | 15 | $141,267 | 0 | $0 | 66 | $275,985 | 37 | $112,324 |
| FILES CLOSED FOR INCOMPLETENESS | 13 | $153,154 | 22 | $245,455 | 104 | $223,183 | 4 | $168,500 | 0 | $0 | 9 | $365,667 | 15 | $81,467 |
| Private Mortgage Insurance Companies Aggregated Statistics For Year 2009 (Based on 8 full tracts) | ||||||
| A) Conventional Home Purchase Loans | B) Refinancings | C) Non-occupant Loans on < 5 Family Dwellings (A & B) | ||||
|---|---|---|---|---|---|---|
| Number | Average Value | Number | Average Value | Number | Average Value | |
| LOANS ORIGINATED | 18 | $216,000 | 12 | $227,083 | 3 | $224,333 |
| APPLICATIONS APPROVED, NOT ACCEPTED | 6 | $286,500 | 12 | $193,083 | 1 | $173,000 |
| APPLICATIONS DENIED | 2 | $172,500 | 7 | $199,000 | 0 | $0 |
| APPLICATIONS WITHDRAWN | 0 | $0 | 1 | $171,000 | 0 | $0 |
| FILES CLOSED FOR INCOMPLETENESS | 4 | $165,000 | 1 | $255,000 | 1 | $184,000 |


| Most common first names in Nassau County, FL among deceased individuals | ||
| Name | Count | Lived (average) |
|---|---|---|
| James | 328 | 70.5 years |
| John | 295 | 72.6 years |
| Mary | 237 | 76.1 years |
| William | 230 | 72.2 years |
| Robert | 229 | 71.4 years |
| Charles | 141 | 69.6 years |
| George | 133 | 74.4 years |
| Joseph | 109 | 73.9 years |
| Thomas | 101 | 72.3 years |
| Dorothy | 92 | 76.3 years |
| Most common last names in Nassau County, FL among deceased individuals | ||
| Last name | Count | Lived (average) |
|---|---|---|
| Jones | 158 | 74.7 years |
| Johnson | 145 | 73.5 years |
| Smith | 141 | 72.7 years |
| Williams | 128 | 72.7 years |
| Davis | 100 | 72.3 years |
| Brown | 71 | 71.4 years |
| Harris | 54 | 72.9 years |
| Thompson | 54 | 70.4 years |
| Thomas | 51 | 72.1 years |
| Miller | 51 | 74.6 years |
| Businesses in Nassau County, FL | ||||
| Name | Count | Name | Count | |
|---|---|---|---|---|
| AT&T | 1 | La-Z-Boy | 1 | |
| Ace Hardware | 3 | Lane Furniture | 1 | |
| Advance Auto Parts | 3 | Little Caesars Pizza | 1 | |
| Applebee's | 1 | Lowe's | 1 | |
| Blockbuster | 2 | Marriott | 2 | |
| Burger King | 2 | Maurices | 1 | |
| CVS | 2 | McDonald's | 4 | |
| Chevrolet | 1 | New Balance | 1 | |
| Chick-Fil-A | 1 | Nike | 1 | |
| Chico's | 1 | Payless | 1 | |
| Cold Stone Creamery | 1 | Pizza Hut | 2 | |
| Coldwater Creek | 1 | Publix Super Markets | 1 | |
| Comfort Inn | 1 | RadioShack | 2 | |
| Comfort Suites | 1 | SONIC Drive-In | 1 | |
| Curves | 1 | Sears | 1 | |
| Dairy Queen | 2 | Sprint Nextel | 1 | |
| Days Inn | 2 | Staples | 1 | |
| Domino's Pizza | 2 | Starbucks | 3 | |
| Dunkin Donuts | 1 | T-Mobile | 3 | |
| FedEx | 8 | Taco Bell | 1 | |
| Ford | 1 | Talbots | 1 | |
| GameStop | 1 | Target | 1 | |
| H&R Block | 1 | Tire Kingdom | 2 | |
| Hilton | 2 | True Value | 1 | |
| Holiday Inn | 1 | U-Haul | 6 | |
| Home Depot | 1 | UPS | 7 | |
| Jimmy John's | 2 | Walgreens | 2 | |
| JoS. A. Bank | 1 | Walmart | 2 | |
| KFC | 2 | YMCA | 2 | |
| Kmart | 1 | |||
Nassau County on our top lists:
- #51 on the list of "Top 101 counties with highest percentage of residents voting for Romney (Republican) in the 2012 Presidential Election (pop. 50,000+)"
- #88 on the list of "Top 101 counties with the largest number of people moving in compared to moving out (pop. 50,000+)"