Fleming County, Kentucky (KY)
County owner-occupied free and clear houses and condos in 2010: 1,812
County owner-occupied houses and condos in 2000: 4,229
Renter-occupied apartments: 1,304 (it was 1,138 in 2000)
| % of renters here: | 21% |
| State: | 31% |
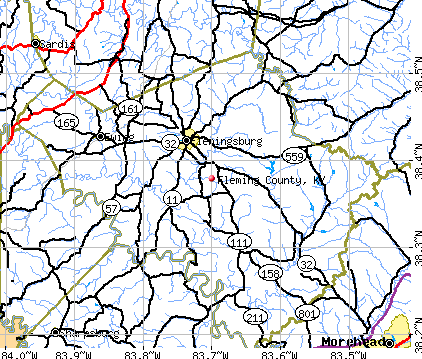
Land area: 351 sq. mi.
Water area: 0.6 sq. mi.
Population density: 43 people per square mile (average).
Industries providing employment: Educational, health and social services (24.4%), Manufacturing (19.3%), Retail trade (12.1%), Construction (11.3%).
Type of workers:
- Private wage or salary: 73%
- Government: 14%
- Self-employed, not incorporated: 12%
- Unpaid family work: 0%
- OSM Map
- General Map
- Google Map
- MSN Map

- 14,13793.6%White Non-Hispanic Alone
- 4563.0%Two or more races
- 2661.8%Hispanic or Latino
- 1270.8%Black Non-Hispanic Alone
- 710.5%Asian alone
- 250.2%American Indian and Alaska Native alone
- 210.1%Some other race alone

| Median resident age: | 41.1 years |
| Kentucky median age: | 39.4 years |
| Males: 7,572 | |
| Females: 7,570 |

 | I'm here in Eastern KY for 2 days- anywhere specific I should looknat houses? (25 replies) |
| Mountain Lions/ Cougars back in Kentucky! (116 replies) |
| Kentucky obesity problem. What can be done? (45 replies) |
| Any info. on northern KY??? (4 replies) |
| Vanceburg (5 replies) |
| Ky History Lesson (6 replies) |
| Fleming County: | 2.0 people |
| Kentucky: | 2 people |
Estimated median household income in 2022: $46,229 ($27,990 in 1999)
| This county: | $46,229 |
| Kentucky: | $59,341 |
Median contract rent in 2022 for apartments: $469 (lower quartile is $342, upper quartile is $564)
| This county: | $469 |
| State: | $702 |
Estimated median house or condo value in 2022: $121,218 (it was $58,400 in 2000)
| Fleming: | $121,218 |
| Kentucky: | $196,300 |
Mean price in 2022:
Median monthly housing costs for homes and condos with a mortgage: $962Detached houses: $208,905
Here: $208,905 State: $256,452 Townhouses or other attached units: $161,362
Here: $161,362 State: $264,090 Mobile homes: $110,768
Here: $110,768 State: $84,635
Median monthly housing costs for units without a mortgage: $348
Institutionalized population: 0
Crime in 2021 (reported by the sheriff's office or county police, not the county total):
- Murders: 0
- Rapes: 0
- Robberies: 0
- Assaults: 4
- Burglaries: 2
- Thefts: 6
- Auto thefts: 10
Crime in 2020 (reported by the sheriff's office or county police, not the county total):
- Murders: 0
- Rapes: 0
- Robberies: 0
- Assaults: 2
- Burglaries: 3
- Thefts: 2
- Auto thefts: 3
Single-family new house construction building permits:
- 2022: 0 buildings
- 2021: 0 buildings
- 2020: 0 buildings
- 2019: 0 buildings
- 2018: 0 buildings
- 2017: 0 buildings
- 2016: 0 buildings
- 2015: 1 building, cost: $160,000
- 2014: 1 building, cost: $100,000
- 2013: 0 buildings
- 2012: 0 buildings
- 2011: 1 building, cost: $80,000
- 2010: 2 buildings, average cost: $62,000
- 2009: 0 buildings
- 2008: 0 buildings
- 2007: 1 building, cost: $190,000
- 2006: 5 buildings, average cost: $150,000
- 2005: 3 buildings, average cost: $136,700
- 2004: 1 building, cost: $180,000
- 2003: 0 buildings
- 2002: 1 building, cost: $128,000
- 2001: 2 buildings, average cost: $80,000
- 2000: 2 buildings, average cost: $75,000
- 1999: 4 buildings, average cost: $105,000
- 1998: 1 building, cost: $120,000
- 1997: 7 buildings, average cost: $50,000


Median real estate property taxes paid for housing units with mortgages in 2022: $953 (0.7%)
Median real estate property taxes paid for housing units with no mortgage in 2022: $525 (0.5%)


| Fleming County: | 21.4% |
| Kentucky: | 16.5% |
Median age of residents in 2022: 41.1 years old
(Males: 40.2 years old, Females: 41.7 years old)
(Median age for: White residents: 41.5 years old, Black residents: 66.0 years old, Asian residents: 62.8 years old, Hispanic or Latino residents: 18.0 years old, Other race residents: 51.6 years old)
Fair market rent in 2006 for a 1-bedroom apartment in Fleming County is $365 a month.
Fair market rent for a 2-bedroom apartment is $450 a month.
Fair market rent for a 3-bedroom apartment is $562 a month.
Cities in this county include: Hillsboro, Flemingsburg, Ewing, Elizaville.
Notable locations in this county outside city limits:
Notable locations in Fleming County: Harmony Landing Country Club (A), La Grange Fire and Rescue Department Station 3 (B), North Oldham Fire Department Station 1 (C), North Oldham Fire Department Station 2 (D), South Oldham Fire Department (E), Ballardsville Fire Department (F). Display/hide their locations on the map
Churches in Fleming County include: Harrods Creek Baptist Church (A), Little Vine Church (B), Mount Tabor United Methodist Church (C), Sycamore Chapel Methodist Church (D), Rule Church (E), Brownsboro Church (F), Shiloh Methodist Church (G), Covington Church (H), Eighteenmile Church (I). Display/hide their locations on the map
Cemeteries: Kerlin Cemetery (1), Kelso Cemetery (2), Pleasant Hill Cemetery (3), Pewee Valley Cemetery (4), Harrods Creek Cemetery (5). Display/hide their locations on the map
Reservoirs: Sleepy Hollow Lake (A), Crystal Lake (B), Circle Dart Lake (C). Display/hide their locations on the map
Streams, rivers, and creeks: Ash Run (A), Ashers Run (B), Bells Branch (C), Berry Creek (D), Dog Branch (E), Brush Creek (F), Phillips Branch (G), Darby Fork (H), Darby Creek (I). Display/hide their locations on the map
Neighboring counties: Cabell County, West Virginia  , Bourbon County
  , Linn County, Kansas
  , Miami County, Kansas , Wayne County, Illinois .
| Here: | 4.6% |
| Kentucky: | 3.8% |


Current college students: 412
People 25 years of age or older with a high school degree or higher: 81.4%
People 25 years of age or older with a bachelor's degree or higher: 15.8%
Number of foreign born residents: 163 (64.6% naturalized citizens)
| Fleming County: | 1.1% |
| Whole state: | 4.0% |

- Year of entry for the foreign-born population
- 202010 or later
- 142000 to 2009
- 381990 to 1999
- 51980 to 1989
- 01970 to 1979
- 6Before 1970
Mean travel time to work (commute): ! minutes
Percentage of county residents living and working in this county: 97.8%
Housing units in structures:
- One, detached: 4,328
- One, attached: 18
- Two: 55
- 3 or 4: 73
- 5 to 9: 114
- 10 to 19: 33
- 20 or more: 7
- Mobile homes: 2,162
Housing units in Fleming County with a mortgage: 1,974 (153 second mortgage, 18 home equity loan, 105 both second mortgage and home equity loan)
Houses without a mortgage: 28
| Here: | 3.4% with mortgage |
| State: | 96.8% with mortgage |
Religion statistics for Fleming County
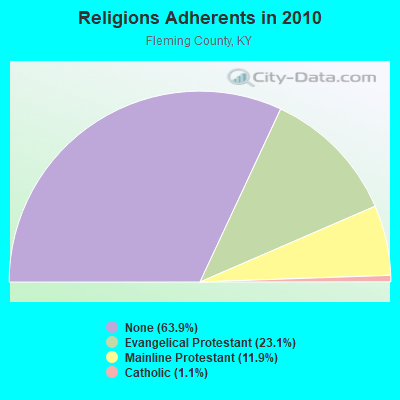
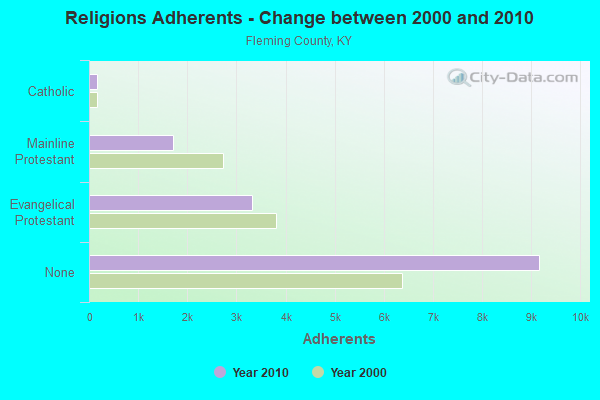
| Religion | Adherents | Congregations |
|---|---|---|
| Evangelical Protestant | 3,313 | 35 |
| Mainline Protestant | 1,708 | 16 |
| Catholic | 160 | 1 |
| None | 9,167 | - |
Source: Clifford Grammich, Kirk Hadaway, Richard Houseal, Dale E.Jones, Alexei Krindatch, Richie Stanley and Richard H.Taylor. 2012. 2010 U.S.Religion Census: Religious Congregations & Membership Study. Association of Statisticians of American Religious Bodies. Jones, Dale E., et al. 2002. Congregations and Membership in the United States 2000. Nashville, TN: Glenmary Research Center.
Food Environment Statistics:
| Fleming County: | 4.09 / 10,000 pop. |
| State: | 2.19 / 10,000 pop. |
| This county: | 0.68 / 10,000 pop. |
| Kentucky: | 0.74 / 10,000 pop. |
| Fleming County: | 5.46 / 10,000 pop. |
| Kentucky: | 4.36 / 10,000 pop. |
| This county: | 2.05 / 10,000 pop. |
| State: | 5.74 / 10,000 pop. |
| Fleming County: | 10.3% |
| Kentucky: | 11.0% |
| Fleming County: | 28.0% |
| State: | 30.0% |
| Here: | 16.1% |
| State: | 15.9% |
Agriculture in Fleming County:
Average size of farms: 171 acresAverage value of agricultural products sold per farm: $31,698
Average value of crops sold per acre for harvested cropland: $172.11
The value of nursery, greenhouse, floriculture, and sod as a percentage of the total market value of agricultural products sold: 2.45%
The value of livestock, poultry, and their products as a percentage of the total market value of agricultural products sold: 73.75%
Average total farm production expenses per farm: $25,376
Harvested cropland as a percentage of land in farms: 28.20%
Irrigated harvested cropland as a percentage of land in farms: 0.16%
Average market value of all machinery and equipment per farm: $46,176
The percentage of farms operated by a family or individual: 91.78%
Average age of principal farm operators: 54 years
Average number of cattle and calves per 100 acres of all land in farms: 26.40
Milk cows as a percentage of all cattle and calves: 11.37%
Corn for grain: 1777 harvested acres
All wheat for grain: 548 harvested acres
Soybeans for beans: 3442 harvested acres
Vegetables: 8 harvested acres
Land in orchards: 45 acres
Tornado activity:
Fleming County historical area-adjusted tornado activity is significantly below Kentucky state average. It is 2486311.7 times below overall U.S. average.Tornadoes in this county have caused 3 fatalities and 248 injuries recorded between 1950 and 2004.
On 4/3/1974, a category 4 (max. wind speeds 207-260 mph) tornado killed 3 people and injured 225 people
Earthquake activity:
Fleming County-area historical earthquake activity is significantly above Kentucky state average. It is 41% greater than the overall U.S. average.On 7/27/1980 at 18:52:21, a magnitude 5.2 (5.1 MB, 4.7 MS, 5.0 UK, 5.2 UK, Class: Moderate, Intensity: VI - VII) earthquake occurred 17.8 miles away from Fleming County center
On 9/7/1988 at 02:28:09, a magnitude 4.6 (4.5 MB, 4.6 LG, Class: Light, Intensity: IV - V) earthquake occurred 18.9 miles away from the county center
On 4/18/2008 at 09:36:59, a magnitude 5.4 (5.1 MB, 4.8 MS, 5.4 MW, 5.2 MW) earthquake occurred 226.8 miles away from the county center
On 8/23/2011 at 17:51:04, a magnitude 5.8 (5.8 MW, Depth: 3.7 mi) earthquake occurred 315.2 miles away from the county center
On 8/9/2020 at 12:07:37, a magnitude 5.1 (5.1 MW, Depth: 4.7 mi) earthquake occurred 194.5 miles away from Fleming County center
On 4/18/2008 at 09:36:59, a magnitude 5.2 (5.2 MW, Depth: 8.9 mi) earthquake occurred 226.8 miles away from the county center
Magnitude types: regional Lg-wave magnitude (LG), body-wave magnitude (MB), surface-wave magnitude (MS), moment magnitude (MW)
Most recent natural disasters:
- Kentucky Covid-19 Pandemic, Incident Period: January 20, 2020, FEMA Id: 4497, Natural disaster type: Other
- Kentucky Severe Storms, Tornadoes, Straight-line Winds, Flooding, Landslides, and Mudslides, Incident Period: July 11, 2015 to July 20, 2015, Major Disaster (Presidential) Declared DR-4239: August 12, 2015, FEMA Id: 4239, Natural disaster type: Storm, Tornado, Mudslide, Landslide, Flood, Wind
- Kentucky Severe Winter Storm, Snowstorm, Flooding, Landslides, and Mudslides, Incident Period: March 03, 2015 to March 09, 2015, Major Disaster (Presidential) Declared DR-4218: May 12, 2015, FEMA Id: 4218, Natural disaster type: Snowstorm, Winter Storm, Mudslide, Landslide, Flood
- Kentucky Severe Storms, Tornadoes, and Flooding, Incident Period: April 12, 2011 to May 20, 2011, Major Disaster (Presidential) Declared DR-1976: May 04, 2011, FEMA Id: 1976, Natural disaster type: Storm, Tornado, Flood
- Kentucky Severe Storms, Flooding, Mudslides, and Tornadoes, Incident Period: May 01, 2010 to June 01, 2010, Major Disaster (Presidential) Declared DR-1912: May 11, 2010, FEMA Id: 1912, Natural disaster type: Storm, Tornado, Mudslide, Flood
- Kentucky Severe Winter Storm, Incident Period: January 27, 2009 to February 05, 2009, Emergency Declared EM-3302: January 28, 2009, FEMA Id: 3302, Natural disaster type: Winter Storm
- Kentucky Severe Winter Storm and Flooding, Incident Period: January 26, 2009 to February 13, 2009, Major Disaster (Presidential) Declared DR-1818: February 05, 2009, FEMA Id: 1818, Natural disaster type: Winter Storm, Flood
- Kentucky Severe Storms, Tornadoes, Flooding, Mudslides, and Landslides, Incident Period: April 03, 2008 to April 04, 2008, Major Disaster (Presidential) Declared DR-1757: May 19, 2008, FEMA Id: 1757, Natural disaster type: Storm, Tornado, Mudslide, Landslide, Flood
- Kentucky Hurricane Katrina Evacuation, Incident Period: August 29, 2005 to October 01, 2005, Emergency Declared EM-3231: September 10, 2005, FEMA Id: 3231, Natural disaster type: Hurricane
- Kentucky Severe Storms, Tornadoes, Flooding, and Mudslides, Incident Period: May 26, 2004 to June 18, 2004, Major Disaster (Presidential) Declared DR-1523: June 10, 2004, FEMA Id: 1523, Natural disaster type: Storm, Tornado, Mudslide, Flood
- 10 other natural disasters have been reported since 1953.
The number of natural disasters in Fleming County (20) is greater than the US average (15).
Major Disasters (Presidential) Declared: 16
Emergencies Declared: 3
Causes of natural disasters: Floods: 13, Storms: 11, Tornadoes: 6, Winter Storms: 6, Mudslides: 5, Landslides: 3, Blizzard: 1, Hurricane: 1, Snowfall: 1, Snowstorm: 1, Wind: 1, Other: 1 (Note: some incidents may be assigned to more than one category).

Means of transportation to work:
- Drove a car alone: 2,836 (71.6%)
- Carpooled: 468 (11.8%)
- Bus: 3 (0.1%)
- Taxicab, motorcycle, or other means: 37 (0.9%)
- Bicycle: 6 (0.2%)
- Walked: 96 (2.4%)
- Worked at home: 567 (14.3%)


- Health care and social assistance (25%)
- Retail trade (13%)
- Educational services (12%)
- Manufacturing (10%)
- Other services, except public administration (6%)
- Accommodation and food services (4%)
- Finance and insurance (2%)

- Health care and social assistance (30%)
- Retail trade (16%)
- Educational services (14%)
- Manufacturing (12%)
- Other services, except public administration (8%)
- Accommodation and food services (5%)
- Finance and insurance (3%)

- Production occupations (22%)
- Management occupations (17%)
- Construction and extraction occupations (14%)
- Transportation occupations (7%)
- Sales and related occupations (7%)
- Office and administrative support occupations (6%)
- Installation, maintenance, and repair occupations (5%)

- Management occupations (14%)
- Office and administrative support occupations (13%)
- Production occupations (10%)
- Educational instruction, and library occupations (9%)
- Health diagnosing and treating practitioners and other technical occupations (8%)
- Health technologists and technicians (8%)
- Healthcare support occupations (7%)

- China, excluding Hong Kong and Taiwan (36%)
- Mexico (28%)
- Germany (8%)
- Japan (6%)
- Belgium (5%)
- Korea (4%)
- Canada (4%)

- American (46%)
- English (15%)
- German (7%)
- Irish (6%)
- Scotch-Irish (4%)
- Pennsylvania German (3%)
- Scottish (1%)


People in group quarters in Fleming County, Kentucky in 2000:
- 101 people in nursing homes
- 9 people in other nonhousehold living situations
- 8 people in homes for the mentally ill
- 3 people in other noninstitutional group quarters
6.66% of this county's 2021 resident taxpayers lived in other counties in 2020 ($38,246 average adjusted gross income)
| Here: | 6.66% |
| Kentucky average: | 7.04% |
10 or fewer of this county's residents moved from foreign countries.
5.14% relocated from other counties in Kentucky ($28,561 average AGI)
1.52% relocated from other states ($9,685 average AGI)
Fleming County: 1.52% Kentucky average: 2.87%

Top counties from which taxpayers relocated into this county between 2020 and 2021:
| from Rowan County, KY | |
| from Mason County, KY | |
| from Fayette County, KY | |
| from Lewis County, KY |
6.03% of this county's 2020 resident taxpayers moved to other counties in 2021 ($34,823 average adjusted gross income)
| Here: | 6.03% |
| Kentucky average: | 6.89% |
10 or fewer of this county's residents moved to foreign countries.
4.79% relocated to other counties in Kentucky ($28,431 average AGI)
1.24% relocated to other states ($6,392 average AGI)
Fleming County: 1.24% Kentucky average: 2.73%

Top counties to which taxpayers relocated from this county between 2020 and 2021:
| to Rowan County, KY | |
| to Mason County, KY | |
| to Lewis County, KY |
Births per 1000 population from 1990 to 1999: 12.7
Births per 1000 population from 2000 to 2006: 12.9

Deaths per 1000 population from 1990 to 1999: 11.2
Deaths per 1000 population from 2000 to 2009: 10.8
Deaths per 1000 population from 2010 to 2020: 12.3

Infant deaths per 1000 live births from 1990 to 1999: 4.9
Infant deaths per 1000 live births from 2000 to 2006: 3.1

Persons under 19 years old without health insurance coverage in 2018: 5.5%


Persons enrolled in hospital insurance and/or supplemental medical insurance (Medicare) in July 1, 2007: 2,687 (2,033 aged, 654 disabled)
Children under 18 without health insurance coverage in 2007: 405 (11%)


Most common underlying causes of death in Fleming County, Kentucky in 1999 - 2019:
- Acute myocardial infarction, unspecified (349)
- Bronchus or lung, unspecified - Malignant neoplasms (178)
- Chronic obstructive pulmonary disease, unspecified (149)
- Atherosclerotic heart disease (96)
- Congestive heart failure (11)
- Alzheimer disease, unspecified (10)
- Other ill-defined heart diseases (10)
- Stroke, not specified as haemorrhage or infarction (10)
Population without health insurance coverage in 2000: 16%
Children under 18 without health insurance coverage in 2000: 11%
Short term general hospital admissions per 100,000 population in 2004: 11,547
Short term general hospital beds per 100,000 population in 2004: 221
Emergency room visits per 100,000 population in 2004: 47,597
General practice office based MDs per 100,000 population in 2005: 1,225
Medical specialist MDs per 100,000 population in 2005: 1,034
Total births per 100,000 population, July 2005 - July 2006 : 22
Total deaths per 100,000 population, July 2005 - July 2006: 27
Limited-service eating places per 100,000 population in 2005 : 14
Crimes per 100,000 population in 1996: 1
Household type by relationship:
Households: 15,142- Male householders: 2,739 (655 living alone), Female householders: 3,205 (834 living alone)
3,099 spouses (3,074 opposite-sex spouses), 591 unmarried partners, (591 opposite-sex unmarried partners), 4,233 children (3,689 natural, 94 adopted, 444 stepchildren), 371 grandchildren, 176 brothers or sisters, 90 parents, 0 foster children, 231 other relatives, 363 non-relatives
- In group quarters: 56
Size of family households: 2,086 2-persons, 842 3-persons, 575 4-persons, 429 5-persons, 83 6-persons, 81 7-or-more-persons.
Size of nonfamily households: 1,490 1-person, 320 2-persons, 24 3-persons.
2,036 married couples with children.
1,214 single-parent households (559 men, 655 women).
95.7% of residents of Fleming speak English at home.
1.8% of residents speak Spanish at home (88% speak English very well, 12% speak English well).
2.0% of residents speak other Indo-European language at home (75% speak English very well, 16% speak English well, 8% speak English not well, 1% don't speak English at all).
0.5% of residents speak Asian or Pacific Island language at home (88% speak English very well, 12% speak English well).
0.1% of residents speak other language at home (100% speak English very well).
In fiscal year 2004:
Federal Government expenditure: $93,360,000 ($6,448 per capita)
Department of Defense expenditure: $775,000
Federal direct payments to individuals for retirement and disability: $36,328,000
Federal other direct payments to individuals: $14,893,000
Federal direct payments not to individuals: $1,871,000
Federal grants: $36,750,000
Federal procurement contracts: $718,000 ($105,000 Department of Defense)
Federal salaries and wages: $2,800,000 ($0,000 Department of Defense)
Federal Government direct loans: $562,000
Federal guaranteed/insured loans: $18,224,000
Federal Government insurance: $4,718,000
Population change from April 1, 2000 to July 1, 2005:
Births: 946| Here: | 65 per 1000 residents |
| State: | 69 per 1000 residents |
Deaths: 798
| Here: | 55 per 1000 residents |
| State: | 50 per 1000 residents |
Net international migration: 0
| Here: | 0 per 1000 residents |
| State: | +7 per 1000 residents |
Net internal migration: +687
| Here: | +47 per 1000 residents |
| State: | +8 per 1000 residents |

Total withdrawal of fresh water for public supply: 0.30 millions of gallons per day (all from surface)
| Here: | 6.3 |
| State: | 6.4 |
| Here: | 5.3 |
| State: | 4.4 |

- Year house built in Fleming County, Kentucky
- 582020 or later
- 8062010 to 2019
- 1,1652000 to 2009
- 1,2231990 to 1999
- 6701980 to 1989
- 8221970 to 1979
- 5131960 to 1969
- 4481950 to 1959
- 2101940 to 1949
- 8781939 or earlier

- Rooms in owner-occupied houses in Fleming County, Kentucky
- 731 room
- 1132 rooms
- 373 rooms
- 5334 rooms
- 8485 rooms
- 8466 rooms
- 7637 rooms
- 5308 rooms
- 7549+ rooms

- Rooms in renter-occupied apartments in Fleming County, Kentucky
- 201 room
- 02 rooms
- 303 rooms
- 3834 rooms
- 3815 rooms
- 3426 rooms
- 1557 rooms
- 878 rooms
- 639+ rooms

- Bedrooms in owner-occupied houses in Fleming County, Kentucky
- 73no bedroom
- 1781 bedroom
- 8552 bedrooms
- 2,5183 bedrooms
- 7444 bedrooms
- 1165+ bedrooms

- Bedrooms in renter-occupied apartments in Fleming County, Kentucky
- 27no bedroom
- 891 bedroom
- 5432 bedrooms
- 6383 bedrooms
- 994 bedrooms
- 445+ bedrooms

- Cars and other vehicles available in Fleming County in owner-occupied houses/condos
- 240no vehicle
- 8561 vehicle
- 2,0132 vehicles
- 1,0503 vehicles
- 2124 vehicles
- 855+ vehicles

- Cars and other vehicles available in Fleming County in renter-occupied apartments
- 260no vehicle
- 6831 vehicle
- 3252 vehicles
- 1263 vehicles
- 774 vehicles
- 95+ vehicles
89.0% of Fleming County residents lived in the same house 1 years ago.
Out of people who lived in different houses, 38% lived in this county.
Out of people who lived in different counties, 68% lived in Kentucky.
| Fleming County: | 89.0% |
| State average: | 87.2% |
Place of birth for U.S.-born residents:
- This state: 12,080
- Other state: 2,789
- Northeast: 134
- Midwest: 1,816
- South: 717
- West: 94


- 64.8%Electricity
- 13.3%Bottled, tank, or LP gas
- 12.4%Wood
- 8.4%Utility gas
- 0.8%Other fuel
- 0.3%Coal or coke

- 60.8%Electricity
- 15.9%Utility gas
- 13.6%Wood
- 9.7%Bottled, tank, or LP gas
Private vs. public school enrollment:
| Here: | 6.4% |
| Kentucky: | 17.2% |
| Here: | 3.3% |
| Kentucky: | 15.2% |
| Here: | 13.8% |
| Kentucky: | 19.6% |


Fleming County government finances - Expenditure in 2017:
- Bond Funds - Cash and Securities: $6,520,000
- Charges - Hospital Public: $376,000
Other: $138,000
Regular Highways: $8,000
- Construction - Regular Highways: $125,000
- Current Operations - General - Other: $1,575,000
Regular Highways: $1,540,000
Health - Other: $1,072,000
Judicial and Legal Services: $279,000
Central Staff Services: $254,000
Police Protection: $189,000
Correctional Institutions: $122,000
Local Fire Protection: $85,000
Financial Administration: $84,000
General Public Buildings: $67,000
Parks and Recreation: $41,000
Air Transportation: $8,000
Public Welfare - Other: $5,000
Miscellaneous Commercial Activities - Other: $2,000
Natural Resources - Other: $1,000
- Federal Intergovernmental - Health and Hospitals: $178,000
Other: $58,000
- Intergovernmental to Local - Other - Correctional Institutions: $277,000
- Local Intergovernmental - Health and Hospitals: $340,000
Highways: $19,000
Other: $4,000
- Long Term Debt - Outstanding Unspecified Public Purpose: $18,724,000
Beginning Outstanding - Unspecified Public Purpose: $12,034,000
Issue, Unspecified Public Purpose: $6,980,000
Outstanding Nonguaranteed - Industrial Revenue: $5,846,000
Beginning Outstanding - Public Debt for Private Purpose: $5,846,000
Retired Unspecified Public Purpose: $290,000
- Miscellaneous - General Revenue - Other: $388,000
Sale of Property: $26,000
Interest Earnings: $3,000
Rents: $2,000
- Other Capital Outlay - General - Other: $46,000
- Other Funds - Cash and Securities: $1,016,000
- Sinking Funds - Cash and Securities: $5,846,000
- State Intergovernmental - Highways: $1,299,000
Other: $1,050,000
Health and Hospitals: $191,000
- Tax - Property: $1,007,000
Insurance Premiums Sales: $706,000
Public Utilities Sales: $299,000
Corporation License: $60,000
Documentary and Stock Transfer: $41,000
- Total Salaries and Wages: $1,016,000
Fleming County government finances - Revenue in 2017:
- Bond Funds - Cash and Securities: $6,520,000
- Charges - Hospital Public: $376,000
Other: $138,000
Regular Highways: $8,000
- Construction - Regular Highways: $125,000
- Current Operations - General - Other: $1,575,000
Regular Highways: $1,540,000
Health - Other: $1,072,000
Judicial and Legal Services: $279,000
Central Staff Services: $254,000
Police Protection: $189,000
Correctional Institutions: $122,000
Local Fire Protection: $85,000
Financial Administration: $84,000
General Public Buildings: $67,000
Parks and Recreation: $41,000
Air Transportation: $8,000
Public Welfare - Other: $5,000
Miscellaneous Commercial Activities - Other: $2,000
Natural Resources - Other: $1,000
- Federal Intergovernmental - Health and Hospitals: $178,000
Other: $58,000
- Intergovernmental to Local - Other - Correctional Institutions: $277,000
- Local Intergovernmental - Health and Hospitals: $340,000
Highways: $19,000
Other: $4,000
- Long Term Debt - Outstanding Unspecified Public Purpose: $18,724,000
Beginning Outstanding - Unspecified Public Purpose: $12,034,000
Issue, Unspecified Public Purpose: $6,980,000
Outstanding Nonguaranteed - Industrial Revenue: $5,846,000
Beginning Outstanding - Public Debt for Private Purpose: $5,846,000
Retired Unspecified Public Purpose: $290,000
- Miscellaneous - General Revenue - Other: $388,000
Sale of Property: $26,000
Interest Earnings: $3,000
Rents: $2,000
- Other Capital Outlay - General - Other: $46,000
- Other Funds - Cash and Securities: $1,016,000
- Sinking Funds - Cash and Securities: $5,846,000
- State Intergovernmental - Highways: $1,299,000
Other: $1,050,000
Health and Hospitals: $191,000
- Tax - Property: $1,007,000
Insurance Premiums Sales: $706,000
Public Utilities Sales: $299,000
Corporation License: $60,000
Documentary and Stock Transfer: $41,000
- Total Salaries and Wages: $1,016,000
Fleming County government finances - Debt in 2017:
- Bond Funds - Cash and Securities: $6,520,000
- Charges - Hospital Public: $376,000
Other: $138,000
Regular Highways: $8,000
- Construction - Regular Highways: $125,000
- Current Operations - General - Other: $1,575,000
Regular Highways: $1,540,000
Health - Other: $1,072,000
Judicial and Legal Services: $279,000
Central Staff Services: $254,000
Police Protection: $189,000
Correctional Institutions: $122,000
Local Fire Protection: $85,000
Financial Administration: $84,000
General Public Buildings: $67,000
Parks and Recreation: $41,000
Air Transportation: $8,000
Public Welfare - Other: $5,000
Miscellaneous Commercial Activities - Other: $2,000
Natural Resources - Other: $1,000
- Federal Intergovernmental - Health and Hospitals: $178,000
Other: $58,000
- Intergovernmental to Local - Other - Correctional Institutions: $277,000
- Local Intergovernmental - Health and Hospitals: $340,000
Highways: $19,000
Other: $4,000
- Long Term Debt - Outstanding Unspecified Public Purpose: $18,724,000
Beginning Outstanding - Unspecified Public Purpose: $12,034,000
Issue, Unspecified Public Purpose: $6,980,000
Outstanding Nonguaranteed - Industrial Revenue: $5,846,000
Beginning Outstanding - Public Debt for Private Purpose: $5,846,000
Retired Unspecified Public Purpose: $290,000
- Miscellaneous - General Revenue - Other: $388,000
Sale of Property: $26,000
Interest Earnings: $3,000
Rents: $2,000
- Other Capital Outlay - General - Other: $46,000
- Other Funds - Cash and Securities: $1,016,000
- Sinking Funds - Cash and Securities: $5,846,000
- State Intergovernmental - Highways: $1,299,000
Other: $1,050,000
Health and Hospitals: $191,000
- Tax - Property: $1,007,000
Insurance Premiums Sales: $706,000
Public Utilities Sales: $299,000
Corporation License: $60,000
Documentary and Stock Transfer: $41,000
- Total Salaries and Wages: $1,016,000
Fleming County government finances - Cash and Securities in 2017:
- Bond Funds - Cash and Securities: $6,520,000
- Charges - Hospital Public: $376,000
Other: $138,000
Regular Highways: $8,000
- Construction - Regular Highways: $125,000
- Current Operations - General - Other: $1,575,000
Regular Highways: $1,540,000
Health - Other: $1,072,000
Judicial and Legal Services: $279,000
Central Staff Services: $254,000
Police Protection: $189,000
Correctional Institutions: $122,000
Local Fire Protection: $85,000
Financial Administration: $84,000
General Public Buildings: $67,000
Parks and Recreation: $41,000
Air Transportation: $8,000
Public Welfare - Other: $5,000
Miscellaneous Commercial Activities - Other: $2,000
Natural Resources - Other: $1,000
- Federal Intergovernmental - Health and Hospitals: $178,000
Other: $58,000
- Intergovernmental to Local - Other - Correctional Institutions: $277,000
- Local Intergovernmental - Health and Hospitals: $340,000
Highways: $19,000
Other: $4,000
- Long Term Debt - Outstanding Unspecified Public Purpose: $18,724,000
Beginning Outstanding - Unspecified Public Purpose: $12,034,000
Issue, Unspecified Public Purpose: $6,980,000
Outstanding Nonguaranteed - Industrial Revenue: $5,846,000
Beginning Outstanding - Public Debt for Private Purpose: $5,846,000
Retired Unspecified Public Purpose: $290,000
- Miscellaneous - General Revenue - Other: $388,000
Sale of Property: $26,000
Interest Earnings: $3,000
Rents: $2,000
- Other Capital Outlay - General - Other: $46,000
- Other Funds - Cash and Securities: $1,016,000
- Sinking Funds - Cash and Securities: $5,846,000
- State Intergovernmental - Highways: $1,299,000
Other: $1,050,000
Health and Hospitals: $191,000
- Tax - Property: $1,007,000
Insurance Premiums Sales: $706,000
Public Utilities Sales: $299,000
Corporation License: $60,000
Documentary and Stock Transfer: $41,000
- Total Salaries and Wages: $1,016,000
Supplemental Security Income (SSI) in 2006:
- Total number of recipients: 741
- Number of aged recipients: 97
- Number of blind and disabled recipients: 644
- Number of recipients under 18: 72
- Number of recipients between 18 and 64: 449
- Number of recipients older than 64: 220
- Number of recipients also receiving OASDI: 317
- Amount of payments (thousands of dollars): 319
| Most common first names in Fleming County, KY among deceased individuals | ||
| Name | Count | Lived (average) |
|---|---|---|
| James | 99 | 73.8 years |
| Mary | 95 | 80.8 years |
| William | 92 | 74.4 years |
| John | 75 | 77.7 years |
| Charles | 62 | 75.6 years |
| Robert | 50 | 69.7 years |
| Anna | 36 | 79.4 years |
| George | 36 | 76.0 years |
| Thomas | 34 | 76.5 years |
| Elizabeth | 34 | 80.9 years |
| Most common last names in Fleming County, KY among deceased individuals | ||
| Last name | Count | Lived (average) |
|---|---|---|
| Mitchell | 42 | 71.3 years |
| Hunt | 40 | 74.8 years |
| Vice | 37 | 75.4 years |
| Jones | 37 | 75.4 years |
| Gray | 35 | 71.6 years |
| Mckee | 35 | 79.0 years |
| Emmons | 32 | 76.7 years |
| Smith | 31 | 81.7 years |
| Helphenstine | 30 | 74.7 years |
| Williams | 29 | 78.7 years |
| Businesses in Fleming County, KY | ||||
| Name | Count | Name | Count | |
|---|---|---|---|---|
| AT&T | 1 | H&R Block | 1 | |
| Ace Hardware | 1 | Lane Furniture | 1 | |
| Arby's | 1 | McDonald's | 1 | |
| Chevrolet | 1 | Pizza Hut | 1 | |
| Curves | 1 | RadioShack | 1 | |
| Dairy Queen | 1 | Subway | 1 | |
| Ford | 1 | U-Haul | 1 | |