Butler County, Kentucky (KY)
County owner-occupied free and clear houses and condos in 2010: 1,783
County owner-occupied houses and condos in 2000: 4,021
Renter-occupied apartments: 1,261 (it was 1,038 in 2000)
| % of renters here: | 21% |
| State: | 31% |
Land area: 428 sq. mi.
Water area: 3.4 sq. mi.
Population density: 29 people per square mile (low).
Industries providing employment: Educational, health and social services (24.5%), Manufacturing (21.9%), Construction (13.1%).
Type of workers:
- Private wage or salary: 71%
- Government: 17%
- Self-employed, not incorporated: 12%
- Unpaid family work: 0%
- OSM Map
- General Map
- Google Map
- MSN Map

- 11,47293.1%White Non-Hispanic Alone
- 4853.9%Hispanic or Latino
- 2361.9%Two or more races
- 750.6%Asian alone
- 480.4%Black Non-Hispanic Alone
- 90.07%American Indian and Alaska Native alone

| Median resident age: | 41.7 years |
| Kentucky median age: | 39.4 years |
| Males: 6,312 | |
| Females: 6,078 |

 | Driving through Kentucky via 231 (15 replies) |
| Northerner moving down south to Louisville (10 replies) |
| Info search WWII soldier (2 replies) |
| Headin' to Butler County! (17 replies) |
| Considering relocating to KY---Religion an issue? (127 replies) |
| Planning to move to Beaver Dam (6 replies) |
| Butler County: | 2.0 people |
| Kentucky: | 2 people |
Estimated median household income in 2022: $46,923 ($29,405 in 1999)
| This county: | $46,923 |
| Kentucky: | $59,341 |
Median contract rent in 2022 for apartments: $444 (lower quartile is $256, upper quartile is $577)
| This county: | $444 |
| State: | $702 |
Estimated median house or condo value in 2022: $113,344 (it was $54,400 in 2000)
| Butler: | $113,344 |
| Kentucky: | $196,300 |
Median monthly housing costs for homes and condos with a mortgage: $1,049
Median monthly housing costs for units without a mortgage: $333
Institutionalized population: 203
Crime in 2021 (reported by the sheriff's office or county police, not the county total):
- Murders: 0
- Rapes: 1
- Robberies: 1
- Assaults: 5
- Burglaries: 11
- Thefts: 14
- Auto thefts: 7
Crime in 2020 (reported by the sheriff's office or county police, not the county total):
- Murders: 0
- Rapes: 0
- Robberies: 1
- Assaults: 1
- Burglaries: 5
- Thefts: 13
- Auto thefts: 12
Single-family new house construction building permits:
- 2022: 0 buildings
- 2021: 0 buildings
- 2020: 0 buildings
- 2019: 1 building, cost: $237,500
- 2018: 0 buildings
- 2017: 0 buildings
- 2016: 0 buildings
- 2015: 0 buildings
- 2014: 0 buildings
- 2013: 0 buildings
- 2012: 1 building, cost: $181,600
- 2011: 0 buildings
- 2010: 0 buildings
- 2009: 0 buildings
- 2008: 1 building, cost: $177,500
- 2007: 0 buildings
- 2006: 24 buildings, average cost: $159,000
- 2005: 0 buildings
- 2004: 0 buildings
- 2003: 0 buildings
- 2002: 0 buildings
- 2001: 3 buildings, average cost: $33,300
- 2000: 1 building, cost: $75,000
- 1999: 1 building, cost: $60,000
- 1998: 4 buildings, average cost: $45,000
- 1997: 2 buildings, average cost: $100,000


Median real estate property taxes paid for housing units with mortgages in 2022: $782 (0.6%)
Median real estate property taxes paid for housing units with no mortgage in 2022: $512 (0.6%)


| Butler County: | 20.2% |
| Kentucky: | 16.5% |
Median age of residents in 2022: 41.7 years old
(Males: 41.2 years old, Females: 43.1 years old)
(Median age for: White residents: 43.4 years old, Black residents: 17.1 years old, American Indian residents: 13.5 years old, Asian residents: 35.2 years old, Hispanic or Latino residents: 18.8 years old, Other race residents: 33.2 years old)
Fair market rent in 2006 for a 1-bedroom apartment in Butler County is $457 a month.
Fair market rent for a 2-bedroom apartment is $556 a month.
Fair market rent for a 3-bedroom apartment is $731 a month.
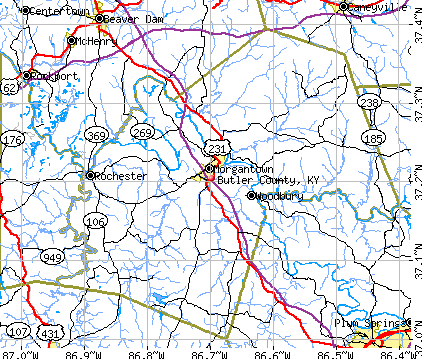
Cities in this county include: Welchs Creek, Morgantown, Sugar Grove, Jetson, Rochester, Woodbury.
Neighboring counties: Alfalfa County, Oklahoma  , Harper County, Oklahoma , Iron County, Missouri , Morton County, Kansas , Webster County
  .
.
| Here: | 4.4% |
| Kentucky: | 3.8% |


Current college students: 324
People 25 years of age or older with a high school degree or higher: 80.7%
People 25 years of age or older with a bachelor's degree or higher: 11.3%
Number of foreign born residents: 328 (10.1% naturalized citizens)
| Butler County: | 2.6% |
| Whole state: | 4.0% |

- Year of entry for the foreign-born population
- 1632010 or later
- 1222000 to 2009
- 201990 to 1999
- 71980 to 1989
- 91970 to 1979
- 36Before 1970
Mean travel time to work (commute): minutes
Percentage of county residents living and working in this county: 96.9%
Housing units in structures:
- One, detached: 3,621
- One, attached: 19
- Two: 111
- 3 or 4: 48
- 5 to 9: 129
- 10 to 19: 129
- 20 to 49: 1
- 50 or more: 9
- Mobile homes: 1,423
- Boats, RVs, vans, etc.: 10
Housing units in Butler County with a mortgage: 1,491 (205 second mortgage, 23 home equity loan, 165 both second mortgage and home equity loan)
Houses without a mortgage: 3
| Here: | 25.0% with mortgage |
| State: | 96.8% with mortgage |
Religion statistics for Butler County
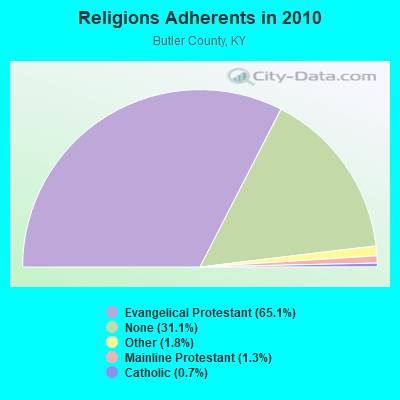
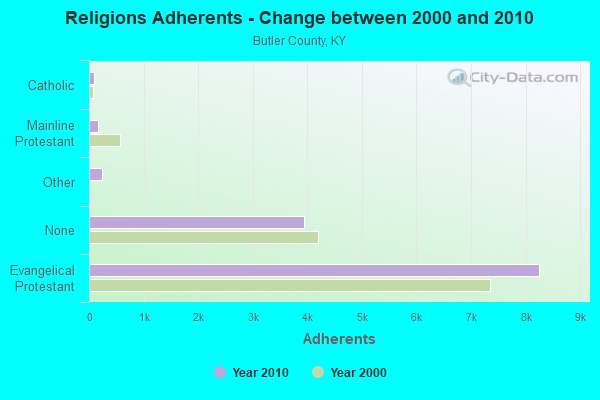
| Religion | Adherents | Congregations |
|---|---|---|
| Evangelical Protestant | 8,255 | 46 |
| Other | 230 | 1 |
| Mainline Protestant | 169 | 3 |
| Catholic | 95 | 1 |
| None | 3,941 | - |
Source: Clifford Grammich, Kirk Hadaway, Richard Houseal, Dale E.Jones, Alexei Krindatch, Richie Stanley and Richard H.Taylor. 2012. 2010 U.S.Religion Census: Religious Congregations & Membership Study. Association of Statisticians of American Religious Bodies. Jones, Dale E., et al. 2002. Congregations and Membership in the United States 2000. Nashville, TN: Glenmary Research Center.
Food Environment Statistics:
| Butler County: | 5.30 / 10,000 pop. |
| State: | 2.19 / 10,000 pop. |
| This county: | 0.76 / 10,000 pop. |
| Kentucky: | 0.74 / 10,000 pop. |
| Butler County: | 4.54 / 10,000 pop. |
| Kentucky: | 4.36 / 10,000 pop. |
| This county: | 5.30 / 10,000 pop. |
| State: | 5.74 / 10,000 pop. |
| Butler County: | 10.6% |
| Kentucky: | 11.0% |
| Butler County: | 31.3% |
| State: | 30.0% |
| Here: | 22.0% |
| State: | 15.9% |
Agriculture in Butler County:
Average size of farms: 222 acresAverage value of agricultural products sold per farm: $26,197
Average value of crops sold per acre for harvested cropland: $152.09
The value of nursery, greenhouse, floriculture, and sod as a percentage of the total market value of agricultural products sold: 0.09%
The value of livestock, poultry, and their products as a percentage of the total market value of agricultural products sold: 62.96%
Average total farm production expenses per farm: $22,168
Harvested cropland as a percentage of land in farms: 28.76%
Irrigated harvested cropland as a percentage of land in farms: 0.04%
Average market value of all machinery and equipment per farm: $37,124
The percentage of farms operated by a family or individual: 93.69%
Average age of principal farm operators: 54 years
Average number of cattle and calves per 100 acres of all land in farms: 12.06
Milk cows as a percentage of all cattle and calves: 1.16%
Corn for grain: 12654 harvested acres
All wheat for grain: 730 harvested acres
Soybeans for beans: 14524 harvested acres
Vegetables: 5 harvested acres
Land in orchards: 53 acres
Earthquake activity:
Butler County-area historical earthquake activity is significantly above Kentucky state average. It is 182% greater than the overall U.S. average.On 4/18/2008 at 09:36:59, a magnitude 5.4 (5.1 MB, 4.8 MS, 5.4 MW, 5.2 MW, Class: Moderate, Intensity: VI - VII) earthquake occurred 108.0 miles away from Butler County center
On 4/18/2008 at 09:36:59, a magnitude 5.2 (5.2 MW, Depth: 8.9 mi) earthquake occurred 108.0 miles away from the county center
On 6/18/2002 at 17:37:15, a magnitude 5.0 (4.3 MB, 4.6 MW, 5.0 LG) earthquake occurred 80.3 miles away from the county center
On 6/10/1987 at 23:48:54, a magnitude 5.1 (4.9 MB, 4.4 MS, 4.6 MS, 5.1 LG) earthquake occurred 129.2 miles away from the county center
On 7/27/1980 at 18:52:21, a magnitude 5.2 (5.1 MB, 4.7 MS, 5.0 UK, 5.2 UK) earthquake occurred 166.0 miles away from Butler County center
On 4/18/2008 at 15:14:16, a magnitude 4.8 (4.5 MB, 4.8 MW, 4.6 MW, Class: Light, Intensity: IV - V) earthquake occurred 108.1 miles away from the county center
Magnitude types: regional Lg-wave magnitude (LG), body-wave magnitude (MB), surface-wave magnitude (MS), moment magnitude (MW)
Most recent natural disasters:
- Kentucky Severe Storms, Flooding, Landslides, And Mudslides, Incident Period: February 3, 2020 - February 29, 2020, Major Disaster (Presidential) Declared DR-4540-KY: April 24, 2020, FEMA Id: 4540, Natural disaster type: Storm, Mudslide, Landslide, Flood
- Kentucky Covid-19 Pandemic, Incident Period: January 20, 2020, FEMA Id: 4497, Natural disaster type: Other
- Kentucky Severe Storms, Straight-line Winds, Flooding, Landslides, And Mudslides, Incident Period: February 6, 2019 - March 10, 2019, FEMA Id: 4428, Natural disaster type: Storm, Mudslide, Landslide, Flood, Wind
- Kentucky Severe Storms, Tornadoes, Flooding, Landslides, And Mudslides, Incident Period: February 21, 2018 - March 21, 2018, FEMA Id: 4361, Natural disaster type: Storm, Tornado, Mudslide, Landslide, Flood
- Kentucky Severe Winter Storm, Snowstorm, Flooding, Landslides, and Mudslides, Incident Period: March 03, 2015 to March 09, 2015, Major Disaster (Presidential) Declared DR-4218: May 12, 2015, FEMA Id: 4218, Natural disaster type: Snowstorm, Winter Storm, Mudslide, Landslide, Flood
- Kentucky Severe Winter Storms, Snowstorms, Flooding, Landslides, and Mudslides, Incident Period: February 15, 2015 to February 23, 2015, Major Disaster (Presidential) Declared DR-4216: April 30, 2015, FEMA Id: 4216, Natural disaster type: Snowstorm, Winter Storm, Mudslide, Landslide, Flood
- Kentucky Severe Storms, Tornadoes, and Flooding, Incident Period: April 12, 2011 to May 20, 2011, Major Disaster (Presidential) Declared DR-1976: May 04, 2011, FEMA Id: 1976, Natural disaster type: Storm, Tornado, Flood
- Kentucky Severe Storms, Flooding, Mudslides, and Tornadoes, Incident Period: May 01, 2010 to June 01, 2010, Major Disaster (Presidential) Declared DR-1912: May 11, 2010, FEMA Id: 1912, Natural disaster type: Storm, Tornado, Mudslide, Flood
- Kentucky Severe Winter Storm, Incident Period: January 27, 2009 to February 05, 2009, Emergency Declared EM-3302: January 28, 2009, FEMA Id: 3302, Natural disaster type: Winter Storm
- Kentucky Severe Winter Storm and Flooding, Incident Period: January 26, 2009 to February 13, 2009, Major Disaster (Presidential) Declared DR-1818: February 05, 2009, FEMA Id: 1818, Natural disaster type: Winter Storm, Flood
- 9 other natural disasters have been reported since 1953.
The number of natural disasters in Butler County (19) is greater than the US average (15).
Major Disasters (Presidential) Declared: 14
Emergencies Declared: 2
Causes of natural disasters: Floods: 13, Storms: 11, Mudslides: 7, Landslides: 5, Tornadoes: 5, Winter Storms: 4, Snowstorms: 2, Blizzard: 1, Freeze: 1, Hurricane: 1, Snow: 1, Wind: 1, Other: 1 (Note: some incidents may be assigned to more than one category).

Means of transportation to work:
- Drove a car alone: 2,170 (74.4%)
- Carpooled: 563 (19.3%)
- Taxicab, motorcycle, or other means: 2 (0.1%)
- Walked: 55 (1.9%)
- Worked at home: 100 (3.4%)


- Health care and social assistance (22%)
- Manufacturing (13%)
- Educational services (13%)
- Transportation and warehousing (7%)
- Accommodation and food services (4%)
- Retail trade (4%)
- Information (2%)

- Health care and social assistance (30%)
- Manufacturing (18%)
- Educational services (17%)
- Transportation and warehousing (9%)
- Accommodation and food services (6%)
- Retail trade (5%)
- Information (3%)

- Construction and extraction occupations (18%)
- Production occupations (18%)
- Management occupations (13%)
- Sales and related occupations (9%)
- Installation, maintenance, and repair occupations (8%)
- Office and administrative support occupations (7%)
- Transportation occupations (6%)

- Office and administrative support occupations (22%)
- Educational instruction, and library occupations (14%)
- Healthcare support occupations (11%)
- Production occupations (11%)
- Management occupations (9%)
- Health diagnosing and treating practitioners and other technical occupations (6%)
- Health technologists and technicians (5%)

- Guatemala (78%)
- Malaysia (8%)
- Canada (5%)
- Mexico (5%)
- India (4%)
- China, excluding Hong Kong and Taiwan (2%)
- Italy (2%)

- American (32%)
- English (19%)
- Irish (7%)
- German (3%)
- Pennsylvania German (3%)
- European (2%)
- Italian (2%)


People in group quarters in Butler County, Kentucky in 2010:
- 114 people in nursing facilities/skilled-nursing facilities
- 54 people in local jails and other municipal confinement facilities
- 35 people in correctional facilities intended for juveniles
People in group quarters in Butler County, Kentucky in 2000:
- 161 people in nursing homes
- 44 people in local jails and other confinement facilities (including police lockups)
- 33 people in training schools for juvenile delinquents
5.20% of this county's 2021 resident taxpayers lived in other counties in 2020 ($36,353 average adjusted gross income)
| Here: | 5.20% |
| Kentucky average: | 7.04% |
10 or fewer of this county's residents moved from foreign countries.
4.42% relocated from other counties in Kentucky ($28,578 average AGI)
0.79% relocated from other states ($7,775 average AGI)
Butler County: 0.79% Kentucky average: 2.87%

Top counties from which taxpayers relocated into this county between 2020 and 2021:
| from Warren County, KY |
5.83% of this county's 2020 resident taxpayers moved to other counties in 2021 ($35,207 average adjusted gross income)
| Here: | 5.83% |
| Kentucky average: | 6.89% |
10 or fewer of this county's residents moved to foreign countries.
5.10% relocated to other counties in Kentucky ($30,167 average AGI)
0.74% relocated to other states ($5,045 average AGI)
Butler County: 0.74% Kentucky average: 2.73%

Top counties to which taxpayers relocated from this county between 2020 and 2021:
| to Warren County, KY | |
| to Ohio County, KY |
Births per 1000 population from 1990 to 1999: 12.4
Births per 1000 population from 2000 to 2006: 12.5

Deaths per 1000 population from 1990 to 1999: 11.0
Deaths per 1000 population from 2000 to 2009: 10.1
Deaths per 1000 population from 2010 to 2020: 12.5

Infant deaths per 1000 live births from 1990 to 1999: 8.8
Infant deaths per 1000 live births from 2000 to 2006: 11.1

Persons under 19 years old without health insurance coverage in 2018: 5.6%


Persons enrolled in hospital insurance and/or supplemental medical insurance (Medicare) in July 1, 2007: 2,470 (1,776 aged, 694 disabled)
Children under 18 without health insurance coverage in 2007: 346 (11%)


Most common underlying causes of death in Butler County, Kentucky in 1999 - 2019:
- Acute myocardial infarction, unspecified (271)
- Bronchus or lung, unspecified - Malignant neoplasms (224)
- Unspecified dementia (104)
- Chronic obstructive pulmonary disease, unspecified (72)
- Congestive heart failure (21)
- Cardiac arrest, unspecified (11)
Population without health insurance coverage in 2000: 14%
Children under 18 without health insurance coverage in 2000: 10%
Medical specialist MDs per 100,000 population in 2005: 1,029
Total births per 100,000 population, July 2005 - July 2006 : 8
Total deaths per 100,000 population, July 2005 - July 2006: 45
Limited-service eating places per 100,000 population in 2005 : 7
Crimes per 100,000 population in 1996: 1
Household type by relationship:
Households: 12,390- Male householders: 2,365 (485 living alone), Female householders: 2,276 (631 living alone)
2,590 spouses (2,590 opposite-sex spouses), 419 unmarried partners, (389 opposite-sex unmarried partners), 3,473 children (3,262 natural, 99 adopted, 112 stepchildren), 268 grandchildren, 78 brothers or sisters, 190 parents, 174 foster children, 193 other relatives, 153 non-relatives
- In group quarters: 180
Size of family households: 1,651 2-persons, 555 3-persons, 597 4-persons, 241 5-persons, 131 6-persons, 55 7-or-more-persons.
Size of nonfamily households: 1,117 1-person, 265 2-persons, 29 3-persons.
1,713 married couples with children.
609 single-parent households (180 men, 429 women).
93.3% of residents of Butler speak English at home.
2.2% of residents speak Spanish at home (16% speak English very well, 42% speak English well, 26% speak English not well, 17% don't speak English at all).
3.0% of residents speak other Indo-European language at home (24% speak English very well, 63% speak English well, 9% speak English not well, 4% don't speak English at all).
0.4% of residents speak Asian or Pacific Island language at home (39% speak English very well, 61% speak English well).
1.4% of residents speak other language at home (33% speak English not well, 67% don't speak English at all).
In fiscal year 2004:
Federal Government expenditure: $70,023,000 ($5,240 per capita)
Department of Defense expenditure: $933,000
Federal direct payments to individuals for retirement and disability: $29,887,000
Federal other direct payments to individuals: $16,636,000
Federal direct payments not to individuals: $1,800,000
Federal grants: $19,553,000
Federal procurement contracts: $402,000 ($4,000 Department of Defense)
Federal salaries and wages: $1,745,000 ($0,000 Department of Defense)
Federal Government direct loans: $553,000
Federal guaranteed/insured loans: $1,913,000
Federal Government insurance: $4,076,000
Population change from April 1, 2000 to July 1, 2005:
Births: 868| Here: | 65 per 1000 residents |
| State: | 69 per 1000 residents |
Deaths: 660
| Here: | 49 per 1000 residents |
| State: | 50 per 1000 residents |
Net international migration: +93
| Here: | +7 per 1000 residents |
| State: | +7 per 1000 residents |
Net internal migration: +120
| Here: | +9 per 1000 residents |
| State: | +8 per 1000 residents |

Total withdrawal of fresh water for public supply: 1.25 millions of gallons per day (all from surface)
| Here: | 5.8 |
| State: | 6.4 |
| Here: | 4.9 |
| State: | 4.4 |

- Year house built in Butler County, Kentucky
- 02020 or later
- 9562010 to 2019
- 6792000 to 2009
- 9911990 to 1999
- 6121980 to 1989
- 9021970 to 1979
- 6071960 to 1969
- 3421950 to 1959
- 771940 to 1949
- 3821939 or earlier

- Rooms in owner-occupied houses in Butler County, Kentucky
- 01 room
- 02 rooms
- 763 rooms
- 3494 rooms
- 1,0275 rooms
- 7506 rooms
- 3467 rooms
- 4038 rooms
- 4259+ rooms

- Rooms in renter-occupied apartments in Butler County, Kentucky
- 81 room
- 662 rooms
- 1683 rooms
- 2614 rooms
- 3925 rooms
- 2036 rooms
- 697 rooms
- 888 rooms
- 99+ rooms

- Bedrooms in owner-occupied houses in Butler County, Kentucky
- 0no bedroom
- 501 bedroom
- 6072 bedrooms
- 2,2543 bedrooms
- 3534 bedrooms
- 1275+ bedrooms

- Bedrooms in renter-occupied apartments in Butler County, Kentucky
- 8no bedroom
- 1601 bedroom
- 5672 bedrooms
- 3753 bedrooms
- 1484 bedrooms
- 05+ bedrooms

- Cars and other vehicles available in Butler County in owner-occupied houses/condos
- 125no vehicle
- 7471 vehicle
- 1,2212 vehicles
- 8843 vehicles
- 2454 vehicles
- 1515+ vehicles

- Cars and other vehicles available in Butler County in renter-occupied apartments
- 174no vehicle
- 4991 vehicle
- 4202 vehicles
- 1263 vehicles
- 144 vehicles
- 275+ vehicles
86.4% of Butler County residents lived in the same house 1 years ago.
Out of people who lived in different houses, 35% lived in this county.
Out of people who lived in different counties, 82% lived in Kentucky.
| Butler County: | 86.4% |
| State average: | 87.2% |
Place of birth for U.S.-born residents:
- This state: 9,604
- Other state: 2,383
- Northeast: 196
- Midwest: 975
- South: 984
- West: 227


- 56.4%Electricity
- 18.4%Utility gas
- 15.8%Bottled, tank, or LP gas
- 8.3%Wood
- 0.8%Fuel oil, kerosene, etc.
- 0.3%Other fuel

- 69.8%Electricity
- 14.4%Utility gas
- 8.9%Bottled, tank, or LP gas
- 4.8%Wood
- 1.9%No fuel used
- 0.3%Other fuel
Private vs. public school enrollment:
| Here: | 23.9% |
| Kentucky: | 17.2% |
| Here: | 18.3% |
| Kentucky: | 15.2% |
| Here: | 18.8% |
| Kentucky: | 19.6% |


Butler County government finances - Expenditure in 2012:
- Bond Funds - Cash and Securities: $570,000
- Charges - Other: $325,000
Parks and Recreation: $5,000
- Construction - Regular Highways: $202,000
General - Other: $16,000
- Current Operations - General - Other: $1,360,000
Regular Highways: $1,288,000
Correctional Institutions: $581,000
Police Protection: $521,000
Central Staff Services: $315,000
General Public Buildings: $165,000
Local Fire Protection: $85,000
Health - Other: $80,000
Judicial and Legal Services: $66,000
Financial Administration: $65,000
Solid Waste Management: $63,000
Natural Resources - Other: $43,000
Public Welfare - Other: $21,000
Parks and Recreation: $5,000
- Federal Intergovernmental - Other: $218,000
Health and Hospitals: $2,000
- General - Interest on Debt: $6,000
- Intergovernmental to Local - Other - Correctional Institutions: $15,000
- Intergovernmental to State - Housing and Community Development: $13,000
General - Other: $12,000
- Miscellaneous - General Revenue - Other: $169,000
Interest Earnings: $11,000
Fines and Forfeits: $4,000
- Other Capital Outlay - General - Other: $189,000
General Public Building: $111,000
Regular Highways: $68,000
Police Protection: $59,000
Local Fire Protection: $3,000
Central Staff Services: $3,000
- Other Funds - Cash and Securities: $1,170,000
- State Intergovernmental - Highways: $1,373,000
Other: $1,274,000
General Local Government Support: $149,000
- Tax - Individual Income: $851,000
Property: $495,000
Motor Vehicle License: $170,000
Corporation License: $34,000
Public Utilities Sales: $22,000
Documentary and Stock Transfer: $20,000
Other License: $4,000
- Total Salaries and Wages: $1,575,000
Butler County government finances - Revenue in 2012:
- Bond Funds - Cash and Securities: $570,000
- Charges - Other: $325,000
Parks and Recreation: $5,000
- Construction - Regular Highways: $202,000
General - Other: $16,000
- Current Operations - General - Other: $1,360,000
Regular Highways: $1,288,000
Correctional Institutions: $581,000
Police Protection: $521,000
Central Staff Services: $315,000
General Public Buildings: $165,000
Local Fire Protection: $85,000
Health - Other: $80,000
Judicial and Legal Services: $66,000
Financial Administration: $65,000
Solid Waste Management: $63,000
Natural Resources - Other: $43,000
Public Welfare - Other: $21,000
Parks and Recreation: $5,000
- Federal Intergovernmental - Other: $218,000
Health and Hospitals: $2,000
- General - Interest on Debt: $6,000
- Intergovernmental to Local - Other - Correctional Institutions: $15,000
- Intergovernmental to State - Housing and Community Development: $13,000
General - Other: $12,000
- Miscellaneous - General Revenue - Other: $169,000
Interest Earnings: $11,000
Fines and Forfeits: $4,000
- Other Capital Outlay - General - Other: $189,000
General Public Building: $111,000
Regular Highways: $68,000
Police Protection: $59,000
Local Fire Protection: $3,000
Central Staff Services: $3,000
- Other Funds - Cash and Securities: $1,170,000
- State Intergovernmental - Highways: $1,373,000
Other: $1,274,000
General Local Government Support: $149,000
- Tax - Individual Income: $851,000
Property: $495,000
Motor Vehicle License: $170,000
Corporation License: $34,000
Public Utilities Sales: $22,000
Documentary and Stock Transfer: $20,000
Other License: $4,000
- Total Salaries and Wages: $1,575,000
Butler County government finances - Debt in 2012:
- Bond Funds - Cash and Securities: $570,000
- Charges - Other: $325,000
Parks and Recreation: $5,000
- Construction - Regular Highways: $202,000
General - Other: $16,000
- Current Operations - General - Other: $1,360,000
Regular Highways: $1,288,000
Correctional Institutions: $581,000
Police Protection: $521,000
Central Staff Services: $315,000
General Public Buildings: $165,000
Local Fire Protection: $85,000
Health - Other: $80,000
Judicial and Legal Services: $66,000
Financial Administration: $65,000
Solid Waste Management: $63,000
Natural Resources - Other: $43,000
Public Welfare - Other: $21,000
Parks and Recreation: $5,000
- Federal Intergovernmental - Other: $218,000
Health and Hospitals: $2,000
- General - Interest on Debt: $6,000
- Intergovernmental to Local - Other - Correctional Institutions: $15,000
- Intergovernmental to State - Housing and Community Development: $13,000
General - Other: $12,000
- Miscellaneous - General Revenue - Other: $169,000
Interest Earnings: $11,000
Fines and Forfeits: $4,000
- Other Capital Outlay - General - Other: $189,000
General Public Building: $111,000
Regular Highways: $68,000
Police Protection: $59,000
Local Fire Protection: $3,000
Central Staff Services: $3,000
- Other Funds - Cash and Securities: $1,170,000
- State Intergovernmental - Highways: $1,373,000
Other: $1,274,000
General Local Government Support: $149,000
- Tax - Individual Income: $851,000
Property: $495,000
Motor Vehicle License: $170,000
Corporation License: $34,000
Public Utilities Sales: $22,000
Documentary and Stock Transfer: $20,000
Other License: $4,000
- Total Salaries and Wages: $1,575,000
Butler County government finances - Cash and Securities in 2012:
- Bond Funds - Cash and Securities: $570,000
- Charges - Other: $325,000
Parks and Recreation: $5,000
- Construction - Regular Highways: $202,000
General - Other: $16,000
- Current Operations - General - Other: $1,360,000
Regular Highways: $1,288,000
Correctional Institutions: $581,000
Police Protection: $521,000
Central Staff Services: $315,000
General Public Buildings: $165,000
Local Fire Protection: $85,000
Health - Other: $80,000
Judicial and Legal Services: $66,000
Financial Administration: $65,000
Solid Waste Management: $63,000
Natural Resources - Other: $43,000
Public Welfare - Other: $21,000
Parks and Recreation: $5,000
- Federal Intergovernmental - Other: $218,000
Health and Hospitals: $2,000
- General - Interest on Debt: $6,000
- Intergovernmental to Local - Other - Correctional Institutions: $15,000
- Intergovernmental to State - Housing and Community Development: $13,000
General - Other: $12,000
- Miscellaneous - General Revenue - Other: $169,000
Interest Earnings: $11,000
Fines and Forfeits: $4,000
- Other Capital Outlay - General - Other: $189,000
General Public Building: $111,000
Regular Highways: $68,000
Police Protection: $59,000
Local Fire Protection: $3,000
Central Staff Services: $3,000
- Other Funds - Cash and Securities: $1,170,000
- State Intergovernmental - Highways: $1,373,000
Other: $1,274,000
General Local Government Support: $149,000
- Tax - Individual Income: $851,000
Property: $495,000
Motor Vehicle License: $170,000
Corporation License: $34,000
Public Utilities Sales: $22,000
Documentary and Stock Transfer: $20,000
Other License: $4,000
- Total Salaries and Wages: $1,575,000
Supplemental Security Income (SSI) in 2006:
- Total number of recipients: 673
- Number of aged recipients: 69
- Number of blind and disabled recipients: 604
- Number of recipients under 18: 68
- Number of recipients between 18 and 64: 442
- Number of recipients older than 64: 163
- Number of recipients also receiving OASDI: 300
- Amount of payments (thousands of dollars): 274
| Most common first names in Butler County, KY among deceased individuals | ||
| Name | Count | Lived (average) |
|---|---|---|
| James | 85 | 69.8 years |
| William | 70 | 72.7 years |
| Mary | 51 | 77.9 years |
| John | 39 | 72.5 years |
| Robert | 29 | 69.3 years |
| Charles | 26 | 68.5 years |
| George | 20 | 78.6 years |
| Paul | 19 | 68.4 years |
| Dorothy | 17 | 76.6 years |
| Ruby | 17 | 80.2 years |
| Most common last names in Butler County, KY among deceased individuals | ||
| Last name | Count | Lived (average) |
|---|---|---|
| Johnson | 86 | 71.4 years |
| Embry | 79 | 73.8 years |
| Phelps | 69 | 70.9 years |
| Hunt | 65 | 73.2 years |
| Flener | 59 | 77.9 years |
| Smith | 57 | 73.2 years |
| Mckinney | 56 | 76.5 years |
| Cardwell | 52 | 68.3 years |
| West | 38 | 75.7 years |
| Lee | 35 | 72.8 years |
| Businesses in Butler County, KY | ||||
| Name | Count | Name | Count | |
|---|---|---|---|---|
| FedEx | 1 | Rite Aid | 1 | |
| GNC | 1 | SONIC Drive-In | 1 | |
| H&R Block | 1 | Subway | 1 | |
| Hardee's | 1 | True Value | 1 | |
| McDonald's | 1 | U-Haul | 1 | |
| Motel 6 | 1 | UPS | 1 | |
| RadioShack | 1 | |||