Averages for the 2020 tax year for zip code 98315, filed in 2021:
Average Adjusted Gross Income (AGI) in 2020: $48,862 (Individual Income Tax Returns)
Here:
$48,862
State:
$99,264
Salary/wage: $46,120 (reported on 98.7% of returns)
Here:
$46,120
State:
$80,347
(% of AGI for various income ranges: 1944.0% for AGIs below $25k, 3557.9% for AGIs $25k-50k, 6119.7% for AGIs $50k-75k, 9064.5% for AGIs $75k-100k, 16764.3% for AGIs $100k-200k)
Taxable interest for individuals: $404 (reported on 16.4% of returns)
This zip code:
$404
Washington:
$2,077
(% of AGI for various income ranges: 0.3% for AGIs below $25k, 2.9% for AGIs $25k-50k, 3.8% for AGIs $50k-75k, 4.5% for AGIs $75k-100k, 92.9% for AGIs $100k-200k)
Ordinary dividends: $436 (reported on 9.2% of returns)
Here:
$436
State:
$10,013
(% of AGI for various income ranges: 1.5% for AGIs $25k-50k, 3.1% for AGIs $50k-75k, 60.0% for AGIs $100k-200k)
Net capital gain/loss in AGI: +$1,561 (reported on 11.8% of returns)
Here:
+$1,561
State:
+$40,092
(% of AGI for various income ranges: 4.8% for AGIs $25k-50k, 8.4% for AGIs $50k-75k, 66.4% for AGIs $75k-100k, 215.7% for AGIs $100k-200k)
Profit/loss from business: +$4,089 (reported on 5.9% of returns)
Here:
+$4,089
State:
+$18,312
(% of AGI for various income ranges: 7.4% for AGIs $25k-50k, 56.2% for AGIs $50k-75k, 129.1% for AGIs $75k-100k)
Total itemized deductions: $27,300 (reported on 1.3% of returns)
Here:
$27,300
State:
$39,068
(% of AGI for various income ranges: 88.1% for AGIs $25k-50k)
Taxes paid: $6,750 (reported on 1.3% of returns)
98315:
$6,750
State:
$7,774
(% of AGI for various income ranges: 42.2% for AGIs $50k-75k)
Earned income credit: $2,733 (reported on 17.8% of returns)
Here:
$2,733
State:
$2,020
(% of AGI for various income ranges: 89.7% for AGIs below $25k, 71.3% for AGIs $25k-50k, 8.4% for AGIs $50k-75k)
Percentage of individuals using paid preparers for their 2020 taxes: 98.0%
Here:
98%
State:
93%
(% for various income ranges: 96.9% for AGIs below $25k, 100.0% for AGIs $25k-50k, 97.1% for AGIs $50k-75k, 100.0% for AGIs $75k-100k, 90.0% for AGIs $100k-200k)
Averages for the 2012 tax year for zip code 98315, filed in 2013:
Average Adjusted Gross Income (AGI) in 2012: $35,149 (Individual Income Tax Returns)
Here:
$35,149
State:
$69,533
Salary/wage: $34,303 (reported on 99.0% of returns)
Here:
$34,303
State:
$57,267
(% of AGI for various income ranges: 99.9% for AGIs below $25k, 100.2% for AGIs $25k-50k, 96.5% for AGIs $50k-75k, 94.0% for AGIs $75k-100k, 78.4% for AGIs $100k-200k)
Taxable interest for individuals: $152 (reported on 15.0% of returns)
This zip code:
$152
Washington:
$1,816
(% of AGI for various income ranges: 0.1% for AGIs $75k-100k)
Ordinary dividends: $422 (reported on 4.7% of returns)
Here:
$422
State:
$8,163
(% of AGI for various income ranges: 0.2% for AGIs $75k-100k)
Net capital gain/loss in AGI: +$100 (reported on 2.1% of returns)
Here:
+$100
State:
+$21,568
Profit/loss from business: +$2,329 (reported on 3.6% of returns)
Here:
+$2,329
State:
+$16,521
Total itemized deductions: $18,154 (24% of AGI, reported on 6.7% of returns)
Here:
$18,154
State:
$23,872
Here:
23.9% of AGI
State:
18.2% of AGI
(% of AGI for various income ranges: 2.9% for AGIs $25k-50k, 5.9% for AGIs $50k-75k, 12.1% for AGIs $100k-200k)
Charity contributions: $2,550 (reported on 4.1% of returns)
Here:
$2,550
State:
$4,465
(% of AGI for various income ranges: 0.2% for AGIs $25k-50k, 0.4% for AGIs $50k-75k, 1.6% for AGIs $100k-200k)
Taxes paid: $4,367 (reported on 6.2% of returns)
98315:
$4,367
State:
$6,400
(% of AGI for various income ranges: 0.5% for AGIs $25k-50k, 1.3% for AGIs $50k-75k, 3.3% for AGIs $100k-200k)
Earned income credit: $2,488 (reported on 25.9% of returns)
Here:
$2,488
State:
$2,073
(% of AGI for various income ranges: 2.9% for AGIs below $25k, 3.0% for AGIs $25k-50k)
Percentage of individuals using paid preparers for their 2012 taxes: 29.5%
Here:
30%
State:
43%
(% for various income ranges: 27.6% for AGIs below $25k, 28.8% for AGIs $25k-50k, 33.3% for AGIs $50k-75k, 28.6% for AGIs $75k-100k, 60.0% for AGIs $100k-200k)
Averages for the 2004 tax year for zip code 98315, filed in 2005:
Average Adjusted Gross Income (AGI) in 2004: $31,249 (Individual Income Tax Returns)
Here:
$31,249
State:
$54,331
Salary/wage: $30,858 (reported on 99.4% of returns)
Here:
$30,858
State:
$45,761
(% of AGI for various income ranges: 135.2% for AGIs below $10k, 99.8% for AGIs $10k-25k, 99.4% for AGIs $25k-50k, 94.6% for AGIs $50k-75k, 94.1% for AGIs $75k-100k, 87.4% for AGIs over 100k)
Taxable interest for individuals: $190 (reported on 24.1% of returns)
This zip code:
$190
Washington:
$2,110
(% of AGI for various income ranges: 0.1% for AGIs $10k-25k, 0.1% for AGIs $25k-50k, 0.2% for AGIs $50k-75k, 0.1% for AGIs $75k-100k, 0.4% for AGIs over 100k)
Taxable dividends: $302 (reported on 6.6% of returns)
Here:
$302
State:
$5,879
(% of AGI for various income ranges: 0.0% for AGIs $10k-25k, 0.1% for AGIs $25k-50k, 0.1% for AGIs $50k-75k, 0.2% for AGIs $75k-100k, 0.2% for AGIs over 100k)
Profit/loss from business: +$1,306 (reported on 3.5% of returns)
Here:
+$1,306
State:
+$13,994
IRA payment deduction: $2,111 (reported on 2.0% of returns)
98315:
$2,111
Washington:
$3,001
Total itemized deductions: $15,672 (26% of AGI, reported on 6.6% of returns)
Here:
$15,672
State:
$19,669
Here:
25.9% of AGI
State:
20.7% of AGI
(% of AGI for various income ranges: 0.8% for AGIs $10k-25k, 2.5% for AGIs $25k-50k, 5.0% for AGIs $50k-75k, 7.8% for AGIs $75k-100k, 13.3% for AGIs over 100k)
Charity contributions deductions: $2,804 (4% of AGI, reported on 5.2% of returns)
Here:
$2,804
State:
$3,569
Here:
4.3% of AGI
State:
3.5% of AGI
(% of AGI for various income ranges: 0.2% for AGIs $25k-50k, 0.6% for AGIs $50k-75k, 1.9% for AGIs $75k-100k, 2.9% for AGIs over 100k)
Total tax: $2,106 (reported on 69.0% of returns)
98315:
$2,106
State:
$9,065
(% of AGI for various income ranges: 1.1% for AGIs below $10k, 4.1% for AGIs $10k-25k, 2.9% for AGIs $25k-50k, 6.6% for AGIs $50k-75k, 8.4% for AGIs $75k-100k, 13.9% for AGIs over 100k)
Earned income credit: $1,453 (reported on 18.6% of returns)
Here:
$1,453
State:
$1,607
Percentage of individuals using paid preparers for their 2004 taxes: 63.1%
Here:
63%
State:
49%
(% for various income ranges: 45.9% for AGIs below $10k, 70.2% for AGIs $10k-25k, 62.8% for AGIs $25k-50k, 52.5% for AGIs $50k-75k, 51.2% for AGIs $75k-100k)
Household received Food Stamps/SNAP in the past 12 months: 41 Household did not receive Food Stamps/SNAP in the past 12 months: 1,079
Women who had a birth in the past 12 months: 138 (142 now married, 0 unmarried) Women who did not have a birth in the past 12 months: 1,118 (766 now married, 343 unmarried)
Housing units in zip code 98315 with a mortgage: 11 Residents with income below the poverty level in 2022:
This zip code:
3.2%
Whole state:
10.0%
Residents with income below 50% of the poverty level in 2022:
This zip code:
1.4%
Whole state:
4.6%
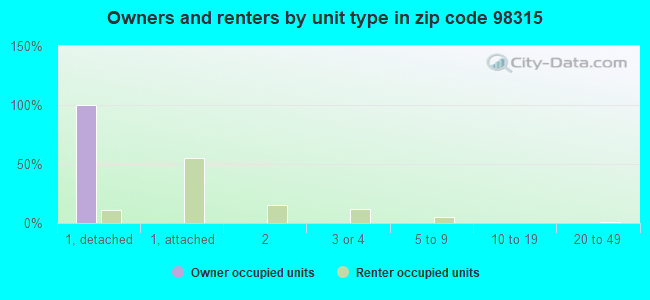
Median number of rooms in apartments:
Here:
5.8
State:
3.9
Notable locations in this zip code not listed on our city pages
In group quarters: 2,406 (-1 institutionalized population)
Size of family households: 324 2-persons, 146 3-persons, 289 4-persons, 115 5-persons, 109 6-persons, 18 7-or-more-persons
Size of nonfamily households: 70 1-person, 28 2-persons
1,397 married couples with children.
140 single-parent households (140 women).
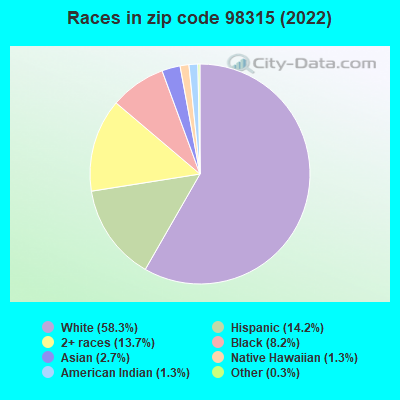
87.2% of residents of 98315 zip code speak English at home.
5.9% of residents speak Spanish at home (63% very well, 37% well).
1.8% of residents speak other Indo-European language at home (92% very well, 8% well).
2.9% of residents speak Asian or Pacific Island language at home (91% very well, 9% well).
0.7% of residents speak other language at home (78% very well, 22% well).
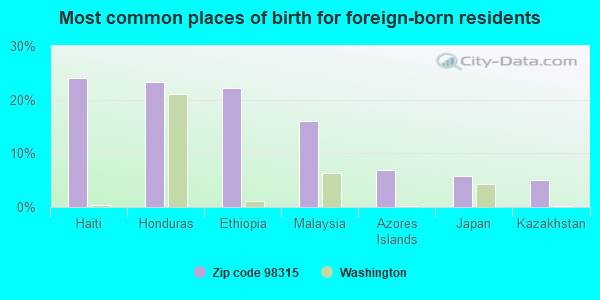
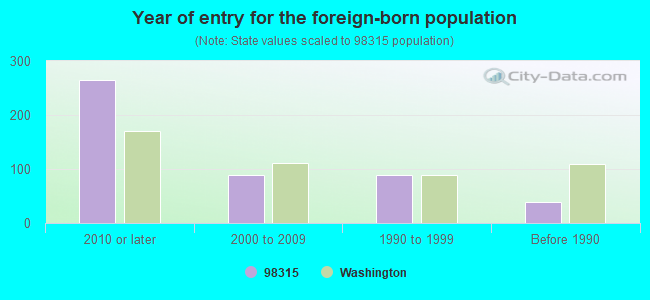
Foreign born population: 263 (4.3%) (57.9% of them are naturalized citizens)
Population in 1990: 3,702. Population change in the 1990s: +3,551 (+95.9%).
Place of birth for U.S.-born residents:
This state: 763
Northeast: 942
Midwest: 667
South: 1,761
West: 1,487
9% of the 98315 zip code residents lived in the same house 5 years ago. Out of people who lived in different houses, 24% lived in this county. Out of people who lived in different counties, 50% lived in Washington.
62% of the 98315 zip code residents lived in the same house 1 year ago. Out of people who lived in different houses, 26% moved from this county. Out of people who lived in different houses, 2% moved from different county within same state. Out of people who lived in different houses, 67% moved from different state. Out of people who lived in different houses, 6% moved from abroad.
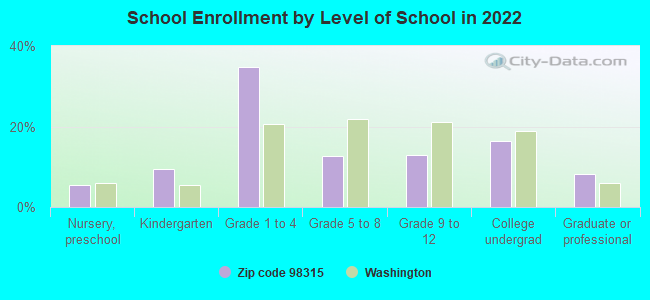
Private vs. public school enrollment:
Students in private schools in grades 1 to 8 (elementary and middle school): 112
Here:
21.0%
Washington:
12.4%
Students in private schools in grades 9 to 12 (high school): 82
Here:
55.1%
Washington:
9.2%
Students in private undergraduate colleges: 46
Here:
25.2%
Washington:
16.5%
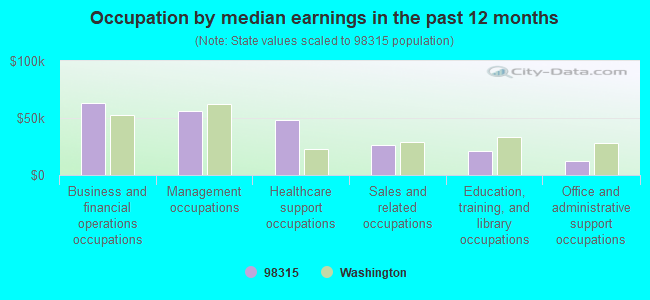
Occupation by median earnings in the past 12 months ($)
63,489Business and financial operations occupations
56,334Management occupations
48,230Healthcare support occupations
26,101Sales and related occupations
21,448Education, training, and library occupations
11,979Office and administrative support occupations
Companies with federal contracts located in this zip code:
JOHNSON CONTROLS WORLD SERVICE (NAVAL SUBMARINE BASE BANGO in SILVERDALE, WA) : $391,427,301 in 2912 contractsfrom 1999 to 2006
Contracts for Facilities Operations Support Services, Maintenance, Repair or Alteration of Real Property -- Other Non-Building Facilities, Maintenance, Repair or Alteration of Real Property -- Miscellaneous Buildings, Construction of Structures and Facilities -- Miscellaneous Buildings, and moreby Navy Signed by year:2000: $56,760,545; 2001: $56,150,348; 2002: $71,338,219; 2003: $27,078,828; 2004: $105,753,646; 2005: $28,710,446; 2006: $329,068.
Biggest contracts:
$54,332,441 with Navy for Facilities Operations Support Services. Signed on 2004-09-30. Completion date: 2007-09-30.
$47,697,849, same as above.Signed on 2002-10-04. Completion date: 2003-09-30.
$44,364,290, same as above.Signed on 2000-10-03. Completion date: 2001-09-30.
$41,132,743, same as above.Signed on 2002-11-04. Completion date: 2003-09-30.
DOCUMENT AUTOMATION & PRODUCTI (1100 HUNLEY RD STE 108 in SILVERDALE, WA) : $506,721 in 32 contractsfrom 2003 to 2006
Contracts for Print/Binding Services, Training Aids, Printing, Duplicating, and Bookbinding Equipment, Books and Pamphlets, and moreby Navy, Army, Forest Service, Air Force, and others Signed by year:2000: $0; 2001: $0; 2002: $0; 2003: $366,300; 2004: $54,408; 2005: $74,150; 2006: $11,863.
Biggest contracts:
$80,000 with Navy for Print/Binding Services. Signed on 2003-10-30. Completion date: 2004-09-30.
$75,000, same as above.Signed on 2003-10-28. Completion date: 2004-09-30.
$56,500, same as above.Signed on 2003-04-14. Completion date: 2003-05-26.
$48,430 with Army for Training Aids. Signed on 2005-09-09. Completion date: 2005-12-30.
Top industries in this zip code by the number of employees in 2005:
Administrative and Support and Waste Management and Remediation Services: Facilities Support Services (500-999 employees: 1 establishment, 20-49 employees: 1 establishment)
Accommodation and Food Services: Limited-Service Restaurants (20-49: 1, 10-19: 2)
Health Care and Social Assistance: Vocational Rehabilitation Services (20-49: 1, 5-9: 1)
Information: Data Processing, Hosting, and Related Services (10-19: 1)
Professional, Scientific, and Technical Services: Engineering Services (10-19: 1)
Finance and Insurance: Commercial Banking (5-9: 1)
Professional, Scientific, and Technical Services: Computer Systems Design Services (5-9: 1)
Information: Cellular and Other Wireless Telecommunications (5-9: 1)
Finance and Insurance: Credit Unions (5-9: 1)
People in group quarters in 2010:
1,245 people in military barracks and dormitories (nondisciplinary)
972 people in military ships
People in group quarters in 2000:
1,851 people in military disciplinary barracks
471 people in military barracks, etc.
327 people in military ships
48 people in military transient quarters for temporary residents
Fatal accident statistics in 2014:
Fatal accident count: 1
Vehicles involved in fatal accidents: 1
Fatal accidents caused by drunken drivers: 0
Fatalities: 1
Persons involved in fatal accidents: 1
Pedestrians involved in fatal accidents: 1
Home Mortgage Disclosure Act Aggregated Statistics For Year 2009 (Based on 2 partial tracts)
A) FHA, FSA/RHS & VA Home Purchase Loans
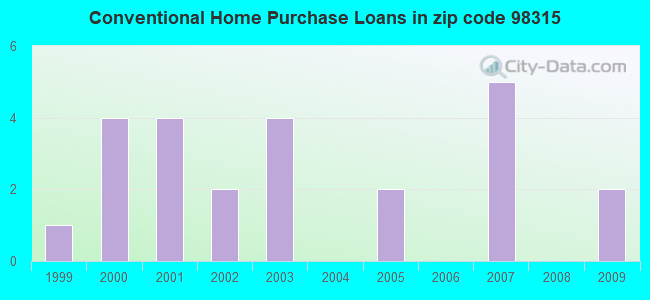
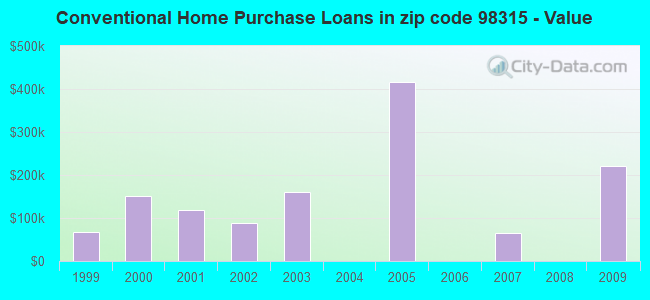
B) Conventional Home Purchase Loans
C) Refinancings
F) Non-occupant Loans on < 5 Family Dwellings (A B C & D)
Number
Average Value
Number
Average Value
Number
Average Value
Number
Average Value
LOANS ORIGINATED
2
$269,040
2
$220,705
2
$380,305
0
$0
APPLICATIONS APPROVED, NOT ACCEPTED
0
$0
0
$0
0
$0
0
$0
APPLICATIONS DENIED
0
$0
0
$0
0
$0
0
$0
APPLICATIONS WITHDRAWN
0
$0
0
$0
4
$164,615
4
$164,615
FILES CLOSED FOR INCOMPLETENESS
0
$0
0
$0
0
$0
0
$0
Aggregated Statistics For Year 2008 (Based on 2 partial tracts)
C) Refinancings
D) Home Improvement Loans
Number
Average Value
Number
Average Value
LOANS ORIGINATED
0
$0
4
$7,295
APPLICATIONS APPROVED, NOT ACCEPTED
2
$350,210
0
$0
APPLICATIONS DENIED
0
$0
0
$0
APPLICATIONS WITHDRAWN
0
$0
0
$0
FILES CLOSED FOR INCOMPLETENESS
0
$0
0
$0
Aggregated Statistics For Year 2007 (Based on 2 partial tracts)
B) Conventional Home Purchase Loans
C) Refinancings
D) Home Improvement Loans
G) Loans On Manufactured Home Dwelling (A B C & D)
Number
Average Value
Number
Average Value
Number
Average Value
Number
Average Value
LOANS ORIGINATED
5
$64,570
0
$0
2
$3,650
5
$64,570
APPLICATIONS APPROVED, NOT ACCEPTED
0
$0
0
$0
0
$0
0
$0
APPLICATIONS DENIED
2
$41,040
4
$209,305
0
$0
0
$0
APPLICATIONS WITHDRAWN
0
$0
4
$190,152
0
$0
0
$0
FILES CLOSED FOR INCOMPLETENESS
0
$0
0
$0
0
$0
0
$0
Aggregated Statistics For Year 2006 (Based on 2 partial tracts)
A) FHA, FSA/RHS & VA Home Purchase Loans
B) Conventional Home Purchase Loans
C) Refinancings
D) Home Improvement Loans
Number
Average Value
Number
Average Value
Number
Average Value
Number
Average Value
LOANS ORIGINATED
2
$235,295
0
$0
4
$322,392
0
$0
APPLICATIONS APPROVED, NOT ACCEPTED
0
$0
0
$0
0
$0
0
$0
APPLICATIONS DENIED
0
$0
0
$0
0
$0
2
$5,470
APPLICATIONS WITHDRAWN
0
$0
11
$106,787
4
$228,000
0
$0
FILES CLOSED FOR INCOMPLETENESS
0
$0
0
$0
0
$0
0
$0
Aggregated Statistics For Year 2005 (Based on 2 partial tracts)
B) Conventional Home Purchase Loans
C) Refinancings
D) Home Improvement Loans
G) Loans On Manufactured Home Dwelling (A B C & D)
Number
Average Value
Number
Average Value
Number
Average Value
Number
Average Value
LOANS ORIGINATED
2
$415,870
0
$0
0
$0
0
$0
APPLICATIONS APPROVED, NOT ACCEPTED
0
$0
0
$0
0
$0
0
$0
APPLICATIONS DENIED
7
$52,896
4
$134,520
2
$5,470
4
$31,920
APPLICATIONS WITHDRAWN
7
$165,723
4
$98,952
2
$11,855
0
$0
FILES CLOSED FOR INCOMPLETENESS
7
$133,934
4
$346,105
0
$0
0
$0
Aggregated Statistics For Year 2004 (Based on 2 partial tracts)
A) FHA, FSA/RHS & VA Home Purchase Loans
B) Conventional Home Purchase Loans
C) Refinancings
D) Home Improvement Loans
F) Non-occupant Loans on < 5 Family Dwellings (A B C & D)
G) Loans On Manufactured Home Dwelling (A B C & D)
Number
Average Value
Number
Average Value
Number
Average Value
Number
Average Value
Number
Average Value
Number
Average Value
LOANS ORIGINATED
0
$0
0
$0
2
$112,175
7
$9,120
2
$2,735
0
$0
APPLICATIONS APPROVED, NOT ACCEPTED
0
$0
4
$120,385
2
$328,320
0
$0
0
$0
2
$145,920
APPLICATIONS DENIED
2
$112,175
5
$275,788
5
$104,332
5
$39,764
0
$0
0
$0
APPLICATIONS WITHDRAWN
0
$0
7
$185,527
2
$22,800
0
$0
0
$0
0
$0
FILES CLOSED FOR INCOMPLETENESS
2
$93,025
4
$182,400
0
$0
0
$0
0
$0
0
$0
Aggregated Statistics For Year 2003 (Based on 2 partial tracts)
B) Conventional Home Purchase Loans
C) Refinancings
D) Home Improvement Loans
F) Non-occupant Loans on < 5 Family Dwellings (A B C & D)
Number
Average Value
Number
Average Value
Number
Average Value
Number
Average Value
LOANS ORIGINATED
4
$160,055
18
$124,539
7
$9,901
0
$0
APPLICATIONS APPROVED, NOT ACCEPTED
4
$127,680
2
$41,040
0
$0
2
$41,040
APPLICATIONS DENIED
4
$26,448
0
$0
0
$0
0
$0
APPLICATIONS WITHDRAWN
0
$0
2
$65,665
0
$0
0
$0
FILES CLOSED FOR INCOMPLETENESS
2
$145,920
0
$0
0
$0
0
$0
Aggregated Statistics For Year 2002 (Based on 2 partial tracts)
A) FHA, FSA/RHS & VA Home Purchase Loans
B) Conventional Home Purchase Loans
C) Refinancings
D) Home Improvement Loans
F) Non-occupant Loans on < 5 Family Dwellings (A B C & D)
Number
Average Value
Number
Average Value
Number
Average Value
Number
Average Value
Number
Average Value
LOANS ORIGINATED
0
$0
2
$89,375
0
$0
4
$5,015
0
$0
APPLICATIONS APPROVED, NOT ACCEPTED
0
$0
2
$51,985
0
$0
2
$7,295
2
$7,295
APPLICATIONS DENIED
0
$0
5
$95,578
2
$68,400
2
$4,560
0
$0
APPLICATIONS WITHDRAWN
2
$134,975
2
$182,400
0
$0
0
$0
2
$182,400
FILES CLOSED FOR INCOMPLETENESS
2
$148,655
0
$0
0
$0
0
$0
0
$0
Aggregated Statistics For Year 2001 (Based on 2 partial tracts)
A) FHA, FSA/RHS & VA Home Purchase Loans
B) Conventional Home Purchase Loans
C) Refinancings
D) Home Improvement Loans
Number
Average Value
Number
Average Value
Number
Average Value
Number
Average Value
LOANS ORIGINATED
0
$0
4
$119,472
0
$0
9
$15,808
APPLICATIONS APPROVED, NOT ACCEPTED
0
$0
0
$0
2
$127,680
0
$0
APPLICATIONS DENIED
0
$0
4
$19,608
4
$70,680
0
$0
APPLICATIONS WITHDRAWN
2
$106,705
2
$18,240
2
$115,825
2
$13,680
FILES CLOSED FOR INCOMPLETENESS
0
$0
0
$0
2
$9,120
0
$0
Aggregated Statistics For Year 2000 (Based on 2 partial tracts)
A) FHA, FSA/RHS & VA Home Purchase Loans
B) Conventional Home Purchase Loans
C) Refinancings
D) Home Improvement Loans
Number
Average Value
Number
Average Value
Number
Average Value
Number
Average Value
LOANS ORIGINATED
0
$0
4
$151,848
2
$108,530
13
$12,768
APPLICATIONS APPROVED, NOT ACCEPTED
0
$0
5
$124,762
0
$0
0
$0
APPLICATIONS DENIED
0
$0
4
$36,935
5
$100,684
4
$15,960
APPLICATIONS WITHDRAWN
2
$155,950
0
$0
2
$207,935
0
$0
FILES CLOSED FOR INCOMPLETENESS
0
$0
0
$0
0
$0
0
$0
Aggregated Statistics For Year 1999 (Based on 1 partial tract)
B) Conventional Home Purchase Loans
C) Refinancings
D) Home Improvement Loans
F) Non-occupant Loans on < 5 Family Dwellings (A B C & D)

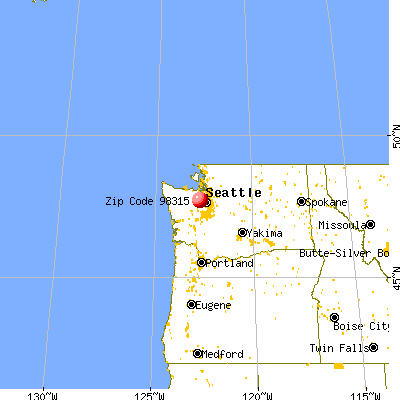


 Nearest zip codes: 98383, 98370, 98345, 98311, 98392, 98312.


 : $391,427,301 in 2912 contracts from 1999 to 2006