Averages for the 2020 tax year for zip code 95968, filed in 2021:
Average Adjusted Gross Income (AGI) in 2020: $45,812 (Individual Income Tax Returns)
Here:
$45,812
State:
$95,910
Salary/wage: $40,638 (reported on 79.0% of returns)
Here:
$40,638
State:
$77,331
(% of AGI for various income ranges: 1225.3% for AGIs below $25k, 3817.4% for AGIs $25k-50k, 5467.0% for AGIs $50k-75k, 8747.5% for AGIs $75k-100k, 24870.0% for AGIs $100k-200k)
Taxable interest for individuals: $318 (reported on 21.0% of returns)
This zip code:
$318
California:
$2,294
(% of AGI for various income ranges: 2.1% for AGIs below $25k, 8.4% for AGIs $25k-50k, 15.0% for AGIs $50k-75k, 7.5% for AGIs $75k-100k, 53.3% for AGIs $100k-200k)
Ordinary dividends: $1,200 (reported on 4.9% of returns)
Here:
$1,200
State:
$10,949
(% of AGI for various income ranges: 25.3% for AGIs $25k-50k)
Net capital gain/loss in AGI: +$5,440 (reported on 6.2% of returns)
Here:
+$5,440
State:
+$49,306
(% of AGI for various income ranges: 272.0% for AGIs $50k-75k)
Profit/loss from business: +$9,244 (reported on 11.1% of returns)
Here:
+$9,244
State:
+$15,671
(% of AGI for various income ranges: 191.1% for AGIs below $25k, 469.0% for AGIs $50k-75k)
Taxable individual retirement arrangement distribution: $13,167 (reported on 3.7% of returns)
95968:
$13,167
California:
$23,505
(% of AGI for various income ranges: 207.9% for AGIs $25k-50k)
Earned income credit: $2,335 (reported on 24.7% of returns)
Here:
$2,335
State:
$2,074
(% of AGI for various income ranges: 141.1% for AGIs below $25k, 104.7% for AGIs $25k-50k)
Percentage of individuals using paid preparers for their 2020 taxes: 97.5%
Here:
98%
State:
92%
(% for various income ranges: 96.4% for AGIs below $25k, 96.3% for AGIs $25k-50k, 100.0% for AGIs $50k-75k, 100.0% for AGIs $75k-100k, 100.0% for AGIs $100k-200k)
Averages for the 2012 tax year for zip code 95968, filed in 2013:
Average Adjusted Gross Income (AGI) in 2012: $33,515 (Individual Income Tax Returns)
Here:
$33,515
State:
$72,726
Salary/wage: $30,816 (reported on 81.0% of returns)
Here:
$30,816
State:
$59,079
(% of AGI for various income ranges: 73.8% for AGIs below $25k, 74.1% for AGIs $25k-50k, 73.6% for AGIs $50k-75k, 73.8% for AGIs $75k-100k, 79.4% for AGIs $100k-200k)
Taxable interest for individuals: $435 (reported on 21.5% of returns)
This zip code:
$435
California:
$2,146
(% of AGI for various income ranges: 0.7% for AGIs below $25k, 0.1% for AGIs $25k-50k, 0.2% for AGIs $50k-75k, 0.3% for AGIs $75k-100k)
Ordinary dividends: $1,025 (reported on 5.1% of returns)
Here:
$1,025
State:
$9,308
Profit/loss from business: +$6,038 (reported on 10.1% of returns)
Here:
+$6,038
State:
+$17,064
(% of AGI for various income ranges: 3.4% for AGIs below $25k, 3.8% for AGIs $25k-50k)
Taxable individual retirement arrangement distribution: $7,550 (reported on 5.1% of returns)
95968:
$7,550
California:
$19,557
Total itemized deductions: $18,936 (30% of AGI, reported on 17.7% of returns)
Here:
$18,936
State:
$34,004
Here:
30.3% of AGI
State:
22.7% of AGI
(% of AGI for various income ranges: 6.3% for AGIs below $25k, 6.5% for AGIs $25k-50k, 11.0% for AGIs $50k-75k, 13.0% for AGIs $75k-100k, 20.0% for AGIs $100k-200k)
Charity contributions: $1,620 (reported on 12.7% of returns)
Here:
$1,620
State:
$4,659
(% of AGI for various income ranges: 0.7% for AGIs below $25k, 0.9% for AGIs $50k-75k, 1.6% for AGIs $75k-100k)
Taxes paid: $4,579 (reported on 17.7% of returns)
95968:
$4,579
State:
$14,448
(% of AGI for various income ranges: 0.9% for AGIs below $25k, 1.1% for AGIs $25k-50k, 2.5% for AGIs $50k-75k, 3.9% for AGIs $75k-100k, 6.4% for AGIs $100k-200k)
Earned income credit: $2,240 (reported on 31.6% of returns)
Here:
$2,240
State:
$2,286
(% of AGI for various income ranges: 7.7% for AGIs below $25k, 1.9% for AGIs $25k-50k)
Percentage of individuals using paid preparers for their 2012 taxes: 69.6%
Here:
70%
State:
64%
(% for various income ranges: 68.4% for AGIs below $25k, 73.9% for AGIs $25k-50k, 70.0% for AGIs $50k-75k, 100.0% for AGIs $75k-100k)
Averages for the 2004 tax year for zip code 95968, filed in 2005:
Average Adjusted Gross Income (AGI) in 2004: $28,559 (Individual Income Tax Returns)
Here:
$28,559
State:
$58,600
Salary/wage: $25,050 (reported on 85.2% of returns)
Here:
$25,050
State:
$49,455
(% of AGI for various income ranges: 85.0% for AGIs below $10k, 73.0% for AGIs $10k-25k, 79.1% for AGIs $25k-50k, 80.6% for AGIs $50k-75k, 83.4% for AGIs $75k-100k, 44.4% for AGIs over 100k)
Taxable interest for individuals: $852 (reported on 29.7% of returns)
This zip code:
$852
California:
$2,365
(% of AGI for various income ranges: 2.3% for AGIs below $10k, 1.2% for AGIs $10k-25k, 0.7% for AGIs $25k-50k, 0.6% for AGIs $50k-75k, 0.2% for AGIs $75k-100k, 1.5% for AGIs over 100k)
Taxable dividends: $1,333 (reported on 7.7% of returns)
Here:
$1,333
State:
$4,746
Net capital gain/loss: +$10,581 (reported on 7.2% of returns)
Here:
+$10,581
State:
+$23,418
(% of AGI for various income ranges: 1.1% for AGIs $10k-25k, 0.7% for AGIs $25k-50k, -0.2% for AGIs $50k-75k, 19.9% for AGIs over 100k)
Profit/loss from business: +$5,067 (reported on 12.1% of returns)
Here:
+$5,067
State:
+$16,826
(% of AGI for various income ranges: 7.8% for AGIs below $10k, 3.1% for AGIs $10k-25k, 1.3% for AGIs $25k-50k, -0.2% for AGIs $50k-75k, 10.3% for AGIs $75k-100k)
Total itemized deductions: $15,638 (29% of AGI, reported on 18.9% of returns)
Here:
$15,638
State:
$28,113
Here:
28.5% of AGI
State:
25.3% of AGI
(% of AGI for various income ranges: 5.7% for AGIs $10k-25k, 9.5% for AGIs $25k-50k, 13.9% for AGIs $50k-75k, 13.2% for AGIs $75k-100k, 16.6% for AGIs over 100k)
Charity contributions deductions: $1,644 (3% of AGI, reported on 15.7% of returns)
Here:
$1,644
State:
$3,923
Here:
3.0% of AGI
State:
3.3% of AGI
(% of AGI for various income ranges: 0.7% for AGIs $10k-25k, 0.7% for AGIs $25k-50k, 1.3% for AGIs $50k-75k, 0.7% for AGIs $75k-100k, 1.5% for AGIs over 100k)
Total tax: $2,948 (reported on 62.4% of returns)
95968:
$2,948
State:
$10,761
(% of AGI for various income ranges: 2.1% for AGIs below $10k, 2.8% for AGIs $10k-25k, 5.2% for AGIs $25k-50k, 7.9% for AGIs $50k-75k, 10.3% for AGIs $75k-100k, 13.3% for AGIs over 100k)
Earned income credit: $1,727 (reported on 29.4% of returns)
Here:
$1,727
State:
$1,763
Percentage of individuals using paid preparers for their 2004 taxes: 68.4%
Here:
68%
State:
66%
(% for various income ranges: 58.4% for AGIs below $10k, 66.7% for AGIs $10k-25k, 74.4% for AGIs $25k-50k, 71.3% for AGIs $50k-75k, 95.5% for AGIs $75k-100k, 72.7% for AGIs over 100k)
Household received Food Stamps/SNAP in the past 12 months: 144 Household did not receive Food Stamps/SNAP in the past 12 months: 418
Women who had a birth in the past 12 months: 28 (0 now married, 29 unmarried) Women who did not have a birth in the past 12 months: 214 (173 now married, 37 unmarried)
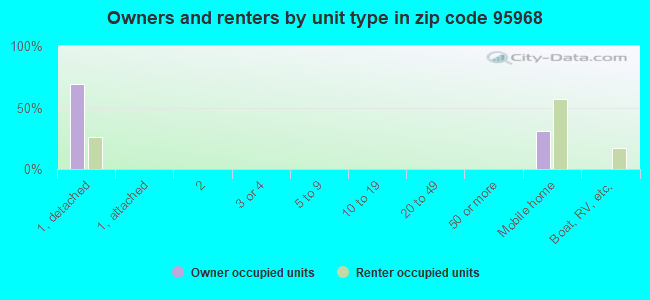
Housing units in zip code 95968 with a mortgage: 85 (1 second mortgage, 1 both second mortgage and home equity loan) Median monthly owner costs for units with a mortgage: $1,328 Median monthly owner costs for units without a mortgage: $402
Residents with income below the poverty level in 2022:
This zip code:
12.7%
Whole state:
12.2%
Residents with income below 50% of the poverty level in 2022:
This zip code:
8.7%
Whole state:
6.2%
Median number of rooms in houses and condos:
Here:
5.1
State:
6.0
Median number of rooms in apartments:
Here:
4.4
State:
3.9
Notable locations in this zip code not listed on our city pages
Size of family households: 243 2-persons, 86 3-persons, 52 4-persons, 34 5-persons
Size of nonfamily households: 113 1-person, 15 2-persons, 2 4-persons
154 married couples with children.
47 single-parent households (33 men, 14 women).
72.1% of residents of 95968 zip code speak English at home.
15.0% of residents speak Spanish at home (43% very well, 31% well, 18% not well, 8% not at all).
0.1% of residents speak other Indo-European language at home (100% very well).
1.6% of residents speak Asian or Pacific Island language at home (43% well, 57% not well).
11.2% of residents speak other language at home (100% very well).
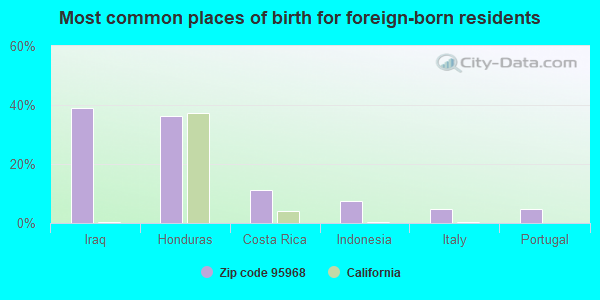
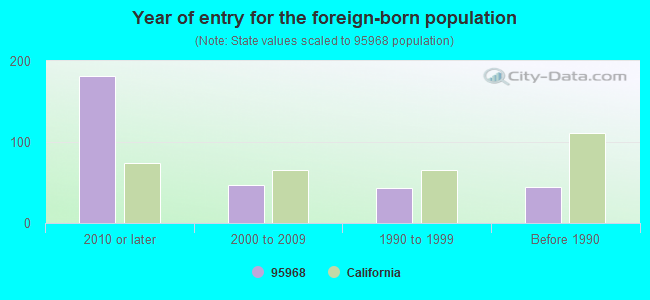
Foreign born population: 295 (21.8%) (28.3% of them are naturalized citizens)
This zip code:
21.8%
Whole state:
26.7%
39%Iraq
36%Honduras
11%Costa Rica
7%Indonesia
5%Italy
5%Portugal
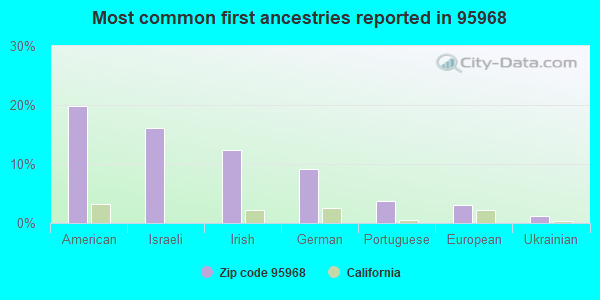
20%American
16%Israeli
12%Irish
9%German
4%Portuguese
3%European
1%Ukrainian
Year of entry for the foreign-born population
1822010 or later
472000 to 2009
431990 to 1999
44Before 1990
Facilities with environmental interests located in this zip code:
HONCUT ELEMENTARY (PALERMO HONCUT HWY. & SCHOOL S in PALERMO, CA)
(National Center for Education Statistics) - STATE ID-6089080 Organizations: PALERMO UNION ELEMENTARY (SCHOOL DISTRICT)
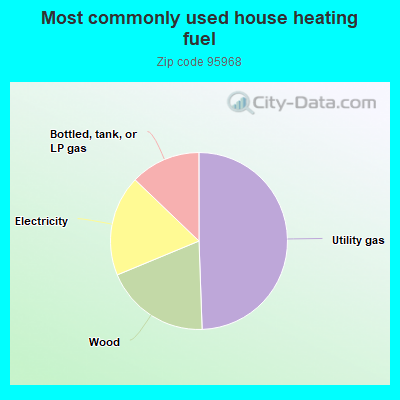
49.7%Utility gas
19.4%Wood
18.5%Electricity
12.9%Bottled, tank, or LP gas
Population in 1990: 1,843.
Place of birth for U.S.-born residents:
This state: 1,015
Northeast: 3
Midwest: 25
South: 6
West: 11
60% of the 95968 zip code residents lived in the same house 5 years ago. Out of people who lived in different houses, 79% lived in this county. Out of people who lived in different counties, 50% lived in California.
99% of the 95968 zip code residents lived in the same house 1 year ago. Out of people who lived in different houses, 138% moved from this county.
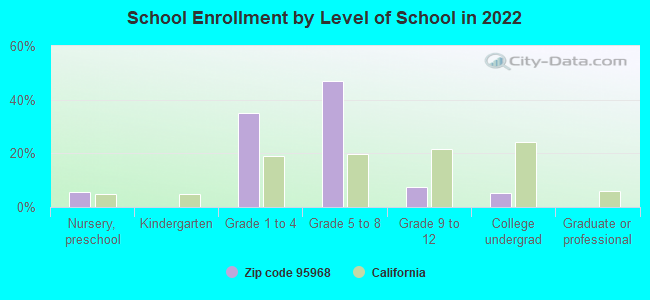
Private vs. public school enrollment:
Students in private schools in grades 1 to 8 (elementary and middle school):
Here:
0.0%
California:
10.5%
Students in private schools in grades 9 to 12 (high school): 2
Here:
11.9%
California:
8.5%
Students in private undergraduate colleges:
Here:
0.0%
California:
15.9%
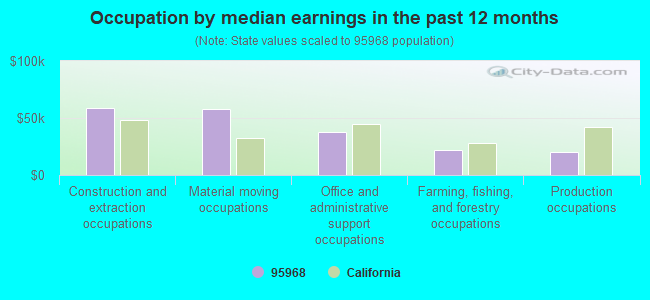
Occupation by median earnings in the past 12 months ($)
58,543Construction and extraction occupations
57,778Material moving occupations
38,099Office and administrative support occupations
21,662Farming, fishing, and forestry occupations
20,054Production occupations
Top industries in this zip code by the number of employees in 2005:
Construction: Water and Sewer Line and Related Structures Construction (1-4 employees: 1 establishment)
Accommodation and Food Services: Limited-Service Restaurants (1-4: 1)
Administrative and Support and Waste Management and Remediation Services: Landscaping Services (1-4: 1)
Other Services (except Public Administration): Political Organizations (1-4: 1)
Accommodation and Food Services: Full-Service Restaurants (1-4: 1)
Real Estate and Rental and Leasing: Lessors of Other Real Estate Property (1-4: 1)
People in group quarters in 2000:
8 people in other group homes
6 people in homes for the mentally retarded
Fatal accident statistics in 2010:
Fatal accident count: 1
Vehicles involved in fatal accidents: 2
Fatal accidents caused by drunken drivers: 0
Fatalities: 1
Persons involved in fatal accidents: 2
Pedestrians involved in fatal accidents: 0
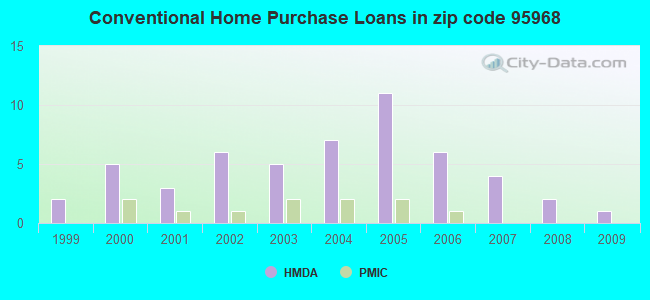
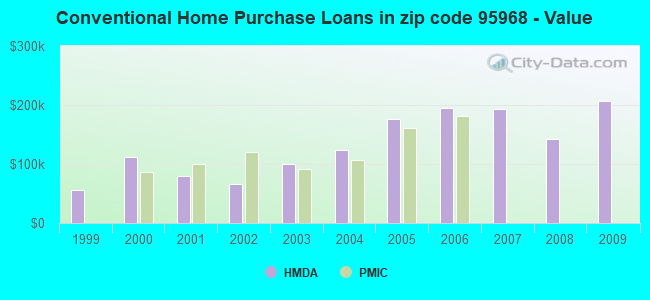
Home Mortgage Disclosure Act Aggregated Statistics For Year 2009 (Based on 2 partial tracts)
A) FHA, FSA/RHS & VA Home Purchase Loans
B) Conventional Home Purchase Loans
C) Refinancings
D) Home Improvement Loans
F) Non-occupant Loans on < 5 Family Dwellings (A B C & D)
G) Loans On Manufactured Home Dwelling (A B C & D)
Number
Average Value
Number
Average Value
Number
Average Value
Number
Average Value
Number
Average Value
Number
Average Value
LOANS ORIGINATED
2
$153,725
1
$207,360
5
$189,844
0
$0
0
$0
3
$131,873
APPLICATIONS APPROVED, NOT ACCEPTED
0
$0
0
$0
0
$0
0
$0
0
$0
0
$0
APPLICATIONS DENIED
1
$85,330
1
$39,730
7
$181,064
1
$23,840
1
$157,600
2
$163,845
APPLICATIONS WITHDRAWN
1
$152,310
0
$0
2
$222,880
0
$0
0
$0
1
$166,870
FILES CLOSED FOR INCOMPLETENESS
0
$0
0
$0
0
$0
0
$0
0
$0
0
$0
Aggregated Statistics For Year 2008 (Based on 2 partial tracts)
A) FHA, FSA/RHS & VA Home Purchase Loans
B) Conventional Home Purchase Loans
C) Refinancings
D) Home Improvement Loans
F) Non-occupant Loans on < 5 Family Dwellings (A B C & D)
G) Loans On Manufactured Home Dwelling (A B C & D)
Number
Average Value
Number
Average Value
Number
Average Value
Number
Average Value
Number
Average Value
Number
Average Value
LOANS ORIGINATED
1
$140,950
2
$142,375
4
$150,888
0
$0
1
$79,840
2
$98,855
APPLICATIONS APPROVED, NOT ACCEPTED
0
$0
0
$0
1
$204,150
0
$0
1
$87,790
1
$86,280
APPLICATIONS DENIED
1
$123,170
1
$86,460
6
$213,543
2
$91,855
0
$0
2
$157,605
APPLICATIONS WITHDRAWN
0
$0
0
$0
4
$155,475
1
$82,870
0
$0
2
$73,790
FILES CLOSED FOR INCOMPLETENESS
0
$0
0
$0
1
$165,930
0
$0
0
$0
0
$0
Aggregated Statistics For Year 2007 (Based on 2 partial tracts)
B) Conventional Home Purchase Loans
C) Refinancings
D) Home Improvement Loans
F) Non-occupant Loans on < 5 Family Dwellings (A B C & D)
G) Loans On Manufactured Home Dwelling (A B C & D)
Number
Average Value
Number
Average Value
Number
Average Value
Number
Average Value
Number
Average Value
LOANS ORIGINATED
4
$193,835
16
$180,568
3
$105,007
2
$144,550
7
$132,007
APPLICATIONS APPROVED, NOT ACCEPTED
1
$190,520
3
$162,963
1
$44,270
1
$87,790
1
$180,120
APPLICATIONS DENIED
3
$149,910
16
$177,174
3
$79,780
2
$175,010
4
$139,205
APPLICATIONS WITHDRAWN
1
$124,870
7
$154,036
1
$145,870
0
$0
2
$130,265
FILES CLOSED FOR INCOMPLETENESS
1
$73,030
3
$259,140
1
$97,060
0
$0
1
$100,090
Aggregated Statistics For Year 2006 (Based on 2 partial tracts)
B) Conventional Home Purchase Loans
C) Refinancings
D) Home Improvement Loans
F) Non-occupant Loans on < 5 Family Dwellings (A B C & D)
G) Loans On Manufactured Home Dwelling (A B C & D)
Number
Average Value
Number
Average Value
Number
Average Value
Number
Average Value
Number
Average Value
LOANS ORIGINATED
6
$194,845
19
$177,738
5
$90,286
2
$235,175
7
$150,981
APPLICATIONS APPROVED, NOT ACCEPTED
2
$228,835
4
$220,040
1
$39,540
1
$339,800
2
$98,950
APPLICATIONS DENIED
3
$204,527
19
$178,684
5
$90,172
2
$209,730
5
$135,884
APPLICATIONS WITHDRAWN
3
$180,497
11
$163,847
1
$61,300
1
$220,990
2
$122,225
FILES CLOSED FOR INCOMPLETENESS
0
$0
2
$145,875
1
$113,900
0
$0
1
$64,140
Aggregated Statistics For Year 2005 (Based on 2 partial tracts)
A) FHA, FSA/RHS & VA Home Purchase Loans
B) Conventional Home Purchase Loans
C) Refinancings
D) Home Improvement Loans
F) Non-occupant Loans on < 5 Family Dwellings (A B C & D)
G) Loans On Manufactured Home Dwelling (A B C & D)
Number
Average Value
Number
Average Value
Number
Average Value
Number
Average Value
Number
Average Value
Number
Average Value
LOANS ORIGINATED
1
$173,310
11
$176,713
24
$153,930
5
$84,458
3
$152,370
8
$149,042
APPLICATIONS APPROVED, NOT ACCEPTED
0
$0
3
$145,810
5
$152,306
1
$76,440
2
$141,710
2
$132,535
APPLICATIONS DENIED
0
$0
8
$167,016
19
$159,157
5
$82,984
2
$177,470
7
$130,900
APPLICATIONS WITHDRAWN
0
$0
3
$157,477
17
$148,511
2
$77,475
2
$206,700
4
$123,028
FILES CLOSED FOR INCOMPLETENESS
0
$0
0
$0
2
$185,985
0
$0
0
$0
1
$65,270
Aggregated Statistics For Year 2004 (Based on 2 partial tracts)
B) Conventional Home Purchase Loans
C) Refinancings
D) Home Improvement Loans
F) Non-occupant Loans on < 5 Family Dwellings (A B C & D)
G) Loans On Manufactured Home Dwelling (A B C & D)
Number
Average Value
Number
Average Value
Number
Average Value
Number
Average Value
Number
Average Value
LOANS ORIGINATED
7
$124,304
16
$118,901
3
$76,120
2
$128,185
5
$119,840
APPLICATIONS APPROVED, NOT ACCEPTED
2
$54,110
4
$115,600
0
$0
1
$54,490
2
$100,275
APPLICATIONS DENIED
4
$130,643
13
$125,731
4
$62,482
2
$126,195
3
$130,423
APPLICATIONS WITHDRAWN
1
$147,770
7
$120,114
1
$151,550
0
$0
1
$126,390
FILES CLOSED FOR INCOMPLETENESS
0
$0
5
$119,310
0
$0
0
$0
1
$57,330
Aggregated Statistics For Year 2003 (Based on 2 partial tracts)
B) Conventional Home Purchase Loans
C) Refinancings
D) Home Improvement Loans
F) Non-occupant Loans on < 5 Family Dwellings (A B C & D)
Number
Average Value
Number
Average Value
Number
Average Value
Number
Average Value
LOANS ORIGINATED
5
$100,616
22
$98,057
1
$15,890
2
$115,600
APPLICATIONS APPROVED, NOT ACCEPTED
3
$66,913
5
$85,404
0
$0
0
$0
APPLICATIONS DENIED
2
$86,560
16
$94,896
1
$3,970
1
$91,760
APPLICATIONS WITHDRAWN
1
$136,220
10
$104,249
1
$48,620
1
$78,710
FILES CLOSED FOR INCOMPLETENESS
0
$0
2
$102,640
0
$0
0
$0
Aggregated Statistics For Year 2002 (Based on 2 partial tracts)
A) FHA, FSA/RHS & VA Home Purchase Loans
B) Conventional Home Purchase Loans
C) Refinancings
D) Home Improvement Loans
F) Non-occupant Loans on < 5 Family Dwellings (A B C & D)
Number
Average Value
Number
Average Value
Number
Average Value
Number
Average Value
Number
Average Value
LOANS ORIGINATED
1
$65,270
6
$65,905
13
$97,263
1
$32,160
1
$66,030
APPLICATIONS APPROVED, NOT ACCEPTED
0
$0
1
$92,710
3
$74,670
0
$0
0
$0
APPLICATIONS DENIED
0
$0
3
$84,573
9
$73,410
1
$14,380
0
$0
APPLICATIONS WITHDRAWN
0
$0
1
$43,330
5
$98,270
1
$22,140
0
$0
FILES CLOSED FOR INCOMPLETENESS
0
$0
0
$0
1
$45,410
0
$0
0
$0
Aggregated Statistics For Year 2001 (Based on 2 partial tracts)
A) FHA, FSA/RHS & VA Home Purchase Loans
B) Conventional Home Purchase Loans
C) Refinancings
D) Home Improvement Loans
F) Non-occupant Loans on < 5 Family Dwellings (A B C & D)
Number
Average Value
Number
Average Value
Number
Average Value
Number
Average Value
Number
Average Value
LOANS ORIGINATED
1
$78,140
3
$80,283
10
$91,308
0
$0
2
$75,395
APPLICATIONS APPROVED, NOT ACCEPTED
0
$0
1
$66,220
1
$63,380
0
$0
0
$0
APPLICATIONS DENIED
0
$0
2
$53,920
7
$85,627
1
$11,730
1
$54,870
APPLICATIONS WITHDRAWN
0
$0
0
$0
3
$75,997
1
$11,540
0
$0
FILES CLOSED FOR INCOMPLETENESS
0
$0
0
$0
2
$57,610
0
$0
0
$0
Aggregated Statistics For Year 2000 (Based on 2 partial tracts)
A) FHA, FSA/RHS & VA Home Purchase Loans
B) Conventional Home Purchase Loans
C) Refinancings
D) Home Improvement Loans
F) Non-occupant Loans on < 5 Family Dwellings (A B C & D)
Number
Average Value
Number
Average Value
Number
Average Value
Number
Average Value
Number
Average Value
LOANS ORIGINATED
1
$62,250
5
$111,364
5
$64,290
1
$20,620
1
$37,460
APPLICATIONS APPROVED, NOT ACCEPTED
0
$0
1
$131,490
1
$60,350
1
$16,270
0
$0
APPLICATIONS DENIED
0
$0
4
$97,060
7
$62,896
2
$25,070
0
$0
APPLICATIONS WITHDRAWN
0
$0
0
$0
3
$70,447
0
$0
0
$0
FILES CLOSED FOR INCOMPLETENESS
0
$0
0
$0
1
$45,030
0
$0
0
$0
Aggregated Statistics For Year 1999 (Based on 1 partial tract)
Detailed PMIC statistics for the following Tracts:0032.00
2003 - 2018 National Fire Incident Reporting System (NFIRS) incidents
According to the data from the years 2003 - 2018 the average number of fires per year is 20. The highest number of reported fires - 42 took place in 2007, and the least - 1 in 2004. The data has a decreasing trend.
When looking into fire subcategories, the most reports belonged to: Outside Fires (60.6%), and Structure Fires (21.4%).
Fire incident types reported to NFIRS in Zip Code 95968

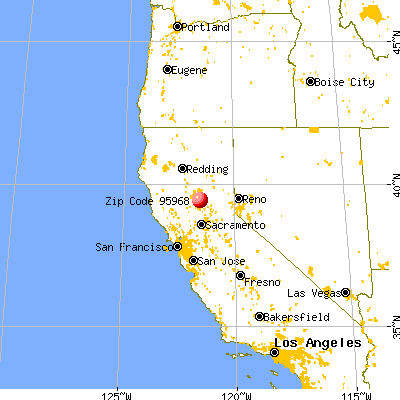


 Nearest zip codes: 95966, 95965, 95917, 95901, 95914, 95948.


 According to the data from the years 2003 - 2018 the average number of fires per year is 20. The highest number of reported fires - 42 took place in 2007, and the least - 1 in 2004. The data has a decreasing trend.
 When looking into fire subcategories, the most reports belonged to: Outside Fires (60.6%), and Structure Fires (21.4%).