Estimated zip code population in 2022: 24,216
Zip code population in 2010: 23,057
Zip code population in 2000: 21,850
Houses and condos: 9,724
Renter-occupied apartments: 2,437
% of renters here:
26%State:
44%
March 2022 cost of living index in zip code 92119: 122.2
(high, U.S. average is 100)
Land area: 6.8
sq. mi.
Water area: 0.3
sq. mi.
Population density: 3,537 people per square mile (average).
OSM Map
General Map
Google Map
MSN Map
OSM Map
General Map
Google Map
MSN Map
OSM Map
General Map
Google Map
MSN Map
OSM Map
General Map
Google Map
MSN Map
Please wait while loading the map...
Real estate property taxes paid for housing units in 2022:
This zip code:
0.6% ($4,461)California:
0.7% ($4,831)
Median real estate property taxes paid for housing units with mortgages in 2022: $5,742 (0.7%)
Median real estate property taxes paid for housing units with no mortgage in 2022: $1,957 (0.2%)
Profiles of local businesses
Business Search - 14 Million verified businesses
Males: 11,119 Females: 13,097
For population 25 years and over in 92119:
High school or higher: 95.8%Bachelor's degree or higher: 56.2%Graduate or professional degree: 23.7%Unemployed: 5.0%Mean travel time to work (commute): 25.5 minutes
For population 15 years and over in 92119:
Never married: 28.7%Now married: 52.0%Separated: 1.9%Widowed: 6.0%Divorced: 11.4%
Zip code 92119 compared to state average:
Hispanic race population percentage below state average. Median age above state average. Foreign-born population percentage significantly below state average. Renting percentage below state average. Length of stay since moving in significantly above state average. Percentage of population with a bachelor's degree or higher above state average. 15,455 63.8% White 4,102 16.9% Hispanic or Latino 2,106 8.7% Asian 1,432 5.9% Two or more races 852 3.5% Black 194 0.8% Some other race 57 0.2% Native Hawaiian and Other 14 0.06% American Indian
Data:
Median household income ($)
Median household income (% change since 2000)
Household income diversity
Ratio of average income to average house value (%)
Ratio of average income to average rent
Median household income ($) - White
Median household income ($) - Black or African American
Median household income ($) - Asian
Median household income ($) - Hispanic or Latino
Median household income ($) - American Indian and Alaska Native
Median household income ($) - Multirace
Median household income ($) - Other Race
Median household income for houses/condos with a mortgage ($)
Median household income for apartments without a mortgage ($)
Races - White alone (%)
Races - White alone (% change since 2000)
Races - Black alone (%)
Races - Black alone (% change since 2000)
Races - American Indian alone (%)
Races - American Indian alone (% change since 2000)
Races - Asian alone (%)
Races - Asian alone (% change since 2000)
Races - Hispanic (%)
Races - Hispanic (% change since 2000)
Races - Native Hawaiian and Other Pacific Islander alone (%)
Races - Native Hawaiian and Other Pacific Islander alone (% change since 2000)
Races - Two or more races (%)
Races - Two or more races (% change since 2000)
Races - Other race alone (%)
Races - Other race alone (% change since 2000)
Racial diversity
Unemployment (%)
Unemployment (% change since 2000)
Unemployment (%) - White
Unemployment (%) - Black or African American
Unemployment (%) - Asian
Unemployment (%) - Hispanic or Latino
Unemployment (%) - American Indian and Alaska Native
Unemployment (%) - Multirace
Unemployment (%) - Other Race
Population density (people per square mile)
Population - Males (%)
Population - Females (%)
Population - Males (%) - White
Population - Males (%) - Black or African American
Population - Males (%) - Asian
Population - Males (%) - Hispanic or Latino
Population - Males (%) - American Indian and Alaska Native
Population - Males (%) - Multirace
Population - Males (%) - Other Race
Population - Females (%) - White
Population - Females (%) - Black or African American
Population - Females (%) - Asian
Population - Females (%) - Hispanic or Latino
Population - Females (%) - American Indian and Alaska Native
Population - Females (%) - Multirace
Population - Females (%) - Other Race
Coronavirus confirmed cases (Jun 03, 2024)
Deaths caused by coronavirus (Jun 03, 2024)
Coronavirus confirmed cases (per 100k population) (Jun 03, 2024)
Deaths caused by coronavirus (per 100k population) (Jun 03, 2024)
Daily increase in number of cases (Jun 03, 2024)
Weekly increase in number of cases (Jun 03, 2024)
Cases doubled (in days) (Jun 03, 2024)
Hospitalized patients (Apr 18, 2022)
Negative test results (Apr 18, 2022)
Total test results (Apr 18, 2022)
COVID Vaccine doses distributed (per 100k population) (Sep 19, 2023)
COVID Vaccine doses administered (per 100k population) (Sep 19, 2023)
COVID Vaccine doses distributed (Sep 19, 2023)
COVID Vaccine doses administered (Sep 19, 2023)
Likely homosexual households (%)
Likely homosexual households (% change since 2000)
Likely homosexual households - Lesbian couples (%)
Likely homosexual households - Lesbian couples (% change since 2000)
Likely homosexual households - Gay men (%)
Likely homosexual households - Gay men (% change since 2000)
Cost of living index
Median gross rent ($)
Median contract rent ($)
Median monthly housing costs ($)
Median house or condo value ($)
Median house or condo value ($ change since 2000)
Mean house or condo value by units in structure - 1, detached ($)
Mean house or condo value by units in structure - 1, attached ($)
Mean house or condo value by units in structure - 2 ($)
Mean house or condo value by units in structure by units in structure - 3 or 4 ($)
Mean house or condo value by units in structure - 5 or more ($)
Mean house or condo value by units in structure - Boat, RV, van, etc. ($)
Mean house or condo value by units in structure - Mobile home ($)
Median house or condo value ($) - White
Median house or condo value ($) - Black or African American
Median house or condo value ($) - Asian
Median house or condo value ($) - Hispanic or Latino
Median house or condo value ($) - American Indian and Alaska Native
Median house or condo value ($) - Multirace
Median house or condo value ($) - Other Race
Median resident age
Resident age diversity
Median resident age - Males
Median resident age - Females
Median resident age - White
Median resident age - Black or African American
Median resident age - Asian
Median resident age - Hispanic or Latino
Median resident age - American Indian and Alaska Native
Median resident age - Multirace
Median resident age - Other Race
Median resident age - Males - White
Median resident age - Males - Black or African American
Median resident age - Males - Asian
Median resident age - Males - Hispanic or Latino
Median resident age - Males - American Indian and Alaska Native
Median resident age - Males - Multirace
Median resident age - Males - Other Race
Median resident age - Females - White
Median resident age - Females - Black or African American
Median resident age - Females - Asian
Median resident age - Females - Hispanic or Latino
Median resident age - Females - American Indian and Alaska Native
Median resident age - Females - Multirace
Median resident age - Females - Other Race
Commute - mean travel time to work (minutes)
Travel time to work - Less than 5 minutes (%)
Travel time to work - Less than 5 minutes (% change since 2000)
Travel time to work - 5 to 9 minutes (%)
Travel time to work - 5 to 9 minutes (% change since 2000)
Travel time to work - 10 to 19 minutes (%)
Travel time to work - 10 to 19 minutes (% change since 2000)
Travel time to work - 20 to 29 minutes (%)
Travel time to work - 20 to 29 minutes (% change since 2000)
Travel time to work - 30 to 39 minutes (%)
Travel time to work - 30 to 39 minutes (% change since 2000)
Travel time to work - 40 to 59 minutes (%)
Travel time to work - 40 to 59 minutes (% change since 2000)
Travel time to work - 60 to 89 minutes (%)
Travel time to work - 60 to 89 minutes (% change since 2000)
Travel time to work - 90 or more minutes (%)
Travel time to work - 90 or more minutes (% change since 2000)
Marital status - Never married (%)
Marital status - Now married (%)
Marital status - Separated (%)
Marital status - Widowed (%)
Marital status - Divorced (%)
Median family income ($)
Median family income (% change since 2000)
Median non-family income ($)
Median non-family income (% change since 2000)
Median per capita income ($)
Median per capita income (% change since 2000)
Median family income ($) - White
Median family income ($) - Black or African American
Median family income ($) - Asian
Median family income ($) - Hispanic or Latino
Median family income ($) - American Indian and Alaska Native
Median family income ($) - Multirace
Median family income ($) - Other Race
Median year house/condo built
Median year apartment built
Year house built - Built 2005 or later (%)
Year house built - Built 2000 to 2004 (%)
Year house built - Built 1990 to 1999 (%)
Year house built - Built 1980 to 1989 (%)
Year house built - Built 1970 to 1979 (%)
Year house built - Built 1960 to 1969 (%)
Year house built - Built 1950 to 1959 (%)
Year house built - Built 1940 to 1949 (%)
Year house built - Built 1939 or earlier (%)
Average household size
Household density (households per square mile)
Average household size - White
Average household size - Black or African American
Average household size - Asian
Average household size - Hispanic or Latino
Average household size - American Indian and Alaska Native
Average household size - Multirace
Average household size - Other Race
Occupied housing units (%)
Vacant housing units (%)
Owner occupied housing units (%)
Renter occupied housing units (%)
Vacancy status - For rent (%)
Vacancy status - For sale only (%)
Vacancy status - Rented or sold, not occupied (%)
Vacancy status - For seasonal, recreational, or occasional use (%)
Vacancy status - For migrant workers (%)
Vacancy status - Other vacant (%)
Residents with income below the poverty level (%)
Residents with income below 50% of the poverty level (%)
Children below poverty level (%)
Poor families by family type - Married-couple family (%)
Poor families by family type - Male, no wife present (%)
Poor families by family type - Female, no husband present (%)
Poverty status for native-born residents (%)
Poverty status for foreign-born residents (%)
Poverty among high school graduates not in families (%)
Poverty among people who did not graduate high school not in families (%)
Residents with income below the poverty level (%) - White
Residents with income below the poverty level (%) - Black or African American
Residents with income below the poverty level (%) - Asian
Residents with income below the poverty level (%) - Hispanic or Latino
Residents with income below the poverty level (%) - American Indian and Alaska Native
Residents with income below the poverty level (%) - Multirace
Residents with income below the poverty level (%) - Other Race
Air pollution - Air Quality Index (AQI)
Air pollution - CO
Air pollution - NO2
Air pollution - SO2
Air pollution - Ozone
Air pollution - PM10
Air pollution - PM25
Air pollution - Pb
Crime - Murders per 100,000 population
Crime - Rapes per 100,000 population
Crime - Robberies per 100,000 population
Crime - Assaults per 100,000 population
Crime - Burglaries per 100,000 population
Crime - Thefts per 100,000 population
Crime - Auto thefts per 100,000 population
Crime - Arson per 100,000 population
Crime - City-data.com crime index
Crime - Violent crime index
Crime - Property crime index
Crime - Murders per 100,000 population (5 year average)
Crime - Rapes per 100,000 population (5 year average)
Crime - Robberies per 100,000 population (5 year average)
Crime - Assaults per 100,000 population (5 year average)
Crime - Burglaries per 100,000 population (5 year average)
Crime - Thefts per 100,000 population (5 year average)
Crime - Auto thefts per 100,000 population (5 year average)
Crime - Arson per 100,000 population (5 year average)
Crime - City-data.com crime index (5 year average)
Crime - Violent crime index (5 year average)
Crime - Property crime index (5 year average)
1996 Presidential Elections Results (%) - Democratic Party (Clinton)
1996 Presidential Elections Results (%) - Republican Party (Dole)
1996 Presidential Elections Results (%) - Other
2000 Presidential Elections Results (%) - Democratic Party (Gore)
2000 Presidential Elections Results (%) - Republican Party (Bush)
2000 Presidential Elections Results (%) - Other
2004 Presidential Elections Results (%) - Democratic Party (Kerry)
2004 Presidential Elections Results (%) - Republican Party (Bush)
2004 Presidential Elections Results (%) - Other
2008 Presidential Elections Results (%) - Democratic Party (Obama)
2008 Presidential Elections Results (%) - Republican Party (McCain)
2008 Presidential Elections Results (%) - Other
2012 Presidential Elections Results (%) - Democratic Party (Obama)
2012 Presidential Elections Results (%) - Republican Party (Romney)
2012 Presidential Elections Results (%) - Other
2016 Presidential Elections Results (%) - Democratic Party (Clinton)
2016 Presidential Elections Results (%) - Republican Party (Trump)
2016 Presidential Elections Results (%) - Other
2020 Presidential Elections Results (%) - Democratic Party (Biden)
2020 Presidential Elections Results (%) - Republican Party (Trump)
2020 Presidential Elections Results (%) - Other
Ancestries Reported - Arab (%)
Ancestries Reported - Czech (%)
Ancestries Reported - Danish (%)
Ancestries Reported - Dutch (%)
Ancestries Reported - English (%)
Ancestries Reported - French (%)
Ancestries Reported - French Canadian (%)
Ancestries Reported - German (%)
Ancestries Reported - Greek (%)
Ancestries Reported - Hungarian (%)
Ancestries Reported - Irish (%)
Ancestries Reported - Italian (%)
Ancestries Reported - Lithuanian (%)
Ancestries Reported - Norwegian (%)
Ancestries Reported - Polish (%)
Ancestries Reported - Portuguese (%)
Ancestries Reported - Russian (%)
Ancestries Reported - Scotch-Irish (%)
Ancestries Reported - Scottish (%)
Ancestries Reported - Slovak (%)
Ancestries Reported - Subsaharan African (%)
Ancestries Reported - Swedish (%)
Ancestries Reported - Swiss (%)
Ancestries Reported - Ukrainian (%)
Ancestries Reported - United States (%)
Ancestries Reported - Welsh (%)
Ancestries Reported - West Indian (%)
Ancestries Reported - Other (%)
Educational Attainment - No schooling completed (%)
Educational Attainment - Less than high school (%)
Educational Attainment - High school or equivalent (%)
Educational Attainment - Less than 1 year of college (%)
Educational Attainment - 1 or more years of college (%)
Educational Attainment - Associate degree (%)
Educational Attainment - Bachelor's degree (%)
Educational Attainment - Master's degree (%)
Educational Attainment - Professional school degree (%)
Educational Attainment - Doctorate degree (%)
School Enrollment - Nursery, preschool (%)
School Enrollment - Kindergarten (%)
School Enrollment - Grade 1 to 4 (%)
School Enrollment - Grade 5 to 8 (%)
School Enrollment - Grade 9 to 12 (%)
School Enrollment - College undergrad (%)
School Enrollment - Graduate or professional (%)
School Enrollment - Not enrolled in school (%)
School enrollment - Public schools (%)
School enrollment - Private schools (%)
School enrollment - Not enrolled (%)
Median number of rooms in houses and condos
Median number of rooms in apartments
Housing units lacking complete plumbing facilities (%)
Housing units lacking complete kitchen facilities (%)
Density of houses
Urban houses (%)
Rural houses (%)
Households with people 60 years and over (%)
Households with people 65 years and over (%)
Households with people 75 years and over (%)
Households with one or more nonrelatives (%)
Households with no nonrelatives (%)
Population in households (%)
Family households (%)
Nonfamily households (%)
Population in families (%)
Family households with own children (%)
Median number of bedrooms in owner occupied houses
Mean number of bedrooms in owner occupied houses
Median number of bedrooms in renter occupied houses
Mean number of bedrooms in renter occupied houses
Median number of vehichles in owner occupied houses
Mean number of vehichles in owner occupied houses
Median number of vehichles in renter occupied houses
Mean number of vehichles in renter occupied houses
Mortgage status - with mortgage (%)
Mortgage status - with second mortgage (%)
Mortgage status - with home equity loan (%)
Mortgage status - with both second mortgage and home equity loan (%)
Mortgage status - without a mortgage (%)
Average family size
Average family size - White
Average family size - Black or African American
Average family size - Asian
Average family size - Hispanic or Latino
Average family size - American Indian and Alaska Native
Average family size - Multirace
Average family size - Other Race
Geographical mobility - Same house 1 year ago (%)
Geographical mobility - Moved within same county (%)
Geographical mobility - Moved from different county within same state (%)
Geographical mobility - Moved from different state (%)
Geographical mobility - Moved from abroad (%)
Place of birth - Born in state of residence (%)
Place of birth - Born in other state (%)
Place of birth - Native, outside of US (%)
Place of birth - Foreign born (%)
Housing units in structures - 1, detached (%)
Housing units in structures - 1, attached (%)
Housing units in structures - 2 (%)
Housing units in structures - 3 or 4 (%)
Housing units in structures - 5 to 9 (%)
Housing units in structures - 10 to 19 (%)
Housing units in structures - 20 to 49 (%)
Housing units in structures - 50 or more (%)
Housing units in structures - Mobile home (%)
Housing units in structures - Boat, RV, van, etc. (%)
House/condo owner moved in on average (years ago)
Renter moved in on average (years ago)
Year householder moved into unit - Moved in 1999 to March 2000 (%)
Year householder moved into unit - Moved in 1995 to 1998 (%)
Year householder moved into unit - Moved in 1990 to 1994 (%)
Year householder moved into unit - Moved in 1980 to 1989 (%)
Year householder moved into unit - Moved in 1970 to 1979 (%)
Year householder moved into unit - Moved in 1969 or earlier (%)
Means of transportation to work - Drove car alone (%)
Means of transportation to work - Carpooled (%)
Means of transportation to work - Public transportation (%)
Means of transportation to work - Bus or trolley bus (%)
Means of transportation to work - Streetcar or trolley car (%)
Means of transportation to work - Subway or elevated (%)
Means of transportation to work - Railroad (%)
Means of transportation to work - Ferryboat (%)
Means of transportation to work - Taxicab (%)
Means of transportation to work - Motorcycle (%)
Means of transportation to work - Bicycle (%)
Means of transportation to work - Walked (%)
Means of transportation to work - Other means (%)
Working at home (%)
Industry diversity
Most Common Industries - Agriculture, forestry, fishing and hunting, and mining (%)
Most Common Industries - Agriculture, forestry, fishing and hunting (%)
Most Common Industries - Mining, quarrying, and oil and gas extraction (%)
Most Common Industries - Construction (%)
Most Common Industries - Manufacturing (%)
Most Common Industries - Wholesale trade (%)
Most Common Industries - Retail trade (%)
Most Common Industries - Transportation and warehousing, and utilities (%)
Most Common Industries - Transportation and warehousing (%)
Most Common Industries - Utilities (%)
Most Common Industries - Information (%)
Most Common Industries - Finance and insurance, and real estate and rental and leasing (%)
Most Common Industries - Finance and insurance (%)
Most Common Industries - Real estate and rental and leasing (%)
Most Common Industries - Professional, scientific, and management, and administrative and waste management services (%)
Most Common Industries - Professional, scientific, and technical services (%)
Most Common Industries - Management of companies and enterprises (%)
Most Common Industries - Administrative and support and waste management services (%)
Most Common Industries - Educational services, and health care and social assistance (%)
Most Common Industries - Educational services (%)
Most Common Industries - Health care and social assistance (%)
Most Common Industries - Arts, entertainment, and recreation, and accommodation and food services (%)
Most Common Industries - Arts, entertainment, and recreation (%)
Most Common Industries - Accommodation and food services (%)
Most Common Industries - Other services, except public administration (%)
Most Common Industries - Public administration (%)
Occupation diversity
Most Common Occupations - Management, business, science, and arts occupations (%)
Most Common Occupations - Management, business, and financial occupations (%)
Most Common Occupations - Management occupations (%)
Most Common Occupations - Business and financial operations occupations (%)
Most Common Occupations - Computer, engineering, and science occupations (%)
Most Common Occupations - Computer and mathematical occupations (%)
Most Common Occupations - Architecture and engineering occupations (%)
Most Common Occupations - Life, physical, and social science occupations (%)
Most Common Occupations - Education, legal, community service, arts, and media occupations (%)
Most Common Occupations - Community and social service occupations (%)
Most Common Occupations - Legal occupations (%)
Most Common Occupations - Education, training, and library occupations (%)
Most Common Occupations - Arts, design, entertainment, sports, and media occupations (%)
Most Common Occupations - Healthcare practitioners and technical occupations (%)
Most Common Occupations - Health diagnosing and treating practitioners and other technical occupations (%)
Most Common Occupations - Health technologists and technicians (%)
Most Common Occupations - Service occupations (%)
Most Common Occupations - Healthcare support occupations (%)
Most Common Occupations - Protective service occupations (%)
Most Common Occupations - Fire fighting and prevention, and other protective service workers including supervisors (%)
Most Common Occupations - Law enforcement workers including supervisors (%)
Most Common Occupations - Food preparation and serving related occupations (%)
Most Common Occupations - Building and grounds cleaning and maintenance occupations (%)
Most Common Occupations - Personal care and service occupations (%)
Most Common Occupations - Sales and office occupations (%)
Most Common Occupations - Sales and related occupations (%)
Most Common Occupations - Office and administrative support occupations (%)
Most Common Occupations - Natural resources, construction, and maintenance occupations (%)
Most Common Occupations - Farming, fishing, and forestry occupations (%)
Most Common Occupations - Construction and extraction occupations (%)
Most Common Occupations - Installation, maintenance, and repair occupations (%)
Most Common Occupations - Production, transportation, and material moving occupations (%)
Most Common Occupations - Production occupations (%)
Most Common Occupations - Transportation occupations (%)
Most Common Occupations - Material moving occupations (%)
People in Group quarters - Institutionalized population (%)
People in Group quarters - Correctional institutions (%)
People in Group quarters - Federal prisons and detention centers (%)
People in Group quarters - Halfway houses (%)
People in Group quarters - Local jails and other confinement facilities (including police lockups) (%)
People in Group quarters - Military disciplinary barracks (%)
People in Group quarters - State prisons (%)
People in Group quarters - Other types of correctional institutions (%)
People in Group quarters - Nursing homes (%)
People in Group quarters - Hospitals/wards, hospices, and schools for the handicapped (%)
People in Group quarters - Hospitals/wards and hospices for chronically ill (%)
People in Group quarters - Hospices or homes for chronically ill (%)
People in Group quarters - Military hospitals or wards for chronically ill (%)
People in Group quarters - Other hospitals or wards for chronically ill (%)
People in Group quarters - Hospitals or wards for drug/alcohol abuse (%)
People in Group quarters - Mental (Psychiatric) hospitals or wards (%)
People in Group quarters - Schools, hospitals, or wards for the mentally retarded (%)
People in Group quarters - Schools, hospitals, or wards for the physically handicapped (%)
People in Group quarters - Institutions for the deaf (%)
People in Group quarters - Institutions for the blind (%)
People in Group quarters - Orthopedic wards and institutions for the physically handicapped (%)
People in Group quarters - Wards in general hospitals for patients who have no usual home elsewhere (%)
People in Group quarters - Wards in military hospitals for patients who have no usual home elsewhere (%)
People in Group quarters - Juvenile institutions (%)
People in Group quarters - Long-term care (%)
People in Group quarters - Homes for abused, dependent, and neglected children (%)
People in Group quarters - Residential treatment centers for emotionally disturbed children (%)
People in Group quarters - Training schools for juvenile delinquents (%)
People in Group quarters - Short-term care, detention or diagnostic centers for delinquent children (%)
People in Group quarters - Type of juvenile institution unknown (%)
People in Group quarters - Noninstitutionalized population (%)
People in Group quarters - College dormitories (includes college quarters off campus) (%)
People in Group quarters - Military quarters (%)
People in Group quarters - On base (%)
People in Group quarters - Barracks, unaccompanied personnel housing (UPH), (Enlisted/Officer), ;and similar group living quarters for military personnel (%)
People in Group quarters - Transient quarters for temporary residents (%)
People in Group quarters - Military ships (%)
People in Group quarters - Group homes (%)
People in Group quarters - Homes or halfway houses for drug/alcohol abuse (%)
People in Group quarters - Homes for the mentally ill (%)
People in Group quarters - Homes for the mentally retarded (%)
People in Group quarters - Homes for the physically handicapped (%)
People in Group quarters - Other group homes (%)
People in Group quarters - Religious group quarters (%)
People in Group quarters - Dormitories (%)
People in Group quarters - Agriculture workers' dormitories on farms (%)
People in Group quarters - Job Corps and vocational training facilities (%)
People in Group quarters - Other workers' dormitories (%)
People in Group quarters - Crews of maritime vessels (%)
People in Group quarters - Other nonhousehold living situations (%)
People in Group quarters - Other noninstitutional group quarters (%)
Residents speaking English at home (%)
Residents speaking English at home - Born in the United States (%)
Residents speaking English at home - Native, born elsewhere (%)
Residents speaking English at home - Foreign born (%)
Residents speaking Spanish at home (%)
Residents speaking Spanish at home - Born in the United States (%)
Residents speaking Spanish at home - Native, born elsewhere (%)
Residents speaking Spanish at home - Foreign born (%)
Residents speaking other language at home (%)
Residents speaking other language at home - Born in the United States (%)
Residents speaking other language at home - Native, born elsewhere (%)
Residents speaking other language at home - Foreign born (%)
Class of Workers - Employee of private company (%)
Class of Workers - Self-employed in own incorporated business (%)
Class of Workers - Private not-for-profit wage and salary workers (%)
Class of Workers - Local government workers (%)
Class of Workers - State government workers (%)
Class of Workers - Federal government workers (%)
Class of Workers - Self-employed workers in own not incorporated business and Unpaid family workers (%)
House heating fuel used in houses and condos - Utility gas (%)
House heating fuel used in houses and condos - Bottled, tank, or LP gas (%)
House heating fuel used in houses and condos - Electricity (%)
House heating fuel used in houses and condos - Fuel oil, kerosene, etc. (%)
House heating fuel used in houses and condos - Coal or coke (%)
House heating fuel used in houses and condos - Wood (%)
House heating fuel used in houses and condos - Solar energy (%)
House heating fuel used in houses and condos - Other fuel (%)
House heating fuel used in houses and condos - No fuel used (%)
House heating fuel used in apartments - Utility gas (%)
House heating fuel used in apartments - Bottled, tank, or LP gas (%)
House heating fuel used in apartments - Electricity (%)
House heating fuel used in apartments - Fuel oil, kerosene, etc. (%)
House heating fuel used in apartments - Coal or coke (%)
House heating fuel used in apartments - Wood (%)
House heating fuel used in apartments - Solar energy (%)
House heating fuel used in apartments - Other fuel (%)
House heating fuel used in apartments - No fuel used (%)
Armed forces status - In Armed Forces (%)
Armed forces status - Civilian (%)
Armed forces status - Civilian - Veteran (%)
Armed forces status - Civilian - Nonveteran (%)
Fatal accidents locations in years 2005-2021
Fatal accidents locations in 2005
Fatal accidents locations in 2006
Fatal accidents locations in 2007
Fatal accidents locations in 2008
Fatal accidents locations in 2009
Fatal accidents locations in 2010
Fatal accidents locations in 2011
Fatal accidents locations in 2012
Fatal accidents locations in 2013
Fatal accidents locations in 2014
Fatal accidents locations in 2015
Fatal accidents locations in 2016
Fatal accidents locations in 2017
Fatal accidents locations in 2018
Fatal accidents locations in 2019
Fatal accidents locations in 2020
Fatal accidents locations in 2021
Alcohol use - People drinking some alcohol every month (%)
Alcohol use - People not drinking at all (%)
Alcohol use - Average days/month drinking alcohol
Alcohol use - Average drinks/week
Alcohol use - Average days/year people drink much
Audiometry - Average condition of hearing (%)
Audiometry - People that can hear a whisper from across a quiet room (%)
Audiometry - People that can hear normal voice from across a quiet room (%)
Audiometry - Ears ringing, roaring, buzzing (%)
Audiometry - Had a job exposure to loud noise (%)
Audiometry - Had off-work exposure to loud noise (%)
Blood Pressure & Cholesterol - Has high blood pressure (%)
Blood Pressure & Cholesterol - Checking blood pressure at home (%)
Blood Pressure & Cholesterol - Frequently checking blood cholesterol (%)
Blood Pressure & Cholesterol - Has high cholesterol level (%)
Consumer Behavior - Money monthly spent on food at supermarket/grocery store
Consumer Behavior - Money monthly spent on food at other stores
Consumer Behavior - Money monthly spent on eating out
Consumer Behavior - Money monthly spent on carryout/delivered foods
Consumer Behavior - Income spent on food at supermarket/grocery store (%)
Consumer Behavior - Income spent on food at other stores (%)
Consumer Behavior - Income spent on eating out (%)
Consumer Behavior - Income spent on carryout/delivered foods (%)
Current Health Status - General health condition (%)
Current Health Status - Blood donors (%)
Current Health Status - Has blood ever tested for HIV virus (%)
Current Health Status - Left-handed people (%)
Dermatology - People using sunscreen (%)
Diabetes - Diabetics (%)
Diabetes - Had a blood test for high blood sugar (%)
Diabetes - People taking insulin (%)
Diet Behavior & Nutrition - Diet health (%)
Diet Behavior & Nutrition - Milk product consumption (# of products/month)
Diet Behavior & Nutrition - Meals not home prepared (#/week)
Diet Behavior & Nutrition - Meals from fast food or pizza place (#/week)
Diet Behavior & Nutrition - Ready-to-eat foods (#/month)
Diet Behavior & Nutrition - Frozen meals/pizza (#/month)
Drug Use - People that ever used marijuana or hashish (%)
Drug Use - Ever used hard drugs (%)
Drug Use - Ever used any form of cocaine (%)
Drug Use - Ever used heroin (%)
Drug Use - Ever used methamphetamine (%)
Health Insurance - People covered by health insurance (%)
Kidney Conditions-Urology - Avg. # of times urinating at night
Medical Conditions - People with asthma (%)
Medical Conditions - People with anemia (%)
Medical Conditions - People with psoriasis (%)
Medical Conditions - People with overweight (%)
Medical Conditions - Elderly people having difficulties in thinking or remembering (%)
Medical Conditions - People who ever received blood transfusion (%)
Medical Conditions - People having trouble seeing even with glass/contacts (%)
Medical Conditions - People with arthritis (%)
Medical Conditions - People with gout (%)
Medical Conditions - People with congestive heart failure (%)
Medical Conditions - People with coronary heart disease (%)
Medical Conditions - People with angina pectoris (%)
Medical Conditions - People who ever had heart attack (%)
Medical Conditions - People who ever had stroke (%)
Medical Conditions - People with emphysema (%)
Medical Conditions - People with thyroid problem (%)
Medical Conditions - People with chronic bronchitis (%)
Medical Conditions - People with any liver condition (%)
Medical Conditions - People who ever had cancer or malignancy (%)
Mental Health - People who have little interest in doing things (%)
Mental Health - People feeling down, depressed, or hopeless (%)
Mental Health - People who have trouble sleeping or sleeping too much (%)
Mental Health - People feeling tired or having little energy (%)
Mental Health - People with poor appetite or overeating (%)
Mental Health - People feeling bad about themself (%)
Mental Health - People who have trouble concentrating on things (%)
Mental Health - People moving or speaking slowly or too fast (%)
Mental Health - People having thoughts they would be better off dead (%)
Oral Health - Average years since last visit a dentist
Oral Health - People embarrassed because of mouth (%)
Oral Health - People with gum disease (%)
Oral Health - General health of teeth and gums (%)
Oral Health - Average days a week using dental floss/device
Oral Health - Average days a week using mouthwash for dental problem
Oral Health - Average number of teeth
Pesticide Use - Households using pesticides to control insects (%)
Pesticide Use - Households using pesticides to kill weeds (%)
Physical Activity - People doing vigorous-intensity work activities (%)
Physical Activity - People doing moderate-intensity work activities (%)
Physical Activity - People walking or bicycling (%)
Physical Activity - People doing vigorous-intensity recreational activities (%)
Physical Activity - People doing moderate-intensity recreational activities (%)
Physical Activity - Average hours a day doing sedentary activities
Physical Activity - Average hours a day watching TV or videos
Physical Activity - Average hours a day using computer
Physical Functioning - People having limitations keeping them from working (%)
Physical Functioning - People limited in amount of work they can do (%)
Physical Functioning - People that need special equipment to walk (%)
Physical Functioning - People experiencing confusion/memory problems (%)
Physical Functioning - People requiring special healthcare equipment (%)
Prescription Medications - Average number of prescription medicines taking
Preventive Aspirin Use - Adults 40+ taking low-dose aspirin (%)
Reproductive Health - Vaginal deliveries (%)
Reproductive Health - Cesarean deliveries (%)
Reproductive Health - Deliveries resulted in a live birth (%)
Reproductive Health - Pregnancies resulted in a delivery (%)
Reproductive Health - Women breastfeeding newborns (%)
Reproductive Health - Women that had a hysterectomy (%)
Reproductive Health - Women that had both ovaries removed (%)
Reproductive Health - Women that have ever taken birth control pills (%)
Reproductive Health - Women taking birth control pills (%)
Reproductive Health - Women that have ever used Depo-Provera or injectables (%)
Reproductive Health - Women that have ever used female hormones (%)
Sexual Behavior - People 18+ that ever had sex (vaginal, anal, or oral) (%)
Sexual Behavior - Males 18+ that ever had vaginal sex with a woman (%)
Sexual Behavior - Males 18+ that ever performed oral sex on a woman (%)
Sexual Behavior - Males 18+ that ever had anal sex with a woman (%)
Sexual Behavior - Males 18+ that ever had any sex with a man (%)
Sexual Behavior - Females 18+ that ever had vaginal sex with a man (%)
Sexual Behavior - Females 18+ that ever performed oral sex on a man (%)
Sexual Behavior - Females 18+ that ever had anal sex with a man (%)
Sexual Behavior - Females 18+ that ever had any kind of sex with a woman (%)
Sexual Behavior - Average age people first had sex
Sexual Behavior - Average number of female sex partners in lifetime (males 18+)
Sexual Behavior - Average number of female vaginal sex partners in lifetime (males 18+)
Sexual Behavior - Average age people first performed oral sex on a woman (18+)
Sexual Behavior - Average number of woman performed oral sex on in lifetime (18+)
Sexual Behavior - Average number of male sex partners in lifetime (males 18+)
Sexual Behavior - Average number of male anal sex partners in lifetime (males 18+)
Sexual Behavior - Average age people first performed oral sex on a man (18+)
Sexual Behavior - Average number of male oral sex partners in lifetime (18+)
Sexual Behavior - People using protection when performing oral sex (%)
Sexual Behavior - Average number of times people have vaginal or anal sex a year
Sexual Behavior - People having sex without condom (%)
Sexual Behavior - Average number of male sex partners in lifetime (females 18+)
Sexual Behavior - Average number of male vaginal sex partners in lifetime (females 18+)
Sexual Behavior - Average number of female sex partners in lifetime (females 18+)
Sexual Behavior - Circumcised males 18+ (%)
Sleep Disorders - Average hours sleeping at night
Sleep Disorders - People that has trouble sleeping (%)
Smoking-Cigarette Use - People smoking cigarettes (%)
Taste & Smell - People 40+ having problems with smell (%)
Taste & Smell - People 40+ having problems with taste (%)
Taste & Smell - People 40+ that ever had wisdom teeth removed (%)
Taste & Smell - People 40+ that ever had tonsils teeth removed (%)
Taste & Smell - People 40+ that ever had a loss of consciousness because of a head injury (%)
Taste & Smell - People 40+ that ever had a broken nose or other serious injury to face or skull (%)
Taste & Smell - People 40+ that ever had two or more sinus infections (%)
Weight - Average height (inches)
Weight - Average weight (pounds)
Weight - Average BMI
Weight - People that are obese (%)
Weight - People that ever were obese (%)
Weight - People trying to lose weight (%)
100%
urban population.
Estimated median house/condo value in 2022: $806,786
92119:
$806,786California:
$715,900
According to our research of California and other state lists, there were 13 registered sex offenders living in 92119 zip code as of June 03, 2024 . The ratio of all residents to sex offenders in zip code 92119 is 1,830 to 1.The ratio of registered sex offenders to all residents in this zip code is lower than the state average.
Median resident age: This zip code:
43.3 yearsCalifornia median age:
37.9 years
Average household size: This zip code:
2.5 peopleCalifornia:
2.8 people
Averages for the 2020 tax year for zip code 92119, filed in 2021:
Average Adjusted Gross Income (AGI) in 2020: $90,134 (Individual Income Tax Returns) Here:
$90,134State:
$95,910
Salary/wage: $81,268 (reported on 76.0% of returns )Here:
$81,268State:
$77,331
(% of AGI for various income ranges: 1070.3% for AGIs below $25k , 3674.0% for AGIs $25k-50k , 6696.8% for AGIs $50k-75k , 9568.2% for AGIs $75k-100k , 20017.6% for AGIs $100k-200k , 63881.6% for AGIs over 200k ) Taxable interest for individuals: $1,243 (reported on 49.3% of returns )This zip code:
$1,243California:
$2,294
(% of AGI for various income ranges: 26.0% for AGIs below $25k , 39.5% for AGIs $25k-50k , 65.0% for AGIs $50k-75k , 83.4% for AGIs $75k-100k , 182.8% for AGIs $100k-200k , 639.5% for AGIs over 200k ) Ordinary dividends: $5,064 (reported on 28.8% of returns )(% of AGI for various income ranges: 53.2% for AGIs below $25k , 80.5% for AGIs $25k-50k , 166.7% for AGIs $50k-75k , 267.0% for AGIs $75k-100k , 412.6% for AGIs $100k-200k , 1510.8% for AGIs over 200k ) Net capital gain/loss in AGI: +$12,232 (reported on 26.3% of returns )Here:
+$12,232State:
+$49,306
(% of AGI for various income ranges: 15.8% for AGIs below $25k , 39.3% for AGIs $25k-50k , 118.6% for AGIs $50k-75k , 230.9% for AGIs $75k-100k , 618.5% for AGIs $100k-200k , 7068.6% for AGIs over 200k ) Profit/loss from business: +$13,535 (reported on 16.3% of returns )Here:
+$13,535State:
+$15,671
(% of AGI for various income ranges: 103.6% for AGIs below $25k , 185.0% for AGIs $25k-50k , 206.8% for AGIs $50k-75k , 377.2% for AGIs $75k-100k , 600.1% for AGIs $100k-200k , 2203.2% for AGIs over 200k ) Taxable individual retirement arrangement distribution: $19,152 (reported on 12.4% of returns )92119:
$19,152California:
$23,505
(% of AGI for various income ranges: 83.9% for AGIs below $25k , 179.7% for AGIs $25k-50k , 277.6% for AGIs $50k-75k , 529.1% for AGIs $75k-100k , 783.3% for AGIs $100k-200k , 1629.7% for AGIs over 200k ) Self-employed (Keogh) retirement plans: $18,191 (reported on 0.9% of returns )92119:
$18,191California:
$30,163
(% of AGI for various income ranges: 22.4% for AGIs $50k-75k , 31.3% for AGIs $100k-200k , 351.6% for AGIs over 200k ) Total itemized deductions: $31,970 (reported on 22.1% of returns )Here:
$31,970State:
$39,517
(% of AGI for various income ranges: 122.8% for AGIs below $25k , 249.1% for AGIs $25k-50k , 656.1% for AGIs $50k-75k , 1219.0% for AGIs $75k-100k , 2474.1% for AGIs $100k-200k , 7343.5% for AGIs over 200k ) Charity contributions: $5,150 (reported on 18.4% of returns )(% of AGI for various income ranges: 6.0% for AGIs below $25k , 27.2% for AGIs $25k-50k , 71.4% for AGIs $50k-75k , 142.4% for AGIs $75k-100k , 349.7% for AGIs $100k-200k , 1087.3% for AGIs over 200k ) Taxes paid: $8,605 (reported on 22.1% of returns )(% of AGI for various income ranges: 21.5% for AGIs below $25k , 52.5% for AGIs $25k-50k , 170.3% for AGIs $50k-75k , 377.8% for AGIs $75k-100k , 737.8% for AGIs $100k-200k , 1719.7% for AGIs over 200k ) Earned income credit: $1,680 (reported on 7.7% of returns )(% of AGI for various income ranges: 53.5% for AGIs below $25k , 42.2% for AGIs $25k-50k ) Percentage of individuals using paid preparers for their 2020 taxes: 93.1%(% for various income ranges: 91.4% for AGIs below $25k , 92.8% for AGIs $25k-50k , 93.6% for AGIs $50k-75k , 92.9% for AGIs $75k-100k , 94.1% for AGIs $100k-200k , 94.8% for AGIs over 200k )
Averages for the 2012 tax year for zip code 92119, filed in 2013:
Average Adjusted Gross Income (AGI) in 2012: $69,321 (Individual Income Tax Returns) Here:
$69,321State:
$72,726
Salary/wage: $62,153 (reported on 76.5% of returns )Here:
$62,153State:
$59,079
(% of AGI for various income ranges: 65.8% for AGIs below $25k , 70.3% for AGIs $25k-50k , 67.2% for AGIs $50k-75k , 67.2% for AGIs $75k-100k , 72.6% for AGIs $100k-200k , 61.6% for AGIs over 200k ) Taxable interest for individuals: $1,189 (reported on 50.3% of returns )This zip code:
$1,189California:
$2,146
(% of AGI for various income ranges: 1.5% for AGIs below $25k , 1.0% for AGIs $25k-50k , 0.8% for AGIs $50k-75k , 0.8% for AGIs $75k-100k , 0.7% for AGIs $100k-200k , 1.2% for AGIs over 200k ) Ordinary dividends: $4,277 (reported on 28.9% of returns )(% of AGI for various income ranges: 2.8% for AGIs below $25k , 1.5% for AGIs $25k-50k , 1.9% for AGIs $50k-75k , 1.4% for AGIs $75k-100k , 1.4% for AGIs $100k-200k , 2.8% for AGIs over 200k ) Net capital gain/loss in AGI: +$4,532 (reported on 23.8% of returns )Here:
+$4,532State:
+$30,460
(% of AGI for various income ranges: 0.2% for AGIs $25k-50k , 0.4% for AGIs $50k-75k , 0.2% for AGIs $75k-100k , 1.5% for AGIs $100k-200k , 5.7% for AGIs over 200k ) Profit/loss from business: +$14,368 (reported on 16.3% of returns )Here:
+$14,368State:
+$17,064
(% of AGI for various income ranges: 7.3% for AGIs below $25k , 4.3% for AGIs $25k-50k , 3.0% for AGIs $50k-75k , 3.7% for AGIs $75k-100k , 2.7% for AGIs $100k-200k , 3.3% for AGIs over 200k ) Taxable individual retirement arrangement distribution: $14,023 (reported on 15.6% of returns )92119:
$14,023California:
$19,557
(% of AGI for various income ranges: 5.6% for AGIs below $25k , 3.3% for AGIs $25k-50k , 3.6% for AGIs $50k-75k , 3.4% for AGIs $75k-100k , 3.0% for AGIs $100k-200k , 2.2% for AGIs over 200k ) Self-employment retirement plans: $14,000 (reported on 0.9% of returns )92119:
$14,000California:
$24,530
Total itemized deductions: $26,045 (24% of AGI, reported on 44.9% of returns )Here:
$26,045State:
$34,004
Here:
24.1% of AGIState:
22.7% of AGI
(% of AGI for various income ranges: 15.6% for AGIs below $25k , 13.4% for AGIs $25k-50k , 15.7% for AGIs $50k-75k , 17.0% for AGIs $75k-100k , 18.3% for AGIs $100k-200k , 17.4% for AGIs over 200k ) Charity contributions: $3,247 (reported on 39.2% of returns )(% of AGI for various income ranges: 1.0% for AGIs below $25k , 1.2% for AGIs $25k-50k , 1.5% for AGIs $50k-75k , 1.8% for AGIs $75k-100k , 2.0% for AGIs $100k-200k , 2.5% for AGIs over 200k ) Taxes paid: $8,961 (reported on 44.7% of returns )92119:
$8,961State:
$14,448
(% of AGI for various income ranges: 2.5% for AGIs below $25k , 2.5% for AGIs $25k-50k , 3.9% for AGIs $50k-75k , 5.3% for AGIs $75k-100k , 6.9% for AGIs $100k-200k , 8.5% for AGIs over 200k ) Earned income credit: $1,760 (reported on 9.1% of returns )(% of AGI for various income ranges: 3.3% for AGIs below $25k , 0.6% for AGIs $25k-50k ) Percentage of individuals using paid preparers for their 2012 taxes: 55.9%(% for various income ranges: 47.6% for AGIs below $25k , 53.2% for AGIs $25k-50k , 58.4% for AGIs $50k-75k , 61.3% for AGIs $75k-100k , 62.6% for AGIs $100k-200k , 69.2% for AGIs over 200k )
Averages for the 2004 tax year for zip code 92119, filed in 2005:
Average Adjusted Gross Income (AGI) in 2004: $54,362 (Individual Income Tax Returns) Here:
$54,362State:
$58,600
Salary/wage: $49,272 (reported on 76.6% of returns )Here:
$49,272State:
$49,455
(% of AGI for various income ranges: 115.3% for AGIs below $10k , 65.1% for AGIs $10k-25k , 70.7% for AGIs $25k-50k , 69.1% for AGIs $50k-75k , 72.5% for AGIs $75k-100k , 67.3% for AGIs over 100k ) Taxable interest for individuals: $1,601 (reported on 61.3% of returns )This zip code:
$1,601California:
$2,365
(% of AGI for various income ranges: 9.6% for AGIs below $10k , 3.2% for AGIs $10k-25k , 2.0% for AGIs $25k-50k , 1.7% for AGIs $50k-75k , 1.4% for AGIs $75k-100k , 1.6% for AGIs over 100k ) Taxable dividends: $2,682 (reported on 34.3% of returns )(% of AGI for various income ranges: 8.9% for AGIs below $10k , 2.7% for AGIs $10k-25k , 1.8% for AGIs $25k-50k , 1.6% for AGIs $50k-75k , 1.2% for AGIs $75k-100k , 1.6% for AGIs over 100k ) Net capital gain/loss: +$6,239 (reported on 28.6% of returns )Here:
+$6,239State:
+$23,418
(% of AGI for various income ranges: -3.6% for AGIs below $10k , -0.1% for AGIs $10k-25k , 0.3% for AGIs $25k-50k , 0.8% for AGIs $50k-75k , 1.3% for AGIs $75k-100k , 7.4% for AGIs over 100k ) Profit/loss from business: +$14,976 (reported on 16.7% of returns )Here:
+$14,976State:
+$16,826
(% of AGI for various income ranges: 18.7% for AGIs below $10k , 6.8% for AGIs $10k-25k , 4.3% for AGIs $25k-50k , 4.0% for AGIs $50k-75k , 4.0% for AGIs $75k-100k , 4.7% for AGIs over 100k ) IRA payment deduction: $2,915 (reported on 3.8% of returns )92119:
$2,915California:
$3,192
(% of AGI for various income ranges: 0.6% for AGIs below $10k , 0.3% for AGIs $10k-25k , 0.3% for AGIs $25k-50k , 0.2% for AGIs $50k-75k , 0.2% for AGIs $75k-100k , 0.2% for AGIs over 100k ) Self-employed pension: $11,359 (reported on 1.7% of returns )Here:
$11,359California:
$17,688
(% of AGI for various income ranges: 0.6% for AGIs below $10k , 0.1% for AGIs $25k-50k , 0.2% for AGIs $50k-75k , 0.2% for AGIs $75k-100k , 0.6% for AGIs over 100k ) Total itemized deductions: $22,179 (27% of AGI, reported on 47.8% of returns )Here:
$22,179State:
$28,113
Here:
26.9% of AGIState:
25.3% of AGI
(% of AGI for various income ranges: 35.7% for AGIs below $10k , 18.0% for AGIs $10k-25k , 16.6% for AGIs $25k-50k , 21.4% for AGIs $50k-75k , 21.0% for AGIs $75k-100k , 19.0% for AGIs over 100k ) Charity contributions deductions: $2,885 (3% of AGI, reported on 43.6% of returns )Here:
3.4% of AGIState:
3.3% of AGI
(% of AGI for various income ranges: 1.9% for AGIs below $10k , 1.7% for AGIs $10k-25k , 1.8% for AGIs $25k-50k , 2.1% for AGIs $50k-75k , 2.4% for AGIs $75k-100k , 2.7% for AGIs over 100k ) Total tax: $7,358 (reported on 84.2% of returns )92119:
$7,358State:
$10,761
(% of AGI for various income ranges: 4.9% for AGIs below $10k , 4.9% for AGIs $10k-25k , 7.7% for AGIs $25k-50k , 9.6% for AGIs $50k-75k , 10.3% for AGIs $75k-100k , 15.6% for AGIs over 100k ) Earned income credit: $1,290 (reported on 7.1% of returns )Percentage of individuals using paid preparers for their 2004 taxes: 60.0%(% for various income ranges: 49.9% for AGIs below $10k , 57.4% for AGIs $10k-25k , 59.2% for AGIs $25k-50k , 64.0% for AGIs $50k-75k , 62.6% for AGIs $75k-100k , 68.5% for AGIs over 100k )
Estimated median household income in 2022: This zip code:
$105,441California:
$91,551
Nearest zip codes: 91942 ,
92120 ,
92071 ,
92124 ,
92020 ,
92115 .
San Diego Zip Code Map
Percentage of family households: This zip code:
42.5%California:
46.8%
Percentage of households with unmarried partners: This zip code:
2.9%California:
48.1%
Likely homosexual households (counted as self-reported same-sex unmarried-partner households)
Lesbian couples: 0.3% of all households Gay men: 0.0% of all households
Household received Food Stamps/SNAP in the past 12 months: 571Household did not receive Food Stamps/SNAP in the past 12 months: 8,768
Women who had a birth in the past 12 months: 269 (245 now married , 22 unmarried) Women who did not have a birth in the past 12 months: 5,390 (2,418 now married , 2,960 unmarried)
Housing units in zip code 92119 with a mortgage: 4,645 (448
second mortgage , 14
home equity loan , 326
both second mortgage and home equity loan )
Houses without a mortgage: 68
Median monthly owner costs for units with a mortgage: $2,867
Median monthly owner costs for units without a mortgage: $669
Residents with income below the poverty level in 2022:
This zip code:
6.4%Whole state:
12.2%
Residents with income below 50% of the poverty level in 2022:
This zip code:
4.2%Whole state:
6.2%
Median number of rooms in houses and condos: Median number of rooms in apartments:
Year house built (houses)
0 2020 or later58 2010 to 2019200 2000 to 2009139 1990 to 19991,125 1980 to 19892,822 1970 to 19794,332 1960 to 1969671 1950 to 195930 1940 to 194956 1939 or earlier
Zip code 92119 household income distribution in 2022 186 Less than $10,000201 $10,000 to $14,999341 $15,000 to $19,999201 $20,000 to $24,999339 $25,000 to $29,999106 $30,000 to $34,999242 $35,000 to $39,999199 $40,000 to $44,999137 $45,000 to $49,999411 $50,000 to $59,999846 $60,000 to $74,9991,262 $75,000 to $99,9991,018 $100,000 to $124,999720 $125,000 to $149,9991,203 $150,000 to $199,9992,034 $200,000 or moreEstimate of home value of owner-occupied houses/condos in 2022 in zip code 92119 88 Less than $10,00020 $60,000 to $69,9996 $90,000 to $99,99923 $100,000 to $124,99968 $250,000 to $299,999269 $300,000 to $399,999441 $400,000 to $499,9992,541 $500,000 to $749,9993,088 $750,000 to $999,999640 $1,000,000 to $1,499,99985 $1,500,000 to $1,999,9999 $2,000,000 or moreRent paid by renters in 2022 in zip code 92119 19 $200 to $24913 $250 to $29924 $450 to $49917 $500 to $54911 $550 to $59950 $600 to $64918 $750 to $79930 $800 to $89923 $900 to $999108 $1,000 to $1,249149 $1,250 to $1,499818 $1,500 to $1,999584 $2,000 to $2,499327 $2,500 to $2,999161 $3,000 to $3,499106 No cash rent
Median gross rent in 2022: $2,046.
Median price asked for vacant for-sale houses and condos in 2022: $1,186,671.
Estimated median house (or condo) value in 2022 for: White Non-Hispanic householders: $842,135Black or African American householders: $807,153American Indian or Alaska Native householders: $839,925Asian householders: $800,893Native Hawaiian and other Pacific Islander householders: $863,124Some other race householders: $815,254Two or more races householders: $807,521Hispanic or Latino householders: $860,178Estimated median house or condo value in 2022: $806,786
92119:
$806,786California:
$715,900
Lower value quartile - upper value quartile: $631,574 - $983,893
Mean price in 2022: Detached houses: $905,594Here:
$905,594State:
$988,808
Townhouses or other attached units: $645,588Here:
$645,588State:
$838,546
In 3-to-4-unit structures: $268,019Here:
$268,019State:
$824,253
In 5-or-more-unit structures: $385,299Here:
$385,299State:
$730,996
Housing units in structures:
One, detached: 6,370One, attached: 6193 or 4: 2665 to 9: 48710 to 19: 71320 to 49: 54150 or more: 686Mobile homes: 25Unemployment : 5.0%
Means of transportation to work in zip code 92119 66.6% 8,099 Drove a car alone7.7% 936 Carpooled0.4% 49 Bus or trolley bus0.0% 6 Streetcar or trolley car0.2% 21 Railroad0.2% 25 Motorcycle0.4% 46 Bicycle0.7% 82 Walked0.2% 24 Other means26.0% 3,161 Worked at homeTravel time to work (commute) in zip code 92119 81 Less than 5 minutes596 5 to 9 minutes919 10 to 14 minutes1,302 15 to 19 minutes1,827 20 to 24 minutes1,114 25 to 29 minutes1,364 30 to 34 minutes590 35 to 39 minutes322 40 to 44 minutes564 45 to 59 minutes482 60 to 89 minutes89 90 or more minutes
Neighborhoods in zip code 92119: Percentage of zip code residents living and working in this county: 99.3%
Household type by relationship:
Households: 24,216
Male householders: 4,174 (888 living alone ), Female householders: 5,314 (1,864 living alone )4,795 spouses (4,694 opposite-sex spouses ), 465 unmarried partners , (457 opposite-sex unmarried partners ), 6,754 children (6,541 natural , 121 adopted , 95 stepchildren ), 412 grandchildren , 246 brothers or sisters , 248 parents , 0 foster children , 373 other relatives , 1,313 non-relatives In group quarters: 154 (-1 institutionalized population )
Size of family households: 2,432 2-persons , 1,563 3-persons , 1,267 4-persons , 362 5-persons , 200 6-persons , 102 7-or-more-persons
Size of nonfamily households: 2,759 1-person , 692 2-persons , 87 3-persons , 35 4-persons
3,434 married couples with children. single-parent households (233 men , 724 women ).
81.4% of residents of 92119 zip code speak English at home. of residents speak Spanish at home (80% very well, 13% well, 4% not well, 2% not at all ).of residents speak other Indo-European language at home (77% very well, 8% well, 11% not well, 4% not at all ).of residents speak Asian or Pacific Island language at home (59% very well, 24% well, 17% not well ).of residents speak other language at home (51% very well, 39% well, 10% not well ).
Foreign born population: 2,646 (10.9%)
(81.3%
of them are naturalized citizens )
This zip code:
10.9%Whole state:
26.7%
24% Honduras 12% Malaysia 5% Sweden 5% Indonesia 4% Iran 4% Taiwan 3% Georgia 9% English 6% Italian 6% German 5% American 5% European 4% Irish 2% Iraqi
Year of entry for the foreign-born population
626 2010 or later 606 2000 to 2009 645 1990 to 1999 1,291 Before 1990
There are
78 Medical Specialists in Zip Code 92119 .
Facilities with environmental interests located in this zip code:
GAGE ELEMENTARY (6811 BISBY LAKE DR. in SAN DIEGO, CA)
(National Center for Education Statistics) - STATE ID-6039648 Organizations: SAN DIEGO UNIFIED (SCHOOL DISTRICT)
GREEN ELEMENTARY (7030 WANDERMERE AVE. in SAN DIEGO, CA)
(National Center for Education Statistics) - STATE ID-6039697 Organizations: SAN DIEGO UNIFIED (SCHOOL DISTRICT)
FROMEX PHOTO SYSTEMS (7299 NAVAJO RD in SAN DIEGO, CA)
(Resource Conservation and Recovery Act (tracking hazardous waste)) Organizations: MUSICANT MYIA (CONTACT/OWNER)
EXXON S/S 7 3179 (8815 LAKE MURRAY BLVD in SAN DIEGO, CA)
Small Quantity Generators, between 100 kg and 1000 kg of hazardous waste/month (Resource Conservation and Recovery Act (tracking hazardous waste))
EXXON #1026 (8815 LAKE MURRAY BL in SAN DIEGO, CA)
CRITERIA AND HAZARDOUS AIR POLLUTANT INVENTORY (Inventory of air pollution sources) Business SIC classification: GASOLINE SERVICE STATIONS
EXXON #1037 (6953 NAVAJO RD in SAN DIEGO, CA)
CRITERIA AND HAZARDOUS AIR POLLUTANT INVENTORY (Inventory of air pollution sources) Business SIC classification: GASOLINE SERVICE STATIONS
G&M OIL / JACKSON DR (7448 JACKSON DR in SAN DIEGO, CA)
CRITERIA AND HAZARDOUS AIR POLLUTANT INVENTORY (Inventory of air pollution sources) Business SIC classification: GASOLINE SERVICE STATIONS
CENTURY 21 AWARD (7439 JACKSON DR in SAN DIEGO, CA)
COMPLIANCE ACTIVITY (Tracking inspections of insecticide, fungicide, and rodenticide, and toxic substances)
CHEVRON / LAKE MURRAY BLVD (8780 LAKE MURRAY BL in SAN DIEGO, CA)
CRITERIA AND HAZARDOUS AIR POLLUTANT INVENTORY (Inventory of air pollution sources) Business SIC classification: GASOLINE SERVICE STATIONS
Housing units lacking complete plumbing facilities: 0.3%
Housing units lacking complete kitchen facilities: 0.2%
59.7% Utility gas 36.1% Electricity 1.6% No fuel used 1.3% Solar energy 0.9% Bottled, tank, or LP gas
Population in 1990: 24,135.
Place of birth for U.S.-born residents:
This state: 13,499Northeast: 1,922Midwest: 2,256South: 1,553West: 1,623
63% of the 92119 zip code residents lived in the same house 5 years ago.
Out of people who lived in different houses, 76% lived in this county.
Out of people who lived in different counties, 50% lived in California.
93% of the 92119 zip code residents lived in the same house 1 year ago.
Out of people who lived in different houses, 76% moved from this county.
Out of people who lived in different houses, 8% moved from different county within same state.
Out of people who lived in different houses, 17% moved from different state.
Private vs. public school enrollment:
Students in private schools in grades 1 to 8 (elementary and middle school): 161
Here:
7.3%California:
10.5%
Students in private schools in grades 9 to 12 (high school): 87
Students in private undergraduate colleges: 254
Here:
17.1%California:
15.9%
Occupation by median earnings in the past 12 months ($)
127,379 Law enforcement workers including supervisors 116,268 Health diagnosing and treating practitioners and other technical occupations 114,003 Architecture and engineering occupations 104,215 Computer and mathematical occupations 98,076 Fire fighting and prevention, and other protective service workers including supervisors 93,963 Management occupations
Companies with federal contracts located in this zip code (SAN DIEGO, CA):
U S MILITARY SALES (6604 GOLFCREST DR) in 7 contracts from 2000 to 2005
Contracts for Food Items For Resale, Logistics Support Services by NavySigned by year: 2000: $273,047; 2001: $0; 2002: $49,923; 2003: $0; 2004: $576; 2005: $69; 2006: $0.
Biggest contracts: with Navy for Food Items For Resale. Signed on 2000-12-16. Completion date: 2001-12-15.
with Navy for Logistics Support Services. Taking place in VA. Signed on 2000-10-25. Completion date: 2001-01-31.
, same as above. Signed on 2000-10-25. Completion date: 2001-01-31.
with Navy for Food Items For Resale. Signed on 2002-05-05. Completion date: 2002-06-25.
MAXWELL DATA SUPPLIES (7424 JACKSON DRIVE; small business) in 2 contracts from 2002 to 2003
$25,000 with Federal Technology Service for ADP Components. Signed on 2002-02-15. Completion date: 2002-03-15.
with Navy for Telephone and Telegraph Equipment. Signed on 2003-02-25. Completion date: 2003-03-03.
MOSLEY PHOTOGRAPHICS (6399 LAKE ARROWHEAD DR; small business)
$25,000 with Navy for General Photographic Services - Still. Signed on 2005-06-14. Completion date: 2006-06-30.
GALINDO ELECTRIC (7823 TOMMY DR #50; small business)
$24,480 with Navy for Maintenance, Repair or Alteration of Real Property -- EPG Facilities - Other, Including Transmission. Signed on 2001-08-02. Completion date: 2001-12-16.
Top industries in this zip code by the number of employees in 2005:
Accommodation and Food Services: Limited-Service Restaurants (50-99 employees: 1 establishment, 20-49 employees: 3 establishments, 10-19 employees: 1 establishment, 5-9 employees: 2 establishments, 1-4 employees: 1 establishment)Health Care and Social Assistance: Offices of Dentists (20-49: 1, 10-19: 3, 5-9: 7, 1-4: 8)Other Services (except Public Administration): Religious Organizations (50-99: 1, 10-19: 1, 1-4: 2)Arts, Entertainment, and Recreation: Golf Courses and Country Clubs (50-99: 1)Construction: Plumbing, Heating, and Air-Conditioning Contractors (20-49: 1, 5-9: 3, 1-4: 5)Real Estate and Rental and Leasing: Offices of Real Estate Agents and Brokers (10-19: 1, 5-9: 3, 1-4: 14)
People in group quarters in 2010:
63 people in group homes intended for adults
7 people in workers' group living quarters and job corps centers
People in group quarters in 2000:
33 people in other noninstitutional group quarters
20 people in homes for the mentally retarded
Fatal accident statistics in 2014:
Fatal accident count: 1Vehicles involved in fatal accidents: 1Fatal accidents caused by drunken drivers: 0Fatalities: 1Persons involved in fatal accidents: 1Pedestrians involved in fatal accidents: 1
Fatal accident statistics in 2011:
Fatal accident count: 1Vehicles involved in fatal accidents: 1Fatal accidents caused by drunken drivers: 0Fatalities: 1Persons involved in fatal accidents: 1Pedestrians involved in fatal accidents: 1
Home Mortgage Disclosure Act Aggregated Statistics For Year 2009(Based on 10 partial tracts) A) FHA, FSA/RHS & VA B) Conventional C) Refinancings D) Home Improvement Loans E) Loans on Dwellings For 5+ Families F) Non-occupant Loans on Number Average Value Number Average Value Number Average Value Number Average Value Number Average Value Number Average Value
LOANS ORIGINATED 121 $343,626 154 $283,291 859 $270,761 31 $205,813 2 $244,390 67 $193,135 APPLICATIONS APPROVED, NOT ACCEPTED 16 $369,333 27 $225,394 82 $290,834 6 $32,718 0 $0 9 $136,603 APPLICATIONS DENIED 16 $321,419 26 $214,179 226 $312,074 10 $57,544 0 $0 32 $230,094 APPLICATIONS WITHDRAWN 8 $271,295 28 $233,751 162 $287,273 8 $243,774 0 $0 17 $244,856 FILES CLOSED FOR INCOMPLETENESS 4 $287,802 13 $248,246 42 $286,153 5 $69,372 0 $0 12 $190,862
Aggregated Statistics For Year 2008(Based on 10 partial tracts) A) FHA, FSA/RHS & VA B) Conventional C) Refinancings D) Home Improvement Loans E) Loans on Dwellings For 5+ Families F) Non-occupant Loans on G) Loans On Manufactured Number Average Value Number Average Value Number Average Value Number Average Value Number Average Value Number Average Value Number Average Value
LOANS ORIGINATED 60 $316,998 232 $276,149 374 $289,566 16 $189,206 2 $5,442,260 85 $210,492 2 $54,280 APPLICATIONS APPROVED, NOT ACCEPTED 8 $337,964 41 $294,280 75 $306,940 10 $81,329 0 $0 14 $265,846 0 $0 APPLICATIONS DENIED 6 $203,770 72 $284,953 207 $325,775 28 $181,228 0 $0 22 $220,791 2 $135,280 APPLICATIONS WITHDRAWN 7 $318,871 44 $263,421 87 $330,259 6 $215,680 0 $0 18 $198,791 0 $0 FILES CLOSED FOR INCOMPLETENESS 6 $291,235 6 $190,348 17 $343,081 0 $0 0 $0 0 $0 0 $0
Aggregated Statistics For Year 2007(Based on 10 partial tracts) A) FHA, FSA/RHS & VA B) Conventional C) Refinancings D) Home Improvement Loans F) Non-occupant Loans on G) Loans On Manufactured Number Average Value Number Average Value Number Average Value Number Average Value Number Average Value Number Average Value
LOANS ORIGINATED 5 $342,518 414 $274,409 650 $285,456 61 $159,532 93 $252,967 4 $35,685 APPLICATIONS APPROVED, NOT ACCEPTED 2 $185,310 56 $299,362 156 $298,160 9 $151,012 13 $273,108 0 $0 APPLICATIONS DENIED 0 $0 112 $270,542 427 $341,541 77 $170,988 34 $238,754 4 $66,050 APPLICATIONS WITHDRAWN 0 $0 39 $295,654 179 $335,648 20 $211,010 7 $274,046 0 $0 FILES CLOSED FOR INCOMPLETENESS 0 $0 5 $198,518 50 $367,751 2 $325,505 3 $348,057 0 $0
Aggregated Statistics For Year 2006(Based on 10 partial tracts) A) FHA, FSA/RHS & VA B) Conventional C) Refinancings D) Home Improvement Loans F) Non-occupant Loans on G) Loans On Manufactured Number Average Value Number Average Value Number Average Value Number Average Value Number Average Value Number Average Value
LOANS ORIGINATED 0 $0 542 $284,002 1,076 $290,336 112 $174,361 155 $264,629 0 $0 APPLICATIONS APPROVED, NOT ACCEPTED 0 $0 112 $274,381 165 $294,296 17 $156,798 23 $223,087 0 $0 APPLICATIONS DENIED 0 $0 117 $284,189 406 $340,635 56 $213,464 32 $315,172 2 $75,615 APPLICATIONS WITHDRAWN 2 $382,785 99 $274,806 270 $333,445 25 $274,802 24 $222,968 0 $0 FILES CLOSED FOR INCOMPLETENESS 0 $0 17 $288,692 64 $297,465 4 $32,275 3 $289,233 0 $0
Aggregated Statistics For Year 2005(Based on 10 partial tracts) A) FHA, FSA/RHS & VA B) Conventional C) Refinancings D) Home Improvement Loans E) Loans on Dwellings For 5+ Families F) Non-occupant Loans on G) Loans On Manufactured Number Average Value Number Average Value Number Average Value Number Average Value Number Average Value Number Average Value Number Average Value
LOANS ORIGINATED 1 $233,580 746 $291,201 1,309 $296,342 150 $216,433 6 $1,258,840 180 $266,115 3 $326,470 APPLICATIONS APPROVED, NOT ACCEPTED 0 $0 150 $283,318 189 $308,356 17 $203,365 0 $0 26 $294,773 6 $78,172 APPLICATIONS DENIED 0 $0 161 $285,567 361 $324,346 78 $201,321 0 $0 30 $265,791 0 $0 APPLICATIONS WITHDRAWN 0 $0 117 $283,161 356 $307,716 59 $258,848 0 $0 34 $258,291 0 $0 FILES CLOSED FOR INCOMPLETENESS 0 $0 26 $285,850 121 $302,476 2 $34,650 0 $0 8 $247,744 0 $0
Aggregated Statistics For Year 2004(Based on 10 partial tracts) A) FHA, FSA/RHS & VA B) Conventional C) Refinancings D) Home Improvement Loans F) Non-occupant Loans on G) Loans On Manufactured Number Average Value Number Average Value Number Average Value Number Average Value Number Average Value Number Average Value
LOANS ORIGINATED 7 $258,001 771 $280,033 1,594 $251,391 104 $183,804 214 $241,710 4 $44,860 APPLICATIONS APPROVED, NOT ACCEPTED 0 $0 89 $307,213 279 $249,961 11 $175,861 13 $254,578 1 $59,900 APPLICATIONS DENIED 5 $209,278 102 $280,601 378 $268,362 57 $172,611 26 $309,696 2 $168,245 APPLICATIONS WITHDRAWN 0 $0 96 $300,076 414 $261,108 40 $135,221 25 $224,383 0 $0 FILES CLOSED FOR INCOMPLETENESS 0 $0 37 $256,307 59 $280,557 12 $84,574 2 $254,800 0 $0
Aggregated Statistics For Year 2003(Based on 10 partial tracts) A) FHA, FSA/RHS & VA B) Conventional C) Refinancings D) Home Improvement Loans E) Loans on Dwellings For 5+ Families F) Non-occupant Loans on Number Average Value Number Average Value Number Average Value Number Average Value Number Average Value Number Average Value
LOANS ORIGINATED 2 $191,820 749 $228,293 3,597 $200,805 79 $59,351 1 $5,655,810 334 $184,880 APPLICATIONS APPROVED, NOT ACCEPTED 4 $171,940 91 $233,339 426 $196,311 21 $71,826 0 $0 18 $231,086 APPLICATIONS DENIED 2 $293,265 91 $210,329 467 $223,609 44 $82,899 0 $0 33 $188,553 APPLICATIONS WITHDRAWN 2 $210,425 79 $208,318 559 $205,976 21 $56,250 0 $0 29 $177,634 FILES CLOSED FOR INCOMPLETENESS 0 $0 18 $302,532 88 $218,135 6 $31,947 0 $0 6 $197,742
Aggregated Statistics For Year 2002(Based on 10 partial tracts) A) FHA, FSA/RHS & VA B) Conventional C) Refinancings D) Home Improvement Loans E) Loans on Dwellings For 5+ Families F) Non-occupant Loans on Number Average Value Number Average Value Number Average Value Number Average Value Number Average Value Number Average Value
LOANS ORIGINATED 20 $153,433 742 $202,451 2,661 $186,859 69 $62,775 1 $111,200 219 $165,676 APPLICATIONS APPROVED, NOT ACCEPTED 4 $191,885 75 $198,094 355 $188,104 41 $43,155 0 $0 19 $143,106 APPLICATIONS DENIED 1 $108,980 48 $181,794 294 $177,315 31 $62,318 0 $0 27 $145,979 APPLICATIONS WITHDRAWN 0 $0 58 $185,584 342 $189,176 15 $62,018 0 $0 15 $158,186 FILES CLOSED FOR INCOMPLETENESS 0 $0 10 $226,933 135 $201,954 0 $0 0 $0 7 $164,141
Aggregated Statistics For Year 2001(Based on 10 partial tracts) A) FHA, FSA/RHS & VA B) Conventional C) Refinancings D) Home Improvement Loans F) Non-occupant Loans on Number Average Value Number Average Value Number Average Value Number Average Value Number Average Value
LOANS ORIGINATED 67 $163,657 566 $176,190 1,959 $171,114 91 $53,592 164 $141,458 APPLICATIONS APPROVED, NOT ACCEPTED 2 $124,265 65 $176,953 239 $171,295 33 $58,058 17 $157,536 APPLICATIONS DENIED 3 $214,430 71 $129,738 412 $166,645 40 $78,556 32 $167,268 APPLICATIONS WITHDRAWN 6 $144,572 64 $163,460 333 $171,166 28 $50,426 19 $173,337 FILES CLOSED FOR INCOMPLETENESS 1 $99,520 7 $180,063 111 $188,575 7 $53,531 8 $130,411
Aggregated Statistics For Year 2000(Based on 10 partial tracts) A) FHA, FSA/RHS & VA B) Conventional C) Refinancings D) Home Improvement Loans E) Loans on Dwellings For 5+ Families F) Non-occupant Loans on Number Average Value Number Average Value Number Average Value Number Average Value Number Average Value Number Average Value
LOANS ORIGINATED 60 $162,487 550 $156,442 549 $123,453 119 $41,503 0 $0 56 $114,969 APPLICATIONS APPROVED, NOT ACCEPTED 1 $120,650 68 $152,549 65 $107,437 39 $45,398 0 $0 3 $162,457 APPLICATIONS DENIED 6 $139,285 93 $174,687 158 $130,732 31 $42,748 0 $0 17 $126,136 APPLICATIONS WITHDRAWN 7 $181,283 65 $145,352 118 $106,434 24 $54,215 2 $13,102,600 10 $135,688 FILES CLOSED FOR INCOMPLETENESS 1 $80,620 24 $169,874 48 $160,436 1 $26,690 0 $0 2 $141,540
Aggregated Statistics For Year 1999(Based on 5 partial tracts) A) FHA, FSA/RHS & VA B) Conventional C) Refinancings D) Home Improvement Loans E) Loans on Dwellings For 5+ Families F) Non-occupant Loans on Number Average Value Number Average Value Number Average Value Number Average Value Number Average Value Number Average Value
LOANS ORIGINATED 51 $171,446 258 $142,394 435 $131,495 46 $31,109 3 $3,808,983 51 $112,891 APPLICATIONS APPROVED, NOT ACCEPTED 3 $160,320 25 $166,722 82 $140,591 17 $28,506 0 $0 6 $112,778 APPLICATIONS DENIED 3 $165,720 43 $144,233 129 $115,916 16 $29,091 0 $0 11 $92,748 APPLICATIONS WITHDRAWN 4 $153,692 40 $129,958 97 $137,814 6 $38,385 0 $0 6 $106,075 FILES CLOSED FOR INCOMPLETENESS 0 $0 8 $158,824 34 $139,226 1 $15,040 0 $0 1 $84,540
Private Mortgage Insurance Companies Aggregated Statistics For Year 2009(Based on 10 partial tracts) A) Conventional B) Refinancings C) Non-occupant Loans on Number Average Value Number Average Value Number Average Value
LOANS ORIGINATED 28 $308,751 10 $384,328 0 $0 APPLICATIONS APPROVED, NOT ACCEPTED 8 $276,992 6 $394,283 1 $89,010 APPLICATIONS DENIED 3 $265,923 2 $374,675 0 $0 APPLICATIONS WITHDRAWN 1 $225,180 4 $315,075 0 $0 FILES CLOSED FOR INCOMPLETENESS 0 $0 0 $0 0 $0
Aggregated Statistics For Year 2008(Based on 10 partial tracts) A) Conventional B) Refinancings C) Non-occupant Loans on Number Average Value Number Average Value Number Average Value
LOANS ORIGINATED 51 $342,439 10 $404,037 0 $0 APPLICATIONS APPROVED, NOT ACCEPTED 14 $315,343 26 $352,250 4 $264,168 APPLICATIONS DENIED 8 $151,694 4 $341,968 1 $612,900 APPLICATIONS WITHDRAWN 0 $0 0 $0 0 $0 FILES CLOSED FOR INCOMPLETENESS 2 $499,165 2 $381,865 2 $381,865
Aggregated Statistics For Year 2007(Based on 10 partial tracts) A) Conventional B) Refinancings C) Non-occupant Loans on Number Average Value Number Average Value Number Average Value
LOANS ORIGINATED 26 $332,604 14 $373,947 2 $242,145 APPLICATIONS APPROVED, NOT ACCEPTED 4 $422,065 10 $479,175 2 $344,125 APPLICATIONS DENIED 2 $412,355 2 $400,730 0 $0 APPLICATIONS WITHDRAWN 0 $0 4 $401,298 0 $0 FILES CLOSED FOR INCOMPLETENESS 0 $0 0 $0 0 $0
Aggregated Statistics For Year 2006(Based on 8 partial tracts) A) Conventional B) Refinancings Number Average Value Number Average Value
LOANS ORIGINATED 5 $408,472 6 $459,437 APPLICATIONS APPROVED, NOT ACCEPTED 0 $0 1 $331,380 APPLICATIONS DENIED 1 $285,230 0 $0 APPLICATIONS WITHDRAWN 0 $0 5 $549,882 FILES CLOSED FOR INCOMPLETENESS 0 $0 0 $0
Aggregated Statistics For Year 2005(Based on 10 partial tracts) A) Conventional B) Refinancings Number Average Value Number Average Value
LOANS ORIGINATED 13 $346,600 9 $370,656 APPLICATIONS APPROVED, NOT ACCEPTED 1 $137,700 0 $0 APPLICATIONS DENIED 0 $0 0 $0 APPLICATIONS WITHDRAWN 2 $293,270 2 $512,745 FILES CLOSED FOR INCOMPLETENESS 0 $0 0 $0
Aggregated Statistics For Year 2004(Based on 10 partial tracts) A) Conventional B) Refinancings C) Non-occupant Loans on Number Average Value Number Average Value Number Average Value
LOANS ORIGINATED 17 $296,595 8 $381,918 5 $302,104 APPLICATIONS APPROVED, NOT ACCEPTED 3 $188,433 2 $217,030 0 $0 APPLICATIONS DENIED 0 $0 0 $0 0 $0 APPLICATIONS WITHDRAWN 0 $0 0 $0 0 $0 FILES CLOSED FOR INCOMPLETENESS 0 $0 0 $0 0 $0
Aggregated Statistics For Year 2003(Based on 10 partial tracts) A) Conventional B) Refinancings C) Non-occupant Loans on Number Average Value Number Average Value Number Average Value
LOANS ORIGINATED 48 $257,539 44 $263,178 9 $275,930 APPLICATIONS APPROVED, NOT ACCEPTED 7 $314,523 16 $292,158 0 $0 APPLICATIONS DENIED 1 $116,200 0 $0 0 $0 APPLICATIONS WITHDRAWN 2 $351,185 4 $346,145 0 $0 FILES CLOSED FOR INCOMPLETENESS 0 $0 0 $0 0 $0
Aggregated Statistics For Year 2002(Based on 10 partial tracts) A) Conventional B) Refinancings C) Non-occupant Loans on Number Average Value Number Average Value Number Average Value
LOANS ORIGINATED 97 $232,522 50 $236,898 8 $245,004 APPLICATIONS APPROVED, NOT ACCEPTED 13 $242,188 28 $251,234 2 $116,065 APPLICATIONS DENIED 0 $0 0 $0 0 $0 APPLICATIONS WITHDRAWN 6 $261,258 10 $279,121 2 $283,080 FILES CLOSED FOR INCOMPLETENESS 0 $0 0 $0 0 $0
Aggregated Statistics For Year 2001(Based on 10 partial tracts) A) Conventional B) Refinancings C) Non-occupant Loans on Number Average Value Number Average Value Number Average Value
LOANS ORIGINATED 108 $214,985 62 $212,088 13 $163,982 APPLICATIONS APPROVED, NOT ACCEPTED 19 $212,225 16 $231,146 0 $0 APPLICATIONS DENIED 2 $246,140 6 $219,602 0 $0 APPLICATIONS WITHDRAWN 4 $118,892 6 $233,643 3 $195,530 FILES CLOSED FOR INCOMPLETENESS 0 $0 0 $0 0 $0
Aggregated Statistics For Year 2000(Based on 10 partial tracts) A) Conventional B) Refinancings C) Non-occupant Loans on Number Average Value Number Average Value Number Average Value
LOANS ORIGINATED 144 $185,127 34 $194,159 7 $168,041 APPLICATIONS APPROVED, NOT ACCEPTED 24 $190,728 0 $0 0 $0 APPLICATIONS DENIED 4 $181,498 5 $233,064 2 $140,595 APPLICATIONS WITHDRAWN 8 $142,075 0 $0 2 $131,160 FILES CLOSED FOR INCOMPLETENESS 2 $137,575 0 $0 0 $0
Aggregated Statistics For Year 1999(Based on 5 partial tracts) A) Conventional B) Refinancings C) Non-occupant Loans on Number Average Value Number Average Value Number Average Value
LOANS ORIGINATED 84 $175,510 41 $165,400 5 $142,680 APPLICATIONS APPROVED, NOT ACCEPTED 9 $155,822 9 $142,538 2 $104,610 APPLICATIONS DENIED 5 $147,518 1 $229,500 0 $0 APPLICATIONS WITHDRAWN 3 $132,673 2 $115,820 0 $0 FILES CLOSED FOR INCOMPLETENESS 0 $0 0 $0 0 $0
2005 - 2018 National Fire Incident Reporting System (NFIRS) incidents See full 2006 National Fire Incident Reporting System statistics for zip code 92119, California
Most common first names in zip code 92119 among deceased individuals Name Count Lived (average)
John 116 75.6 years Mary 112 78.5 years Robert 100 74.3 years William 99 75.5 years James 75 71.7 years Charles 75 75.9 years Joseph 70 75.8 years George 57 78.1 years Dorothy 57 79.5 years Richard 54 68.2 years
Most common last names in zip code 92119 among deceased individuals Last name Count Lived (average)
Smith 42 77.7 years Miller 31 79.8 years Brown 25 74.6 years Johnson 22 77.8 years Jones 22 74.0 years Davis 20 77.9 years Moore 19 76.3 years Williams 18 78.3 years Anderson 17 80.2 years Wilson 16 76.9 years
Businesses in zip code 92119
Name Count Name Count
7-Eleven 1 McDonald's 1 Albertsons 1 Papa John's Pizza 1 Blockbuster 1 Rite Aid 1 CVS 1 Starbucks 1 Carl\s Jr. 1 Subway 1 FedEx 3 True Value 1 GNC 1 UPS 2 GameStop 1 Walgreens 1 H&R Block 1 Wendy's 1 LA Fitness 1
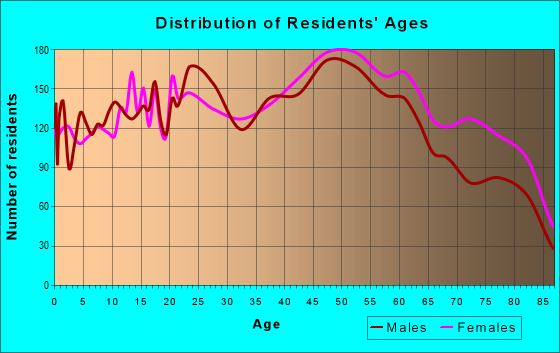
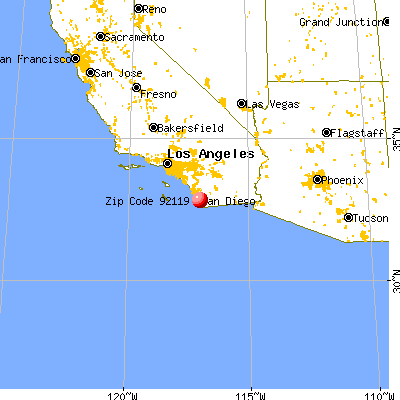


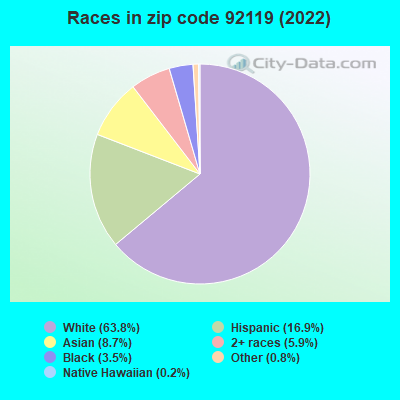


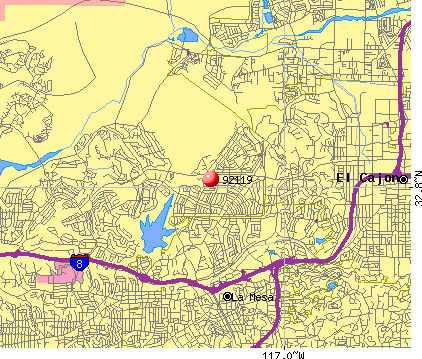 Nearest zip codes: 91942, 92120, 92071, 92124, 92020, 92115.
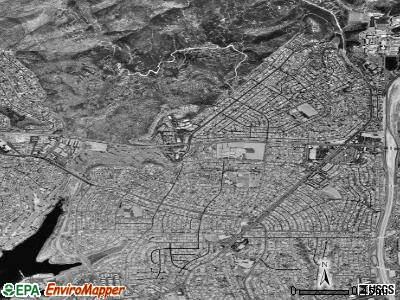
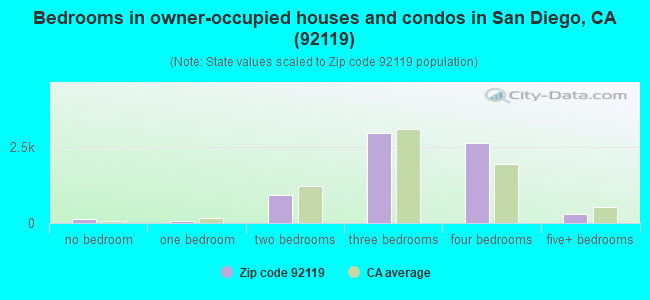
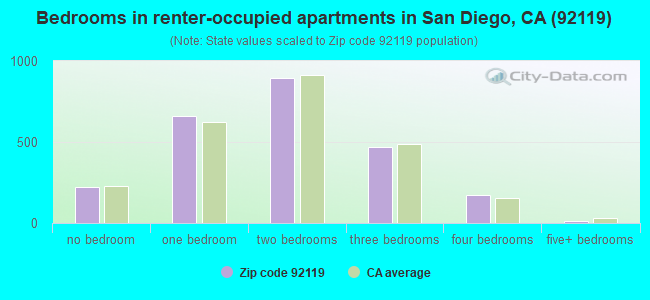
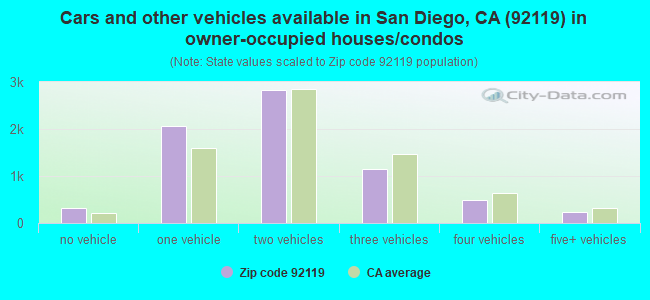
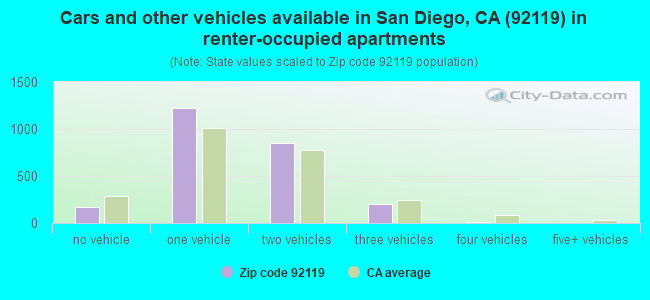


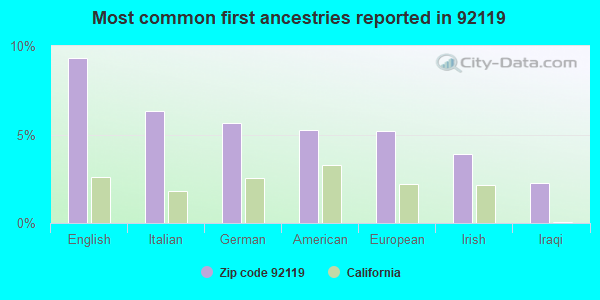


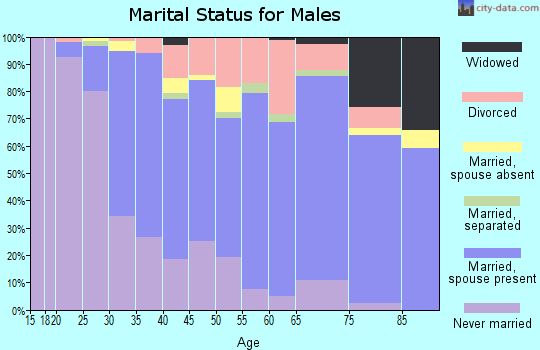
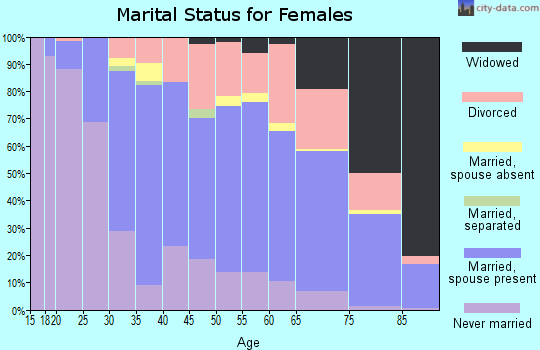
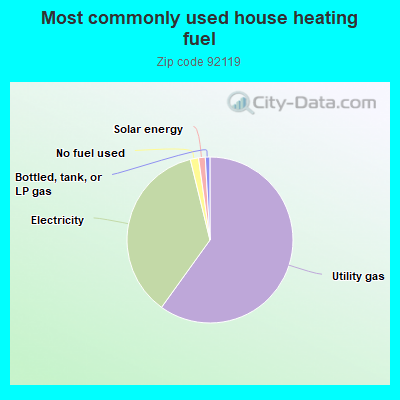
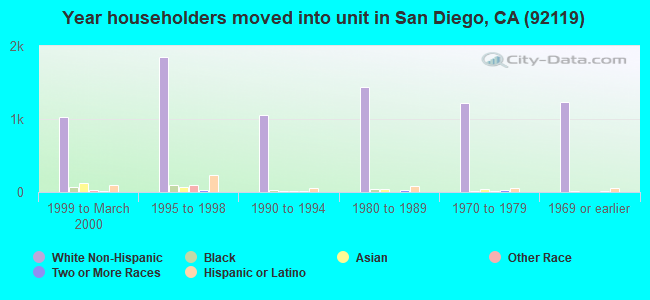
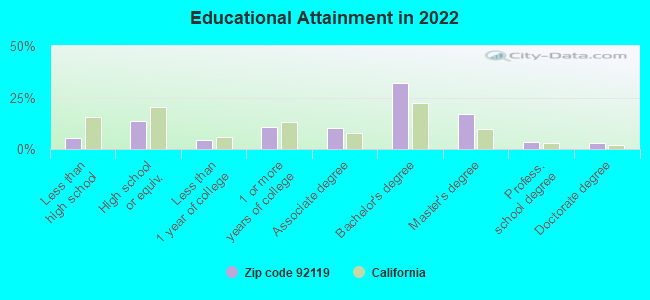
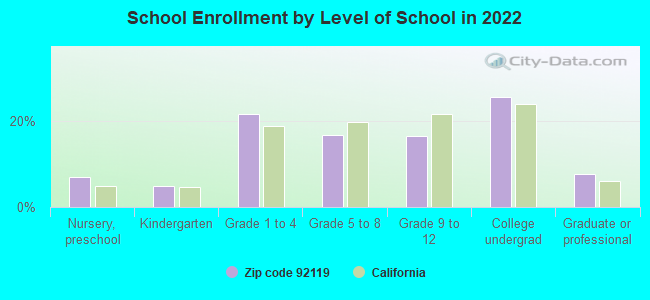
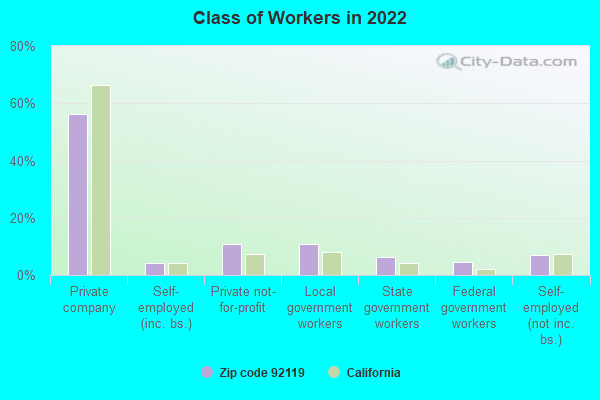
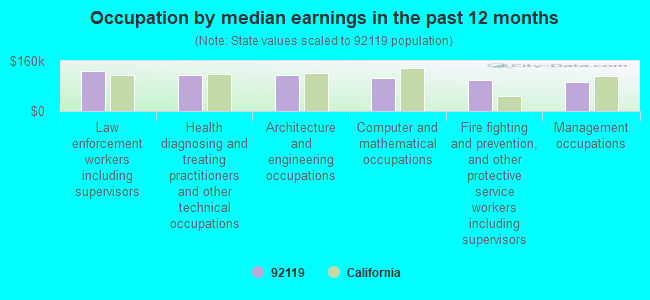
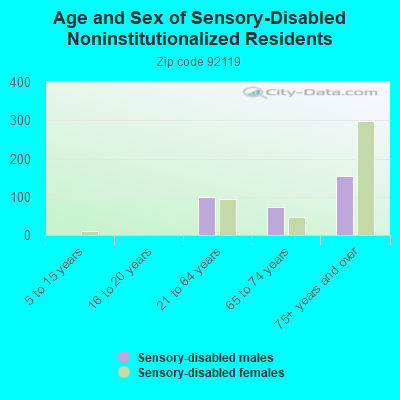

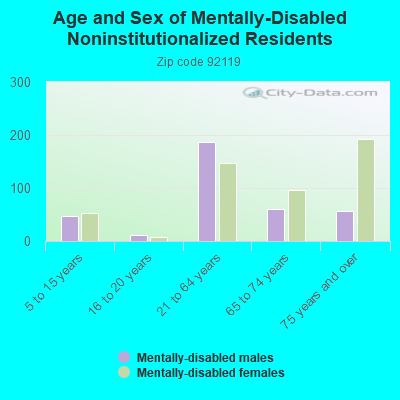
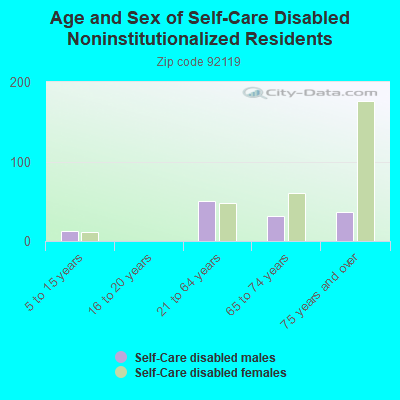
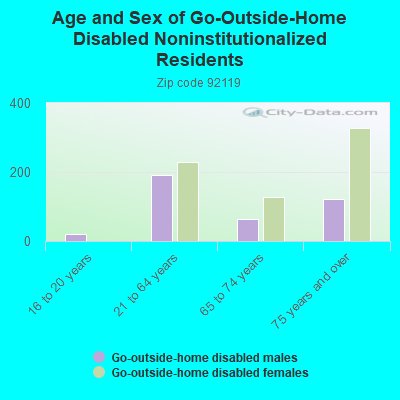
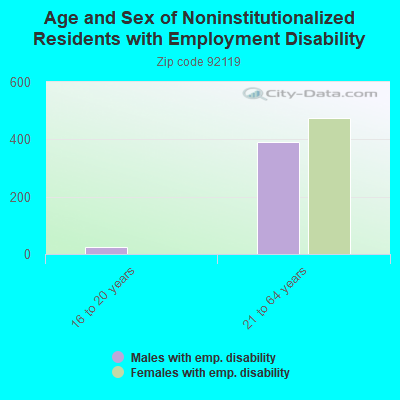
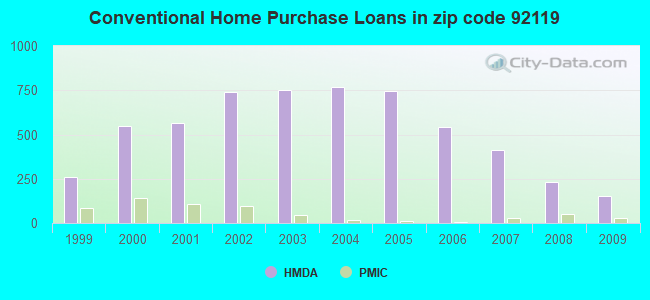

 Based on the data from the years 2005 - 2018 the average number of fires per year is 13. The highest number of reported fires - 30 took place in 2011, and the least - 0 in 2008. The data has a rising trend.
 When looking into fire subcategories, the most reports belonged to: Structure Fires (48.7%), and Outside Fires (31.0%).