Estimated zip code population in 2022: 36,864 Zip code population in 2010: 30,047 Zip code population in 2000: 18,971
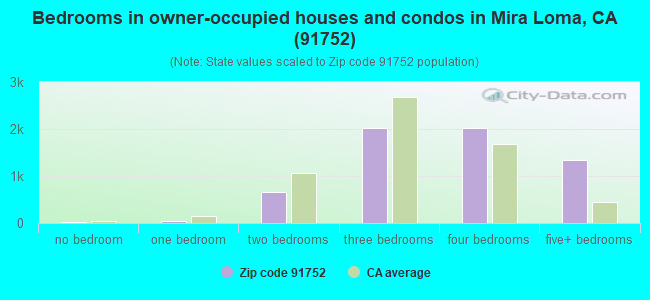
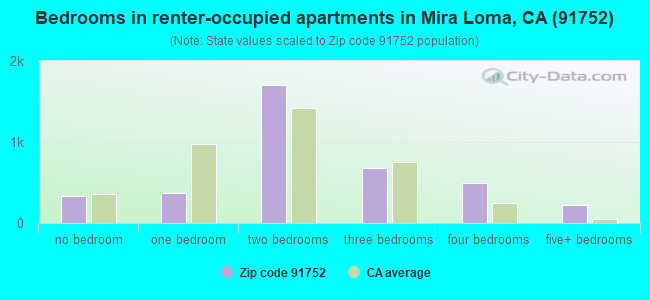
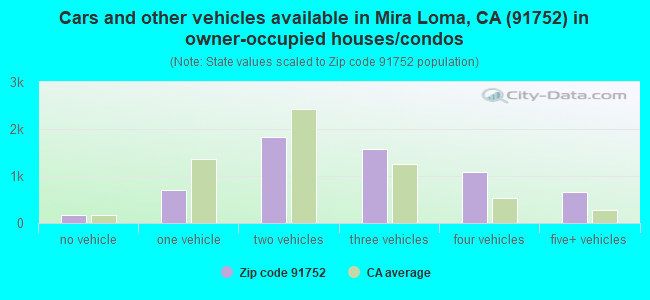
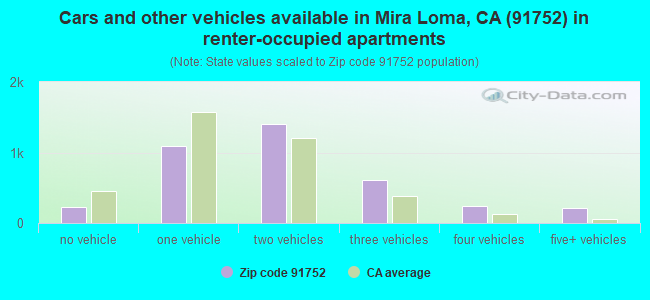
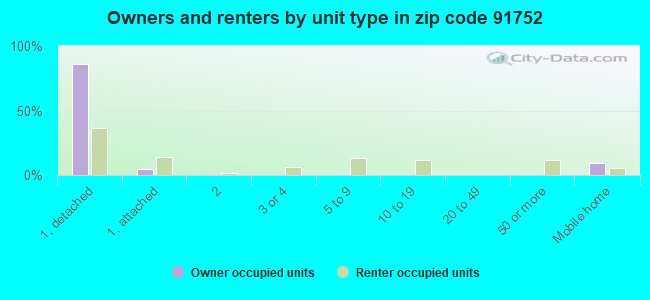
Houses and condos: 10,233 Renter-occupied apartments: 3,796
% of renters here:
39%
State:
44%
March 2022 cost of living index in zip code 91752: 82.4 (low, U.S. average is 100)
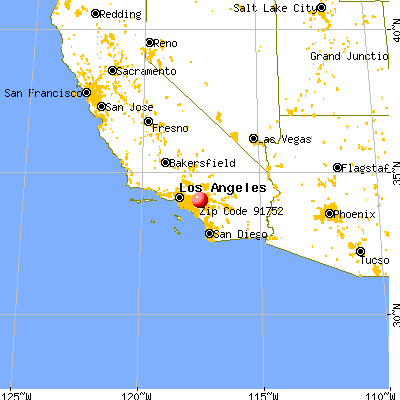
Land area: 15.1 sq. mi. Water area: 0.2 sq. mi.
Population density: 2,443 people per square mile
(low).
OSM Map
General Map
Google Map
MSN Map
OSM Map
General Map
Google Map
MSN Map
OSM Map
General Map
Google Map
MSN Map
OSM Map
General Map
Google Map
MSN Map
Please wait while loading the map...
Real estate property taxes paid for housing units in 2022:
This zip code:
0.8% ($4,904)
California:
0.7% ($4,831)
Median real estate property taxes paid for housing units with mortgages in 2022: $6,417 (1.0%) Median real estate property taxes paid for housing units with no mortgage in 2022: $2,309 (0.4%)
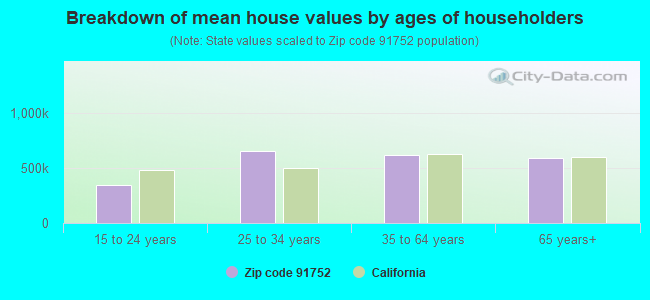
Estimated median house/condo value in 2022: $633,484
91752:
$633,484
California:
$715,900
According to our research of California and other state lists, there were 48 registered sex offenders living in 91752 zip code as of June 01, 2024. The ratio of all residents to sex offenders in zip code 91752 is 630 to 1. The ratio of registered sex offenders to all residents in this zip code is near the state average.
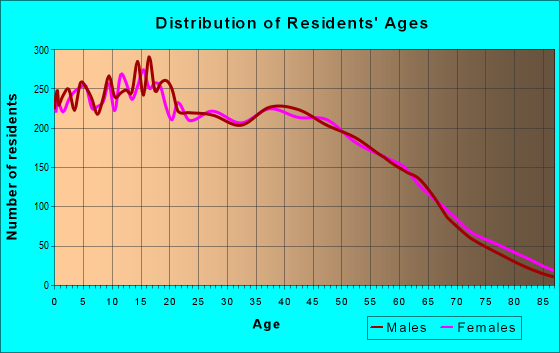
Median resident age:
This zip code:
35.6 years
California median age:
37.9 years
Average household size:
This zip code:
3.7 people
California:
2.8 people
Averages for the 2020 tax year for zip code 91752, filed in 2021:
Average Adjusted Gross Income (AGI) in 2020: $62,456 (Individual Income Tax Returns)
Here:
$62,456
State:
$95,910
Salary/wage: $57,647 (reported on 83.3% of returns)
Here:
$57,647
State:
$77,331
(% of AGI for various income ranges: 1202.1% for AGIs below $25k, 3924.8% for AGIs $25k-50k, 7464.9% for AGIs $50k-75k, 11158.1% for AGIs $75k-100k, 21354.0% for AGIs $100k-200k, 65271.0% for AGIs over 200k)
Taxable interest for individuals: $416 (reported on 29.2% of returns)
This zip code:
$416
California:
$2,294
(% of AGI for various income ranges: 7.0% for AGIs below $25k, 8.2% for AGIs $25k-50k, 14.5% for AGIs $50k-75k, 23.1% for AGIs $75k-100k, 40.9% for AGIs $100k-200k, 274.0% for AGIs over 200k)
Ordinary dividends: $1,724 (reported on 7.9% of returns)
Here:
$1,724
State:
$10,949
(% of AGI for various income ranges: 5.8% for AGIs below $25k, 10.2% for AGIs $25k-50k, 19.1% for AGIs $50k-75k, 28.0% for AGIs $75k-100k, 46.4% for AGIs $100k-200k, 298.0% for AGIs over 200k)
Net capital gain/loss in AGI: +$10,252 (reported on 9.8% of returns)
Here:
+$10,252
State:
+$49,306
(% of AGI for various income ranges: 4.9% for AGIs below $25k, 10.7% for AGIs $25k-50k, 22.5% for AGIs $50k-75k, 97.9% for AGIs $75k-100k, 221.4% for AGIs $100k-200k, 6527.5% for AGIs over 200k)
Profit/loss from business: +$9,544 (reported on 19.4% of returns)
Here:
+$9,544
State:
+$15,671
(% of AGI for various income ranges: 218.5% for AGIs below $25k, 270.5% for AGIs $25k-50k, 263.6% for AGIs $50k-75k, 264.1% for AGIs $75k-100k, 331.9% for AGIs $100k-200k, 1429.5% for AGIs over 200k)
Taxable individual retirement arrangement distribution: $15,665 (reported on 3.1% of returns)
91752:
$15,665
California:
$23,505
(% of AGI for various income ranges: 24.0% for AGIs below $25k, 29.8% for AGIs $25k-50k, 81.6% for AGIs $50k-75k, 143.9% for AGIs $75k-100k, 202.1% for AGIs $100k-200k, 533.0% for AGIs over 200k)
Self-employed (Keogh) retirement plans: $32,550 (reported on 0.1% of returns)
91752:
$32,550
California:
$30,163
(% of AGI for various income ranges: 44.9% for AGIs $100k-200k)
Total itemized deductions: $30,985 (reported on 16.4% of returns)
Here:
$30,985
State:
$39,517
(% of AGI for various income ranges: 67.4% for AGIs below $25k, 196.4% for AGIs $25k-50k, 658.6% for AGIs $50k-75k, 1331.5% for AGIs $75k-100k, 2756.6% for AGIs $100k-200k, 8665.0% for AGIs over 200k)
Charity contributions: $5,543 (reported on 13.6% of returns)
Here:
$5,543
State:
$12,598
(% of AGI for various income ranges: 3.1% for AGIs below $25k, 18.2% for AGIs $25k-50k, 83.8% for AGIs $50k-75k, 184.1% for AGIs $75k-100k, 438.2% for AGIs $100k-200k, 1615.5% for AGIs over 200k)
Taxes paid: $9,159 (reported on 16.3% of returns)
91752:
$9,159
State:
$8,807
(% of AGI for various income ranges: 16.2% for AGIs below $25k, 57.4% for AGIs $25k-50k, 203.9% for AGIs $50k-75k, 427.2% for AGIs $75k-100k, 856.9% for AGIs $100k-200k, 2000.5% for AGIs over 200k)
Earned income credit: $2,240 (reported on 17.0% of returns)
Here:
$2,240
State:
$2,074
(% of AGI for various income ranges: 100.0% for AGIs below $25k, 76.7% for AGIs $25k-50k, 1.7% for AGIs $50k-75k)
Percentage of individuals using paid preparers for their 2020 taxes: 92.5%
Here:
92%
State:
92%
(% for various income ranges: 91.4% for AGIs below $25k, 92.5% for AGIs $25k-50k, 93.2% for AGIs $50k-75k, 92.6% for AGIs $75k-100k, 93.2% for AGIs $100k-200k, 96.7% for AGIs over 200k)
Averages for the 2012 tax year for zip code 91752, filed in 2013:
Average Adjusted Gross Income (AGI) in 2012: $46,082 (Individual Income Tax Returns)
Here:
$46,082
State:
$72,726
Salary/wage: $45,311 (reported on 85.2% of returns)
Here:
$45,311
State:
$59,079
(% of AGI for various income ranges: 73.6% for AGIs below $25k, 82.7% for AGIs $25k-50k, 85.0% for AGIs $50k-75k, 86.1% for AGIs $75k-100k, 88.6% for AGIs $100k-200k, 74.6% for AGIs over 200k)
Taxable interest for individuals: $339 (reported on 27.8% of returns)
This zip code:
$339
California:
$2,146
(% of AGI for various income ranges: 0.3% for AGIs below $25k, 0.2% for AGIs $25k-50k, 0.3% for AGIs $50k-75k, 0.2% for AGIs $75k-100k, 0.2% for AGIs $100k-200k, 0.2% for AGIs over 200k)
Ordinary dividends: $1,378 (reported on 6.6% of returns)
Here:
$1,378
State:
$9,308
(% of AGI for various income ranges: 0.4% for AGIs below $25k, 0.1% for AGIs $25k-50k, 0.2% for AGIs $50k-75k, 0.2% for AGIs $75k-100k, 0.1% for AGIs $100k-200k, 0.3% for AGIs over 200k)
Net capital gain/loss in AGI: +$2,411 (reported on 5.9% of returns)
Here:
+$2,411
State:
+$30,460
(% of AGI for various income ranges: 0.5% for AGIs $100k-200k, 3.6% for AGIs over 200k)
Profit/loss from business: +$10,372 (reported on 18.3% of returns)
Here:
+$10,372
State:
+$17,064
(% of AGI for various income ranges: 14.7% for AGIs below $25k, 5.8% for AGIs $25k-50k, 3.2% for AGIs $50k-75k, 1.2% for AGIs $75k-100k, 1.0% for AGIs $100k-200k, 2.7% for AGIs over 200k)
Taxable individual retirement arrangement distribution: $12,954 (reported on 3.9% of returns)
91752:
$12,954
California:
$19,557
(% of AGI for various income ranges: 1.1% for AGIs below $25k, 1.0% for AGIs $25k-50k, 1.0% for AGIs $50k-75k, 1.4% for AGIs $75k-100k, 1.2% for AGIs $100k-200k)
Total itemized deductions: $24,849 (31% of AGI, reported on 36.0% of returns)
Here:
$24,849
State:
$34,004
Here:
31.1% of AGI
State:
22.7% of AGI
(% of AGI for various income ranges: 10.2% for AGIs below $25k, 15.2% for AGIs $25k-50k, 21.0% for AGIs $50k-75k, 23.4% for AGIs $75k-100k, 23.0% for AGIs $100k-200k, 19.7% for AGIs over 200k)
Charity contributions: $2,753 (reported on 29.1% of returns)
Here:
$2,753
State:
$4,659
(% of AGI for various income ranges: 0.6% for AGIs below $25k, 1.2% for AGIs $25k-50k, 2.0% for AGIs $50k-75k, 2.1% for AGIs $75k-100k, 2.3% for AGIs $100k-200k, 1.5% for AGIs over 200k)
Taxes paid: $7,472 (reported on 35.9% of returns)
91752:
$7,472
State:
$14,448
(% of AGI for various income ranges: 2.0% for AGIs below $25k, 3.4% for AGIs $25k-50k, 5.6% for AGIs $50k-75k, 6.9% for AGIs $75k-100k, 8.0% for AGIs $100k-200k, 8.7% for AGIs over 200k)
Earned income credit: $2,480 (reported on 23.6% of returns)
Here:
$2,480
State:
$2,286
(% of AGI for various income ranges: 8.2% for AGIs below $25k, 1.5% for AGIs $25k-50k)
Percentage of individuals using paid preparers for their 2012 taxes: 71.7%
Here:
72%
State:
64%
(% for various income ranges: 68.4% for AGIs below $25k, 73.0% for AGIs $25k-50k, 73.8% for AGIs $50k-75k, 75.0% for AGIs $75k-100k, 75.4% for AGIs $100k-200k, 83.3% for AGIs over 200k)
Averages for the 2004 tax year for zip code 91752, filed in 2005:
Average Adjusted Gross Income (AGI) in 2004: $39,819 (Individual Income Tax Returns)
Here:
$39,819
State:
$58,600
Salary/wage: $38,415 (reported on 87.5% of returns)
Here:
$38,415
State:
$49,455
(% of AGI for various income ranges: 105.2% for AGIs below $10k, 80.4% for AGIs $10k-25k, 85.9% for AGIs $25k-50k, 87.9% for AGIs $50k-75k, 89.9% for AGIs $75k-100k, 75.7% for AGIs over 100k)
Taxable interest for individuals: $522 (reported on 35.9% of returns)
This zip code:
$522
California:
$2,365
(% of AGI for various income ranges: 2.4% for AGIs below $10k, 0.8% for AGIs $10k-25k, 0.4% for AGIs $25k-50k, 0.3% for AGIs $50k-75k, 0.3% for AGIs $75k-100k, 0.5% for AGIs over 100k)
Taxable dividends: $941 (reported on 9.5% of returns)
Here:
$941
State:
$4,746
(% of AGI for various income ranges: 0.8% for AGIs below $10k, 0.3% for AGIs $10k-25k, 0.2% for AGIs $25k-50k, 0.2% for AGIs $50k-75k, 0.2% for AGIs $75k-100k, 0.2% for AGIs over 100k)
Net capital gain/loss: +$11,839 (reported on 7.4% of returns)
Here:
+$11,839
State:
+$23,418
(% of AGI for various income ranges: 1.3% for AGIs below $10k, 0.1% for AGIs $10k-25k, 0.3% for AGIs $25k-50k, 0.6% for AGIs $50k-75k, 0.8% for AGIs $75k-100k, 8.0% for AGIs over 100k)
Profit/loss from business: +$10,243 (reported on 17.6% of returns)
Here:
+$10,243
State:
+$16,826
(% of AGI for various income ranges: 15.0% for AGIs below $10k, 9.4% for AGIs $10k-25k, 6.4% for AGIs $25k-50k, 2.8% for AGIs $50k-75k, 2.6% for AGIs $75k-100k, 2.2% for AGIs over 100k)
IRA payment deduction: $2,829 (reported on 1.8% of returns)
91752:
$2,829
California:
$3,192
(% of AGI for various income ranges: 0.2% for AGIs $10k-25k, 0.2% for AGIs $25k-50k, 0.1% for AGIs $50k-75k, 0.1% for AGIs $75k-100k, 0.1% for AGIs over 100k)
Self-employed pension: $7,379 (reported on 0.3% of returns)
Here:
$7,379
California:
$17,688
Total itemized deductions: $22,602 (34% of AGI, reported on 40.0% of returns)
Here:
$22,602
State:
$28,113
Here:
33.9% of AGI
State:
25.3% of AGI
(% of AGI for various income ranges: 15.4% for AGIs below $10k, 12.4% for AGIs $10k-25k, 20.9% for AGIs $25k-50k, 26.3% for AGIs $50k-75k, 27.1% for AGIs $75k-100k, 23.8% for AGIs over 100k)
Charity contributions deductions: $2,495 (4% of AGI, reported on 34.6% of returns)
Here:
$2,495
State:
$3,923
Here:
3.6% of AGI
State:
3.3% of AGI
(% of AGI for various income ranges: 0.6% for AGIs below $10k, 0.8% for AGIs $10k-25k, 1.7% for AGIs $25k-50k, 2.6% for AGIs $50k-75k, 2.9% for AGIs $75k-100k, 2.6% for AGIs over 100k)
Total tax: $4,484 (reported on 70.3% of returns)
91752:
$4,484
State:
$10,761
(% of AGI for various income ranges: 4.9% for AGIs below $10k, 3.9% for AGIs $10k-25k, 5.6% for AGIs $25k-50k, 6.9% for AGIs $50k-75k, 8.0% for AGIs $75k-100k, 13.7% for AGIs over 100k)
Earned income credit: $1,826 (reported on 19.8% of returns)
Here:
$1,826
State:
$1,763
Percentage of individuals using paid preparers for their 2004 taxes: 71.7%
Here:
72%
State:
66%
(% for various income ranges: 61.5% for AGIs below $10k, 73.1% for AGIs $10k-25k, 74.1% for AGIs $25k-50k, 73.4% for AGIs $50k-75k, 73.9% for AGIs $75k-100k, 76.4% for AGIs over 100k)
Likely homosexual households (counted as self-reported same-sex unmarried-partner households)
Lesbian couples: 0.1% of all households
Gay men: 0.2% of all households
Household received Food Stamps/SNAP in the past 12 months: 1,301 Household did not receive Food Stamps/SNAP in the past 12 months: 8,557
Women who had a birth in the past 12 months: 468 (380 now married, 86 unmarried) Women who did not have a birth in the past 12 months: 9,143 (3,969 now married, 5,159 unmarried)
Housing units in zip code 91752 with a mortgage: 4,503 (242 second mortgage, 24 home equity loan, 174 both second mortgage and home equity loan) Houses without a mortgage: 39
Median monthly owner costs for units with a mortgage: $2,599 Median monthly owner costs for units without a mortgage: $691
Residents with income below the poverty level in 2022:
This zip code:
7.5%
Whole state:
12.2%
Residents with income below 50% of the poverty level in 2022:
This zip code:
4.5%
Whole state:
6.2%
Median number of rooms in houses and condos:
Here:
6.7
State:
6.0
Median number of rooms in apartments:
Here:
4.8
State:
3.9
Notable locations in this zip code not listed on our city pages
Notable locations in zip code 91752: Mira Loma Space Center (A), Galleano Winery (B), Country Village Golf Course (C), Riverside County Fire Department Station 17 Glen Avon (D). Display/hide their locations on the map
5,097 married couples with children.
1,385 single-parent households (758 men, 627 women).
47.0% of residents of 91752 zip code speak English at home.
45.4% of residents speak Spanish at home (64% very well, 15% well, 15% not well, 6% not at all).
1.8% of residents speak other Indo-European language at home (79% very well, 20% well, 1% not well).
5.0% of residents speak Asian or Pacific Island language at home (52% very well, 31% well, 15% not well, 1% not at all).
0.4% of residents speak other language at home (46% very well, 9% well, 45% not well).
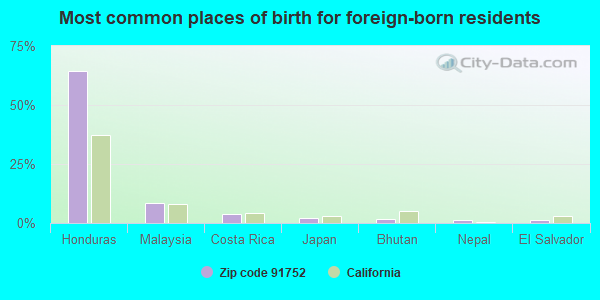
Foreign born population: 9,444 (25.6%) (41.9% of them are naturalized citizens)
This zip code:
25.6%
Whole state:
26.7%
65%Honduras
8%Malaysia
4%Costa Rica
2%Japan
2%Bhutan
1%Nepal
1%El Salvador
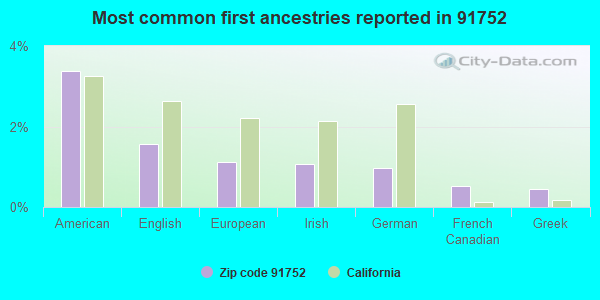
3%American
2%English
1%European
1%Irish
1%German
1%French Canadian
0%Greek
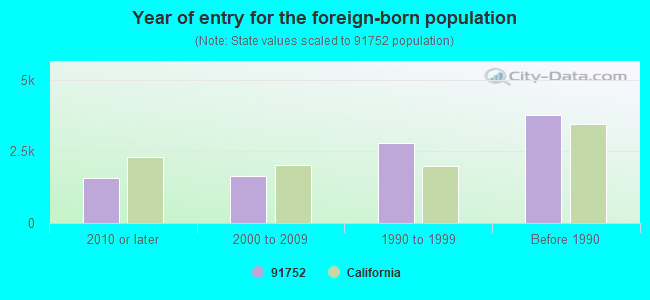
Year of entry for the foreign-born population
1,5522010 or later
1,6372000 to 2009
2,8001990 to 1999
3,764Before 1990
Major facilities with environmental interests located in this zip code:
METAL CONTAINER CORPORATION MIRA LOMA (10980 INLAND AVE. in MIRA LOMA, CA)
AIR MAJOR (AIRS/AFS) STATE MASTER (California - Hazardous Waste Tracking) - HAZARDOU WASTE PROGRAM CRITERIA AND HAZARDOUS AIR POLLUTANT INVENTORY (Inventory of air pollution sources) Small Quantity Generators, between 100 kg and 1000 kg of hazardous waste/month (Resource Conservation and Recovery Act (tracking hazardous waste)) - notification TRI REPORTER (Tracking of toxic chemicals releasing facilities) Business SIC classification: METAL CANS Business NAICS classification: METAL CAN MANUFACTURING. Alternative names: METAL CONTAINER CORPORATION MIRA LOMA, CALIFORNIA
GRAINGER INDUSTRIAL SUPPLY (4700 HAMNER AVE in MIRA LOMA, CA)
STATE MASTER (California - Hazardous Waste Tracking) - HAZARDOU WASTE PROGRAM Large Quantity Generators, more that 1000 kg of hazardous waste/month (Resource Conservation and Recovery Act (tracking hazardous waste)) Organizations: W W GRAINGER (CONTACT/OPERATOR)
ADVANCE BUSINESS FORMS INCORPORATED (3810 WABASH DRIVE in MIRA LOMA, CA)
STATE MASTER (California - Hazardous Waste Tracking) - HAZARDOU WASTE PROGRAM CRITERIA AND HAZARDOUS AIR POLLUTANT INVENTORY (Inventory of air pollution sources) Small Quantity Generators, between 100 kg and 1000 kg of hazardous waste/month (Resource Conservation and Recovery Act (tracking hazardous waste)) - notification Business SIC classification: COMMERCIAL PRINTING, LITHOGRAPHIC Business NAICS classification: COMMERCIAL LITHOGRAPHIC PRINTING.; OTHER COMMERCIAL PRINTING. Organizations: NICHOLAS KOSTA (CONTACT/OWNER)
Alternative names: ADVANCE BUSINESS GRAPHICS
HARTE-HANKS CALIFORNIA CDM INCORPORATED (3885 WABASH DRIVE in MIRA LOMA, CA)
STATE MASTER (California - Hazardous Waste Tracking) - HAZARDOU WASTE PROGRAM CRITERIA AND HAZARDOUS AIR POLLUTANT INVENTORY (Inventory of air pollution sources) Small Quantity Generators, between 100 kg and 1000 kg of hazardous waste/month (Resource Conservation and Recovery Act (tracking hazardous waste)) - notification Business SIC classification: NEWSPAPERS: PUBLISHING, OR PUBLISHING AND PRINTING Organizations: WABASH PROPERTY CO (CONTACT/OWNER)
Alternative names: HARTE HANKS CAL CDM INC,HARTE, HARTE-HANKS COMPRINT
G E LIGHTING (11600 PHILADELPHIA in MIRA LOMA, CA)
STATE MASTER (California - Hazardous Waste Tracking) - HAZARDOU WASTE PROGRAM Large Quantity Generators, more that 1000 kg of hazardous waste/month (Resource Conservation and Recovery Act (tracking hazardous waste)) - notification
CALPACO PAPER (3155 UNIVERSE CT in MIRA LOMA, CA)
STATE MASTER (California - Hazardous Waste Tracking) - HAZARDOU WASTE PROGRAM Small Quantity Generators, between 100 kg and 1000 kg of hazardous waste/month (Resource Conservation and Recovery Act (tracking hazardous waste)) - notification
CAL MOLD INC (3900 HAMNER AVE in MIRA LOMA, CA)
STATE MASTER (California - Hazardous Waste Tracking) - HAZARDOU WASTE PROGRAM Small Quantity Generators, between 100 kg and 1000 kg of hazardous waste/month (Resource Conservation and Recovery Act (tracking hazardous waste)) - notification
JURUPA VALLEY HIGH (10551 BELLEGRAVE AVE. in MIRA LOMA, CA)
(National Center for Education Statistics) - STATE ID-3330412 Organizations: JURUPA UNIFIED (SCHOOL DISTRICT)
ELIMINATOR BOATS INC (10795 SAN SEVAINE in MIRA LOMA, CA)
CRITERIA AND HAZARDOUS AIR POLLUTANT INVENTORY (Inventory of air pollution sources) Large Quantity Generators, more that 1000 kg of hazardous waste/month (Resource Conservation and Recovery Act (tracking hazardous waste)) TRI REPORTER (Tracking of toxic chemicals releasing facilities) Business SIC classification: BOAT BUILDING AND REPAIRING; MANUFACTURING INDUSTRIES Organizations: ROBERT LEACH (CONTACT/OPERATOR)
Alternative names: ELIMINATOR CUSTOM BOATS
C & R SPECIALTIES (10225 SAN SEVAINE in MIRA LOMA, CA)
(Resource Conservation and Recovery Act (tracking hazardous waste))
EXEL INC D C 4 (11900 RIVERSIDE AVE in MIRA LOMA, CA)
(Resource Conservation and Recovery Act (tracking hazardous waste))
MIRA LOMA SUBSTATION (13568 MILLIKEN AVE. in MIRA LOMA, CA)
HAZARDOUS WASTE BIENNIAL REPORTER (Resource Conservation and Recovery Act (tracking hazardous waste)) (Resource Conservation and Recovery Act (tracking hazardous waste))
ALUMINUM DIE CASTING INC (10775 SAN SEVAINE in MIRA LOMA, CA)
Small Quantity Generators, between 100 kg and 1000 kg of hazardous waste/month (Resource Conservation and Recovery Act (tracking hazardous waste)) - notification Business NAICS classification: ALUMINUM DIE-CASTING FOUNDRIES. Organizations: LIM BENNETH (CONTACT/OWNER)
Housing units lacking complete plumbing facilities: 0.8% Housing units lacking complete kitchen facilities: 3.0%
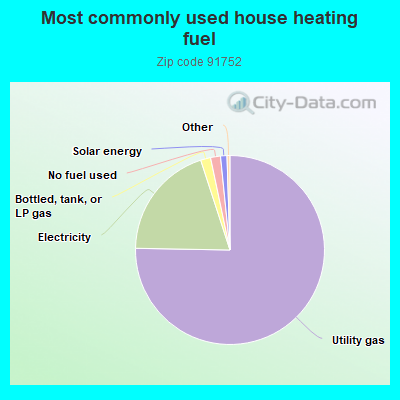
75.3%Utility gas
19.7%Electricity
1.7%Bottled, tank, or LP gas
1.7%No fuel used
1.1%Solar energy
Population in 1990: 17,368. Population change in the 1990s: +1,603 (+9.2%).
Place of birth for U.S.-born residents:
This state: 24,073
Northeast: 721
Midwest: 1,090
South: 674
West: 493
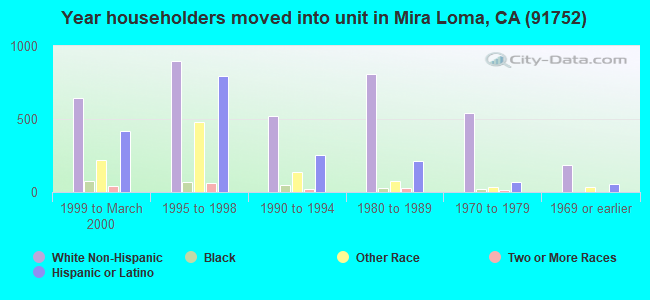
53% of the 91752 zip code residents lived in the same house 5 years ago. Out of people who lived in different houses, 40% lived in this county. Out of people who lived in different counties, 50% lived in California.
91% of the 91752 zip code residents lived in the same house 1 year ago. Out of people who lived in different houses, 29% moved from this county. Out of people who lived in different houses, 68% moved from different county within same state. Out of people who lived in different houses, 5% moved from different state. Out of people who lived in different houses, 1% moved from abroad.
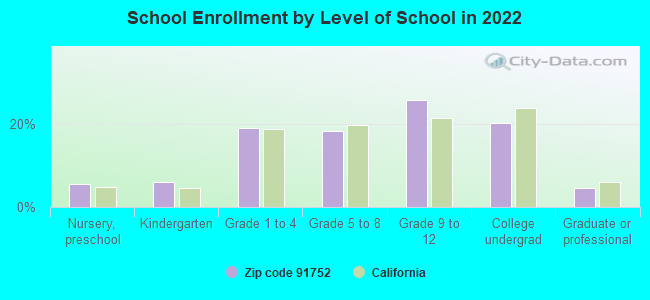
Private vs. public school enrollment:
Students in private schools in grades 1 to 8 (elementary and middle school): 177
Here:
5.1%
California:
10.5%
Students in private schools in grades 9 to 12 (high school): 126
Here:
5.2%
California:
8.5%
Students in private undergraduate colleges: 327
Here:
17.0%
California:
15.9%
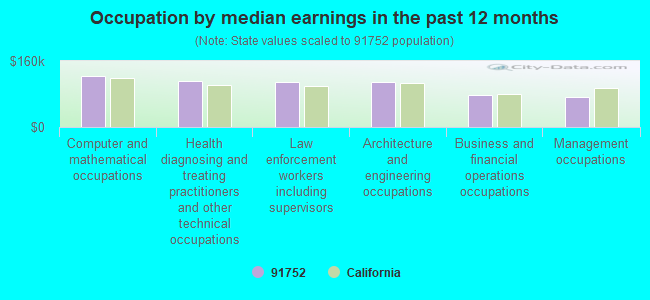
Occupation by median earnings in the past 12 months ($)
122,712Computer and mathematical occupations
110,678Health diagnosing and treating practitioners and other technical occupations
108,354Law enforcement workers including supervisors
107,975Architecture and engineering occupations
78,514Business and financial operations occupations
73,820Management occupations
Companies with federal contracts located in this zip code (MIRA LOMA, CA):
VALLEY POWER SYSTEMS INC (11300 INLAND AVE; small business) : $4,451,249 in 119 contractsfrom 1999 to 2006
Contracts for Maintenance, Repair and Rebuilding of Equipment -- Communication, Detection, and Coherent Radiation Equipment, Diesel Engines and Components, Engine Cooling System Components, Nonaircraft, Non-nuclear Ship Repair (East) Ship repair (including overhauls and conversions) performed on non-nuclear propelled and nonpropelled ships east of the 108th meridian, and moreby Navy, Defense Logistics Agency, Army, U.S. Coast Guard, and others Signed by year:2000: $391,700; 2001: $621,588; 2002: $577,590; 2003: $550,202; 2004: $611,741; 2005: $1,179,127; 2006: $493,433.
Biggest contracts:
$421,200 with Navy for Maintenance, Repair and Rebuilding of Equipment -- Communication, Detection, and Coherent Radiation Equipment. Signed on 2003-09-27. Completion date: 2002-09-30.
$420,200, same as above.Signed on 2002-09-27. Completion date: 2002-09-30.
$419,200, same as above.Signed on 2001-10-12. Completion date: 2002-09-30.
$219,810 with Navy for Diesel Engines and Components. Taking place in IL. Signed on 2005-03-31. Completion date: 2005-10-01.
A & K RAILROAD MATERIALS, INC (12180 MISSION BLVD; small business) : $284,452 in 6 contractsfrom 2001 to 2004
Contracts for Track Material, Railroad by Army, U.S. Army Corps of Engineers - civil program financing only Signed by year:2000: $0; 2001: $43,362; 2002: $0; 2003: $175,340; 2004: $65,750; 2005: $0; 2006: $0.
Biggest contracts:
$62,700 with Army for Track Material, Railroad. Taking place in AZ. Signed on 2003-10-31. Completion date: 2003-11-07.
$62,700 with U.S. Army Corps of Engineers - civil program financing only for Track Material, Railroad. Taking place in AZ. Signed on 2003-10-31. Completion date: 2003-11-07.
$49,940 with U.S. Army Corps of Engineers - civil program financing only for Track Material, Railroad. Signed on 2003-06-23. Completion date: 2003-07-31.
$43,362, same as above.Signed on 2001-04-19. Completion date: 2001-04-27.
DIAGNOSTIC IMAGING INC (11158 VENTURE DR) : $100,250 in 8 contractsfrom 2001 to 2005
Contracts for Maintenance, Repair and Rebuilding of Equipment -- Medical, Dental, and Veterinary Equipment and Supplies, Maintenance, Repair and Rebuilding of Equipment -- Instruments and Laboratory Equipment by Navy Signed by year:2000: $0; 2001: $26,138; 2002: $3,396; 2003: $34,179; 2004: $10,406; 2005: $26,131; 2006: $0.
Biggest contracts:
$34,179 with Navy for Maintenance, Repair and Rebuilding of Equipment -- Medical, Dental, and Veterinary Equipment and Supplies. Signed on 2003-09-30. Completion date: 2002-09-30.
$26,138, same as above.Signed on 2001-11-01. Completion date: 2002-09-30.
$26,131, same as above.Signed on 2005-01-20. Completion date: 2002-09-30.
$9,227, same as above.Signed on 2004-06-04. Completion date: 2002-09-30.
MARATHON MACHINING & TOOL INC (4468 PARKHURST ST; small business) : $87,073 in 6 contractsfrom 2004 to 2006
Contracts for Airframe Structural Components, Hardware, Commercial by Defense Logistics Agency Signed by year:2000: $0; 2001: $0; 2002: $0; 2003: $0; 2004: $69,086; 2005: $9,953; 2006: $8,034.
Biggest contracts:
$34,543 with Defense Logistics Agency for Airframe Structural Components. Signed on 2004-03-08. Completion date: 2005-04-07.
$34,543, same as above.Signed on 2004-03-08. Completion date: 2005-04-07.
$8,034 with Defense Logistics Agency for Hardware, Commercial. Signed on 2006-02-22. Completion date: 2006-05-22.
$3,816, same as above.Signed on 2005-10-06. Completion date: 2006-02-03.
CFAX,INC (10427 SAN SEVAINE, SUITE F; small business) : $7,973 in 2 contractsfrom 2003 to 2004
$4,265 with Navy for Miscellaneous Furniture and Fixtures. Signed on 2003-06-30. Completion date: 2003-08-01.
$3,708 with Navy for Electrical and Electronic Properties Measuring and Testing Instruments. Signed on 2004-07-22. Completion date: 2004-08-20.
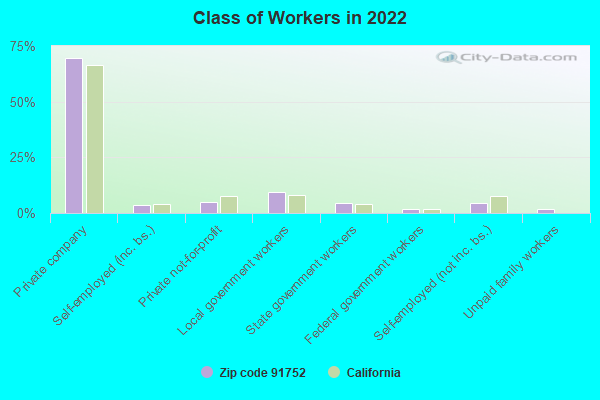
Top industries in this zip code by the number of employees in 2005:
Other Services (except Public Administration): Commercial and Industrial Machinery and Equipment (except Automotive and Electronic) Repair and Maintenance (250-499 employees: 1 establishment, 5-9 employees: 1 establishment, 1-4 employees: 1 establishment)
Wholesale Trade: Warm Air Heating and Air-Conditioning Equipment and Supplies Merchant Wholesalers (250-499: 1)
Wholesale Trade: Computer and Computer Peripheral Equipment and Software Merchant Wholesalers (250-499: 1)
People in group quarters in 2010:
20 people in nursing facilities/skilled-nursing facilities
10 people in group homes intended for adults
3 people in workers' group living quarters and job corps centers
People in group quarters in 2000:
58 people in other noninstitutional group quarters
28 people in agriculture workers' dormitories on farms
11 people in other group homes
Fatal accident statistics in 2014:
Fatal accident count: 9
Vehicles involved in fatal accidents: 17
Fatal accidents caused by drunken drivers: 3
Fatalities: 10
Persons involved in fatal accidents: 22
Pedestrians involved in fatal accidents: 1
Fatal accident statistics in 2013:
Fatal accident count: 1
Vehicles involved in fatal accidents: 1
Fatal accidents caused by drunken drivers: 1
Fatalities: 1
Persons involved in fatal accidents: 1
Pedestrians involved in fatal accidents: 0
Home Mortgage Disclosure Act Aggregated Statistics For Year 2009 (Based on 3 full and 6 partial tracts)
A) FHA, FSA/RHS & VA Home Purchase Loans
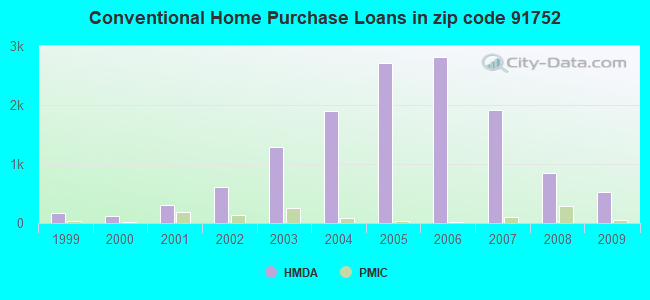
B) Conventional Home Purchase Loans
C) Refinancings
D) Home Improvement Loans
F) Non-occupant Loans on < 5 Family Dwellings (A B C & D)
G) Loans On Manufactured Home Dwelling (A B C & D)
Number
Average Value
Number
Average Value
Number
Average Value
Number
Average Value
Number
Average Value
Number
Average Value
LOANS ORIGINATED
589
$316,111
530
$261,051
690
$282,724
20
$137,072
89
$212,177
3
$144,247
APPLICATIONS APPROVED, NOT ACCEPTED
51
$312,727
85
$273,113
98
$296,105
1
$63,810
9
$215,541
1
$222,620
APPLICATIONS DENIED
126
$316,327
135
$259,234
342
$302,166
30
$107,491
26
$229,342
4
$147,745
APPLICATIONS WITHDRAWN
110
$294,092
113
$264,019
218
$309,064
12
$189,848
21
$242,325
1
$67,000
FILES CLOSED FOR INCOMPLETENESS
16
$306,225
22
$284,180
60
$309,021
2
$219,710
3
$160,990
0
$0
Aggregated Statistics For Year 2008 (Based on 3 full and 6 partial tracts)
A) FHA, FSA/RHS & VA Home Purchase Loans
B) Conventional Home Purchase Loans
C) Refinancings
D) Home Improvement Loans
F) Non-occupant Loans on < 5 Family Dwellings (A B C & D)
G) Loans On Manufactured Home Dwelling (A B C & D)
Number
Average Value
Number
Average Value
Number
Average Value
Number
Average Value
Number
Average Value
Number
Average Value
LOANS ORIGINATED
387
$366,775
846
$311,133
393
$284,180
49
$109,059
81
$254,562
9
$60,146
APPLICATIONS APPROVED, NOT ACCEPTED
42
$398,096
233
$312,011
153
$316,791
21
$103,995
23
$271,700
11
$56,518
APPLICATIONS DENIED
122
$376,112
342
$326,014
513
$361,090
107
$97,001
53
$268,511
11
$79,109
APPLICATIONS WITHDRAWN
72
$366,749
224
$318,824
172
$326,115
21
$109,249
25
$241,292
2
$135,735
FILES CLOSED FOR INCOMPLETENESS
29
$361,412
54
$351,393
65
$357,248
5
$215,100
5
$270,904
0
$0
Aggregated Statistics For Year 2007 (Based on 3 full and 6 partial tracts)
A) FHA, FSA/RHS & VA Home Purchase Loans
B) Conventional Home Purchase Loans
C) Refinancings
D) Home Improvement Loans
E) Loans on Dwellings For 5+ Families
F) Non-occupant Loans on < 5 Family Dwellings (A B C & D)
G) Loans On Manufactured Home Dwelling (A B C & D)
Number
Average Value
Number
Average Value
Number
Average Value
Number
Average Value
Number
Average Value
Number
Average Value
Number
Average Value
LOANS ORIGINATED
10
$339,643
1,923
$333,114
1,328
$353,138
219
$184,226
2
$86,183,955
111
$321,067
10
$107,641
APPLICATIONS APPROVED, NOT ACCEPTED
1
$222,990
627
$330,263
437
$357,006
88
$146,445
0
$0
34
$355,704
9
$72,138
APPLICATIONS DENIED
4
$325,002
1,043
$336,598
1,299
$394,149
261
$197,908
0
$0
83
$363,629
30
$106,552
APPLICATIONS WITHDRAWN
4
$267,262
577
$338,730
482
$382,830
68
$247,379
0
$0
24
$457,860
1
$377,220
FILES CLOSED FOR INCOMPLETENESS
0
$0
107
$363,424
174
$414,942
11
$248,029
0
$0
12
$310,294
0
$0
Aggregated Statistics For Year 2006 (Based on 3 full and 6 partial tracts)
A) FHA, FSA/RHS & VA Home Purchase Loans
B) Conventional Home Purchase Loans
C) Refinancings
D) Home Improvement Loans
E) Loans on Dwellings For 5+ Families
F) Non-occupant Loans on < 5 Family Dwellings (A B C & D)
G) Loans On Manufactured Home Dwelling (A B C & D)
Number
Average Value
Number
Average Value
Number
Average Value
Number
Average Value
Number
Average Value
Number
Average Value
Number
Average Value
LOANS ORIGINATED
3
$281,237
2,808
$346,976
2,133
$346,102
365
$182,440
1
$1,254,750
204
$299,416
16
$135,068
APPLICATIONS APPROVED, NOT ACCEPTED
0
$0
1,037
$355,469
459
$361,422
76
$199,582
0
$0
73
$327,057
11
$86,875
APPLICATIONS DENIED
0
$0
1,175
$350,596
1,177
$386,983
253
$186,157
0
$0
98
$350,050
17
$125,925
APPLICATIONS WITHDRAWN
1
$159,170
941
$372,689
740
$377,218
123
$236,789
0
$0
66
$282,679
2
$126,000
FILES CLOSED FOR INCOMPLETENESS
0
$0
144
$353,854
185
$374,041
22
$287,230
0
$0
19
$387,011
0
$0
Aggregated Statistics For Year 2005 (Based on 3 full and 6 partial tracts)
A) FHA, FSA/RHS & VA Home Purchase Loans
B) Conventional Home Purchase Loans
C) Refinancings
D) Home Improvement Loans
F) Non-occupant Loans on < 5 Family Dwellings (A B C & D)
G) Loans On Manufactured Home Dwelling (A B C & D)
Number
Average Value
Number
Average Value
Number
Average Value
Number
Average Value
Number
Average Value
Number
Average Value
LOANS ORIGINATED
1
$274,000
2,718
$327,231
2,212
$312,980
349
$175,071
215
$279,011
16
$113,563
APPLICATIONS APPROVED, NOT ACCEPTED
0
$0
800
$324,201
433
$316,951
66
$119,188
74
$294,970
15
$71,260
APPLICATIONS DENIED
0
$0
889
$321,157
962
$325,806
229
$141,147
83
$278,945
49
$88,189
APPLICATIONS WITHDRAWN
2
$158,305
726
$325,172
765
$335,523
96
$162,827
73
$259,032
3
$179,620
FILES CLOSED FOR INCOMPLETENESS
0
$0
117
$359,740
210
$324,003
16
$229,729
7
$306,716
0
$0
Aggregated Statistics For Year 2004 (Based on 3 full and 6 partial tracts)
A) FHA, FSA/RHS & VA Home Purchase Loans
B) Conventional Home Purchase Loans
C) Refinancings
D) Home Improvement Loans
E) Loans on Dwellings For 5+ Families
F) Non-occupant Loans on < 5 Family Dwellings (A B C & D)
G) Loans On Manufactured Home Dwelling (A B C & D)
Number
Average Value
Number
Average Value
Number
Average Value
Number
Average Value
Number
Average Value
Number
Average Value
Number
Average Value
LOANS ORIGINATED
7
$179,536
1,895
$273,407
2,062
$259,559
277
$150,854
2
$8,274,375
148
$240,094
13
$130,572
APPLICATIONS APPROVED, NOT ACCEPTED
1
$129,060
503
$279,473
392
$249,357
44
$129,598
0
$0
35
$226,345
10
$98,061
APPLICATIONS DENIED
3
$171,763
532
$271,219
692
$257,822
195
$122,901
1
$494,720
66
$204,357
25
$87,231
APPLICATIONS WITHDRAWN
1
$231,590
407
$288,090
603
$260,726
60
$136,577
1
$334,000
20
$239,578
3
$87,347
FILES CLOSED FOR INCOMPLETENESS
2
$178,205
109
$282,570
165
$251,159
15
$135,193
0
$0
4
$230,562
0
$0
Aggregated Statistics For Year 2003 (Based on 3 full and 6 partial tracts)
A) FHA, FSA/RHS & VA Home Purchase Loans
B) Conventional Home Purchase Loans
C) Refinancings
D) Home Improvement Loans
E) Loans on Dwellings For 5+ Families
F) Non-occupant Loans on < 5 Family Dwellings (A B C & D)
Number
Average Value
Number
Average Value
Number
Average Value
Number
Average Value
Number
Average Value
Number
Average Value
LOANS ORIGINATED
29
$169,894
1,294
$216,581
2,556
$191,245
131
$61,046
2
$10,493,360
127
$148,172
APPLICATIONS APPROVED, NOT ACCEPTED
2
$105,905
277
$203,425
406
$208,325
47
$50,395
0
$0
22
$184,444
APPLICATIONS DENIED
2
$193,585
232
$191,023
730
$184,227
122
$51,799
0
$0
44
$183,142
APPLICATIONS WITHDRAWN
11
$185,442
245
$225,498
601
$197,563
29
$67,900
0
$0
19
$160,429
FILES CLOSED FOR INCOMPLETENESS
1
$207,000
59
$215,715
126
$191,654
10
$40,308
0
$0
2
$152,390
Aggregated Statistics For Year 2002 (Based on 2 partial tracts)
A) FHA, FSA/RHS & VA Home Purchase Loans
B) Conventional Home Purchase Loans
C) Refinancings
D) Home Improvement Loans
F) Non-occupant Loans on < 5 Family Dwellings (A B C & D)
Number
Average Value
Number
Average Value
Number
Average Value
Number
Average Value
Number
Average Value
LOANS ORIGINATED
3
$249,037
618
$204,532
280
$207,968
34
$49,431
14
$169,571
APPLICATIONS APPROVED, NOT ACCEPTED
0
$0
110
$198,883
50
$201,305
24
$35,730
6
$165,867
APPLICATIONS DENIED
0
$0
72
$190,274
109
$193,222
50
$42,905
1
$227,290
APPLICATIONS WITHDRAWN
2
$248,440
156
$216,916
77
$206,058
12
$52,341
0
$0
FILES CLOSED FOR INCOMPLETENESS
0
$0
14
$226,111
28
$192,899
0
$0
0
$0
Aggregated Statistics For Year 2001 (Based on 2 partial tracts)
A) FHA, FSA/RHS & VA Home Purchase Loans
B) Conventional Home Purchase Loans
C) Refinancings
D) Home Improvement Loans
F) Non-occupant Loans on < 5 Family Dwellings (A B C & D)
Number
Average Value
Number
Average Value
Number
Average Value
Number
Average Value
Number
Average Value
LOANS ORIGINATED
9
$180,923
306
$180,094
60
$171,530
9
$26,210
6
$181,043
APPLICATIONS APPROVED, NOT ACCEPTED
1
$277,480
41
$153,141
17
$187,854
6
$42,900
0
$0
APPLICATIONS DENIED
1
$130,490
82
$111,800
50
$162,573
12
$28,919
2
$232,665
APPLICATIONS WITHDRAWN
6
$206,615
67
$168,977
31
$145,019
3
$47,323
1
$296,840
FILES CLOSED FOR INCOMPLETENESS
0
$0
1
$270,310
6
$101,695
0
$0
0
$0
Aggregated Statistics For Year 2000 (Based on 2 partial tracts)
A) FHA, FSA/RHS & VA Home Purchase Loans
B) Conventional Home Purchase Loans
C) Refinancings
D) Home Improvement Loans
F) Non-occupant Loans on < 5 Family Dwellings (A B C & D)
Number
Average Value
Number
Average Value
Number
Average Value
Number
Average Value
Number
Average Value
LOANS ORIGINATED
7
$181,811
122
$126,121
8
$113,018
1
$17,930
2
$182,835
APPLICATIONS APPROVED, NOT ACCEPTED
0
$0
9
$114,959
4
$188,930
1
$25,100
0
$0
APPLICATIONS DENIED
1
$227,290
50
$64,315
9
$85,243
4
$20,972
1
$107,550
APPLICATIONS WITHDRAWN
6
$163,477
56
$182,374
4
$43,020
1
$28,680
0
$0
FILES CLOSED FOR INCOMPLETENESS
0
$0
2
$106,115
1
$35,850
0
$0
0
$0
Aggregated Statistics For Year 1999 (Based on 3 partial tracts)
A) FHA, FSA/RHS & VA Home Purchase Loans
B) Conventional Home Purchase Loans
C) Refinancings
D) Home Improvement Loans
E) Loans on Dwellings For 5+ Families
F) Non-occupant Loans on < 5 Family Dwellings (A B C & D)
2006 - 2018 National Fire Incident Reporting System (NFIRS) incidents
According to the data from the years 2006 - 2018 the average number of fires per year is 77. The highest number of fires - 129 took place in 2007, and the least - 30 in 2006. The data has an increasing trend.
When looking into fire subcategories, the most incidents belonged to: Outside Fires (45.8%), and Mobile Property/Vehicle Fires (31.7%).
Fire incident types reported to NFIRS in Zip Code 91752


 Nearest zip codes: 91761, 92860, 92505, 92337, 92509, 92880.


 According to the data from the years 2006 - 2018 the average number of fires per year is 77. The highest number of fires - 129 took place in 2007, and the least - 30 in 2006. The data has an increasing trend.
 When looking into fire subcategories, the most incidents belonged to: Outside Fires (45.8%), and Mobile Property/Vehicle Fires (31.7%).