Estimated zip code population in 2022: 40,007 Zip code population in 2010: 25,150 Zip code population in 2000: 262
Houses and condos: 14,535 Renter-occupied apartments: 3,364
% of renters here:
24%
State:
40%
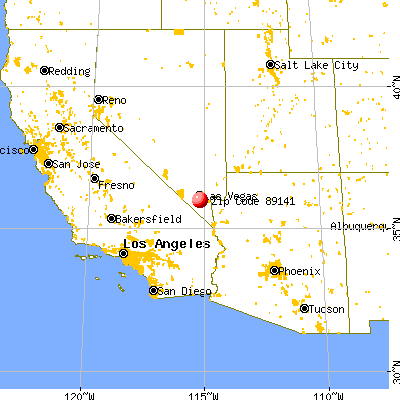
March 2022 cost of living index in zip code 89141: 99.5 (near average, U.S. average is 100)
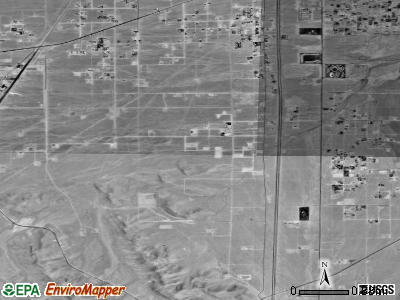
Land area: 10.7 sq. mi. Water area: 0.0 sq. mi.
Population density: 3,746 people per square mile
(average).
OSM Map
General Map
Google Map
MSN Map
OSM Map
General Map
Google Map
MSN Map
OSM Map
General Map
Google Map
MSN Map
OSM Map
General Map
Google Map
MSN Map
Please wait while loading the map...
Real estate property taxes paid for housing units in 2022:
This zip code:
0.5% ($2,718)
Nevada:
0.4% ($1,889)
Median real estate property taxes paid for housing units with mortgages in 2022: $2,772 (0.5%) Median real estate property taxes paid for housing units with no mortgage in 2022: $2,460 (0.5%)
Estimated median house/condo value in 2022: $539,130
89141:
$539,130
Nevada:
$434,700
According to our research of Nevada and other state lists, there were 32 registered sex offenders living in 89141 zip code as of June 07, 2024. The ratio of all residents to sex offenders in zip code 89141 is 925 to 1. The ratio of registered sex offenders to all residents in this zip code is much lower than the state average.
Median resident age:
This zip code:
38.0 years
Nevada median age:
39.0 years
Average household size:
This zip code:
2.9 people
Nevada:
2.6 people
Averages for the 2020 tax year for zip code 89141, filed in 2021:
Average Adjusted Gross Income (AGI) in 2020: $118,969 (Individual Income Tax Returns)
Here:
$118,969
State:
$78,964
Salary/wage: $77,636 (reported on 84.4% of returns)
Here:
$77,636
State:
$54,472
(% of AGI for various income ranges: 1131.9% for AGIs below $25k, 3321.6% for AGIs $25k-50k, 6472.9% for AGIs $50k-75k, 9792.6% for AGIs $75k-100k, 17939.0% for AGIs $100k-200k, 98340.8% for AGIs over 200k)
Taxable interest for individuals: $4,215 (reported on 26.1% of returns)
This zip code:
$4,215
Nevada:
$3,521
(% of AGI for various income ranges: 11.2% for AGIs below $25k, 11.9% for AGIs $25k-50k, 38.4% for AGIs $50k-75k, 35.5% for AGIs $75k-100k, 98.4% for AGIs $100k-200k, 3543.9% for AGIs over 200k)
Ordinary dividends: $12,649 (reported on 16.6% of returns)
Here:
$12,649
State:
$13,390
(% of AGI for various income ranges: 12.7% for AGIs below $25k, 21.8% for AGIs $25k-50k, 47.7% for AGIs $50k-75k, 57.1% for AGIs $75k-100k, 190.6% for AGIs $100k-200k, 6982.7% for AGIs over 200k)
Net capital gain/loss in AGI: +$105,578 (reported on 19.5% of returns)
Here:
+$105,578
State:
+$63,025
(% of AGI for various income ranges: 13.0% for AGIs below $25k, 39.7% for AGIs $25k-50k, 77.9% for AGIs $50k-75k, 110.3% for AGIs $75k-100k, 526.2% for AGIs $100k-200k, 78679.0% for AGIs over 200k)
Profit/loss from business: +$13,692 (reported on 20.0% of returns)
Here:
+$13,692
State:
+$11,500
(% of AGI for various income ranges: 82.9% for AGIs below $25k, 117.2% for AGIs $25k-50k, 235.2% for AGIs $50k-75k, 305.2% for AGIs $75k-100k, 518.8% for AGIs $100k-200k, 5416.1% for AGIs over 200k)
Taxable individual retirement arrangement distribution: $25,641 (reported on 5.5% of returns)
89141:
$25,641
Nevada:
$23,628
(% of AGI for various income ranges: 33.2% for AGIs below $25k, 59.5% for AGIs $25k-50k, 92.9% for AGIs $50k-75k, 240.3% for AGIs $75k-100k, 464.6% for AGIs $100k-200k, 1965.7% for AGIs over 200k)
Self-employed (Keogh) retirement plans: $21,870 (reported on 0.5% of returns)
89141:
$21,870
Nevada:
$26,634
(% of AGI for various income ranges: 7.2% for AGIs $25k-50k, 14.9% for AGIs $100k-200k, 332.2% for AGIs over 200k)
Total itemized deductions: $48,127 (reported on 15.9% of returns)
Here:
$48,127
State:
$44,173
(% of AGI for various income ranges: 61.3% for AGIs below $25k, 235.8% for AGIs $25k-50k, 539.9% for AGIs $50k-75k, 802.3% for AGIs $75k-100k, 1451.5% for AGIs $100k-200k, 17743.7% for AGIs over 200k)
Charity contributions: $11,747 (reported on 12.9% of returns)
Here:
$11,747
State:
$12,589
(% of AGI for various income ranges: 3.7% for AGIs below $25k, 27.8% for AGIs $25k-50k, 56.6% for AGIs $50k-75k, 110.8% for AGIs $75k-100k, 212.6% for AGIs $100k-200k, 4348.8% for AGIs over 200k)
Taxes paid: $6,606 (reported on 15.7% of returns)
89141:
$6,606
State:
$6,112
(% of AGI for various income ranges: 10.2% for AGIs below $25k, 47.1% for AGIs $25k-50k, 107.5% for AGIs $50k-75k, 175.5% for AGIs $75k-100k, 300.5% for AGIs $100k-200k, 1496.9% for AGIs over 200k)
Earned income credit: $2,019 (reported on 12.3% of returns)
Here:
$2,019
State:
$2,214
(% of AGI for various income ranges: 76.5% for AGIs below $25k, 57.0% for AGIs $25k-50k, 1.0% for AGIs $50k-75k)
Percentage of individuals using paid preparers for their 2020 taxes: 93.6%
Here:
94%
State:
93%
(% for various income ranges: 92.3% for AGIs below $25k, 94.1% for AGIs $25k-50k, 93.6% for AGIs $50k-75k, 94.8% for AGIs $75k-100k, 93.9% for AGIs $100k-200k, 94.4% for AGIs over 200k)
Averages for the 2012 tax year for zip code 89141, filed in 2013:
Average Adjusted Gross Income (AGI) in 2012: $98,184 (Individual Income Tax Returns)
Here:
$98,184
State:
$61,164
Salary/wage: $64,302 (reported on 87.5% of returns)
Here:
$64,302
State:
$45,924
(% of AGI for various income ranges: 75.2% for AGIs below $25k, 86.0% for AGIs $25k-50k, 87.0% for AGIs $50k-75k, 84.8% for AGIs $75k-100k, 82.5% for AGIs $100k-200k, 27.8% for AGIs over 200k)
Taxable interest for individuals: $4,100 (reported on 25.8% of returns)
This zip code:
$4,100
Nevada:
$3,137
(% of AGI for various income ranges: 0.8% for AGIs below $25k, 0.4% for AGIs $25k-50k, 0.2% for AGIs $50k-75k, 0.2% for AGIs $75k-100k, 0.4% for AGIs $100k-200k, 1.9% for AGIs over 200k)
Ordinary dividends: $13,244 (reported on 14.7% of returns)
Here:
$13,244
State:
$11,762
(% of AGI for various income ranges: 4.7% for AGIs below $25k, 1.3% for AGIs $25k-50k, 0.5% for AGIs $50k-75k, 0.5% for AGIs $75k-100k, 0.8% for AGIs $100k-200k, 3.0% for AGIs over 200k)
Net capital gain/loss in AGI: +$55,765 (reported on 14.6% of returns)
Here:
+$55,765
State:
+$33,127
(% of AGI for various income ranges: 0.3% for AGIs $25k-50k, 0.1% for AGIs $50k-75k, 0.4% for AGIs $75k-100k, 0.9% for AGIs $100k-200k, 16.9% for AGIs over 200k)
Profit/loss from business: +$15,342 (reported on 16.5% of returns)
Here:
+$15,342
State:
+$12,567
(% of AGI for various income ranges: 9.1% for AGIs below $25k, 3.4% for AGIs $25k-50k, 2.3% for AGIs $50k-75k, 2.7% for AGIs $75k-100k, 2.4% for AGIs $100k-200k, 2.0% for AGIs over 200k)
Taxable individual retirement arrangement distribution: $25,780 (reported on 5.9% of returns)
89141:
$25,780
Nevada:
$20,808
(% of AGI for various income ranges: 2.6% for AGIs below $25k, 1.2% for AGIs $25k-50k, 1.4% for AGIs $50k-75k, 1.7% for AGIs $75k-100k, 1.7% for AGIs $100k-200k, 1.5% for AGIs over 200k)
Self-employment retirement plans: $23,967 (reported on 0.5% of returns)
89141:
$23,967
Nevada:
$22,197
Total itemized deductions: $29,665 (17% of AGI, reported on 41.2% of returns)
Here:
$29,665
State:
$26,148
Here:
16.7% of AGI
State:
20.0% of AGI
(% of AGI for various income ranges: 13.0% for AGIs below $25k, 14.3% for AGIs $25k-50k, 14.6% for AGIs $50k-75k, 14.1% for AGIs $75k-100k, 14.8% for AGIs $100k-200k, 10.3% for AGIs over 200k)
Charity contributions: $5,349 (reported on 33.7% of returns)
Here:
$5,349
State:
$4,329
(% of AGI for various income ranges: 0.7% for AGIs below $25k, 1.3% for AGIs $25k-50k, 1.4% for AGIs $50k-75k, 1.4% for AGIs $75k-100k, 1.6% for AGIs $100k-200k, 2.3% for AGIs over 200k)
Taxes paid: $6,130 (reported on 40.6% of returns)
89141:
$6,130
State:
$5,116
(% of AGI for various income ranges: 2.0% for AGIs below $25k, 2.6% for AGIs $25k-50k, 2.8% for AGIs $50k-75k, 2.7% for AGIs $75k-100k, 3.1% for AGIs $100k-200k, 2.2% for AGIs over 200k)
Earned income credit: $2,163 (reported on 13.6% of returns)
Here:
$2,163
State:
$2,279
(% of AGI for various income ranges: 5.6% for AGIs below $25k, 0.9% for AGIs $25k-50k)
Percentage of individuals using paid preparers for their 2012 taxes: 56.2%
Here:
56%
State:
55%
(% for various income ranges: 48.9% for AGIs below $25k, 53.6% for AGIs $25k-50k, 56.4% for AGIs $50k-75k, 58.9% for AGIs $75k-100k, 65.3% for AGIs $100k-200k, 80.0% for AGIs over 200k)
Averages for the 2004 tax year for zip code 89141, filed in 2005:
Average Adjusted Gross Income (AGI) in 2004: $86,752 (Individual Income Tax Returns)
Here:
$86,752
State:
$58,367
Salary/wage: $65,010 (reported on 90.2% of returns)
Here:
$65,010
State:
$42,695
(% of AGI for various income ranges: 383.1% for AGIs below $10k, 86.4% for AGIs $10k-25k, 89.1% for AGIs $25k-50k, 86.0% for AGIs $50k-75k, 87.5% for AGIs $75k-100k, 54.4% for AGIs over 100k)
Taxable interest for individuals: $2,713 (reported on 42.3% of returns)
This zip code:
$2,713
Nevada:
$3,867
(% of AGI for various income ranges: 14.4% for AGIs below $10k, 1.3% for AGIs $10k-25k, 0.8% for AGIs $25k-50k, 0.6% for AGIs $50k-75k, 0.3% for AGIs $75k-100k, 1.7% for AGIs over 100k)
Taxable dividends: $3,339 (reported on 19.4% of returns)
Here:
$3,339
State:
$5,770
(% of AGI for various income ranges: 5.6% for AGIs below $10k, 0.8% for AGIs $10k-25k, 0.4% for AGIs $25k-50k, 0.3% for AGIs $50k-75k, 0.2% for AGIs $75k-100k, 1.0% for AGIs over 100k)
Net capital gain/loss: +$70,080 (reported on 21.3% of returns)
Here:
+$70,080
State:
+$50,644
(% of AGI for various income ranges: 11.5% for AGIs below $10k, 0.9% for AGIs $10k-25k, 0.8% for AGIs $25k-50k, 0.9% for AGIs $50k-75k, 1.8% for AGIs $75k-100k, 27.0% for AGIs over 100k)
Profit/loss from business: +$15,920 (reported on 20.0% of returns)
Here:
+$15,920
State:
+$13,618
(% of AGI for various income ranges: -5.0% for AGIs below $10k, 7.7% for AGIs $10k-25k, 3.9% for AGIs $25k-50k, 4.0% for AGIs $50k-75k, 3.3% for AGIs $75k-100k, 3.5% for AGIs over 100k)
IRA payment deduction: $2,978 (reported on 2.5% of returns)
89141:
$2,978
Nevada:
$3,054
(% of AGI for various income ranges: 0.2% for AGIs $10k-25k, 0.2% for AGIs $25k-50k, 0.1% for AGIs $50k-75k, 0.1% for AGIs $75k-100k, 0.1% for AGIs over 100k)
Self-employed pension: $18,394 (reported on 0.9% of returns)
Here:
$18,394
Nevada:
$16,706
(% of AGI for various income ranges: 0.4% for AGIs $10k-25k, 0.2% for AGIs $50k-75k, 0.3% for AGIs over 100k)
Total itemized deductions: $26,120 (21% of AGI, reported on 58.2% of returns)
Here:
$26,120
State:
$22,990
Here:
21.1% of AGI
State:
21.8% of AGI
(% of AGI for various income ranges: 78.0% for AGIs below $10k, 22.6% for AGIs $10k-25k, 25.0% for AGIs $25k-50k, 26.1% for AGIs $50k-75k, 24.3% for AGIs $75k-100k, 12.8% for AGIs over 100k)
Charity contributions deductions: $2,972 (2% of AGI, reported on 50.2% of returns)
Here:
$2,972
State:
$3,443
Here:
2.3% of AGI
State:
3.1% of AGI
(% of AGI for various income ranges: 2.4% for AGIs below $10k, 1.2% for AGIs $10k-25k, 1.7% for AGIs $25k-50k, 2.1% for AGIs $50k-75k, 2.1% for AGIs $75k-100k, 1.6% for AGIs over 100k)
Total tax: $15,969 (reported on 83.5% of returns)
89141:
$15,969
State:
$10,585
(% of AGI for various income ranges: 11.3% for AGIs below $10k, 4.8% for AGIs $10k-25k, 6.7% for AGIs $25k-50k, 8.5% for AGIs $50k-75k, 9.7% for AGIs $75k-100k, 19.8% for AGIs over 100k)
Earned income credit: $1,530 (reported on 8.9% of returns)
Here:
$1,530
State:
$1,676
Percentage of individuals using paid preparers for their 2004 taxes: 61.9%
Here:
62%
State:
60%
(% for various income ranges: 56.1% for AGIs below $10k, 55.4% for AGIs $10k-25k, 57.6% for AGIs $25k-50k, 62.2% for AGIs $50k-75k, 65.3% for AGIs $75k-100k, 74.3% for AGIs over 100k)
Likely homosexual households (counted as self-reported same-sex unmarried-partner households)
Lesbian couples: 0.1% of all households
Gay men: 0.6% of all households
Household received Food Stamps/SNAP in the past 12 months: 476 Household did not receive Food Stamps/SNAP in the past 12 months: 13,107
Women who had a birth in the past 12 months: 680 (350 now married, 291 unmarried) Women who did not have a birth in the past 12 months: 10,102 (4,632 now married, 5,448 unmarried)
Housing units in zip code 89141 with a mortgage: 8,494 (467 second mortgage, 57 home equity loan, 363 both second mortgage and home equity loan) Houses without a mortgage: 33
Median monthly owner costs for units with a mortgage: $2,102 Median monthly owner costs for units without a mortgage: $515
Residents with income below the poverty level in 2022:
This zip code:
6.9%
Whole state:
12.5%
Residents with income below 50% of the poverty level in 2022:
This zip code:
2.4%
Whole state:
5.9%
Median number of rooms in houses and condos:
Here:
6.4
State:
6.0
Median number of rooms in apartments:
Here:
5.0
State:
4.2
Notable locations in this zip code not listed on our city pages
6,019 married couples with children.
2,454 single-parent households (1,014 men, 1,440 women).
70.1% of residents of 89141 zip code speak English at home.
10.3% of residents speak Spanish at home (78% very well, 13% well, 8% not well).
4.5% of residents speak other Indo-European language at home (76% very well, 13% well, 8% not well, 3% not at all).
14.0% of residents speak Asian or Pacific Island language at home (64% very well, 28% well, 8% not well, 1% not at all).
0.7% of residents speak other language at home (80% very well, 3% well, 17% not well).
Foreign born population: 8,293 (20.7%) (71.6% of them are naturalized citizens)
Housing units lacking complete plumbing facilities: 0.7% Housing units lacking complete kitchen facilities: 1.1%
75.9%Utility gas
21.8%Electricity
1.2%No fuel used
0.7%Bottled, tank, or LP gas
Place of birth for U.S.-born residents:
This state: 10,143
Northeast: 2,460
Midwest: 3,550
South: 3,870
West: 10,026
53% of the 89141 zip code residents lived in the same house 5 years ago. Out of people who lived in different houses, 94% lived in this county. Out of people who lived in different counties, 50% lived in Nevada.
84% of the 89141 zip code residents lived in the same house 1 year ago. Out of people who lived in different houses, 64% moved from this county. Out of people who lived in different houses, 31% moved from different state. Out of people who lived in different houses, 2% moved from abroad.
Private vs. public school enrollment:
Students in private schools in grades 1 to 8 (elementary and middle school): 639
Here:
15.5%
Nevada:
12.9%
Students in private schools in grades 9 to 12 (high school): 195
Here:
10.0%
Nevada:
6.9%
Students in private undergraduate colleges: 273
Here:
18.5%
Nevada:
16.0%
Occupation by median earnings in the past 12 months ($)
132,814Architecture and engineering occupations
110,790Management occupations
96,560Computer and mathematical occupations
92,983Health diagnosing and treating practitioners and other technical occupations
88,786Installation, maintenance, and repair occupations
86,246Law enforcement workers including supervisors
Companies with federal contracts located in this zip code:
E2A, LLC (4001 BELLA PALERMO WAY in LAS VEGAS, NV; small business)
$94,500 with Army for Other Environmental Services, Studies, and Analytical Support. Signed on 2006-06-29. Completion date: 2007-10-30.
Top industries in this zip code by the number of employees in 2005:
Arts, Entertainment, and Recreation: Golf Courses and Country Clubs (50-99 employees: 1 establishment)
Accommodation and Food Services: Full-Service Restaurants (20-49: 2)
Real Estate and Rental and Leasing: Offices of Real Estate Agents and Brokers (10-19: 1, 5-9: 1, 1-4: 12)
Construction: All Other Specialty Trade Contractors (20-49: 1, 1-4: 2)
Construction: Poured Concrete Foundation and Structure Contractors (20-49: 1)
Health Care and Social Assistance: Home Health Care Services (20-49: 1)
Educational Services: Elementary and Secondary Schools (10-19: 1)
Home Mortgage Disclosure Act Aggregated Statistics For Year 2009 (Based on 2 partial tracts)
A) FHA, FSA/RHS & VA Home Purchase Loans
B) Conventional Home Purchase Loans
C) Refinancings
D) Home Improvement Loans
F) Non-occupant Loans on < 5 Family Dwellings (A B C & D)
G) Loans On Manufactured Home Dwelling (A B C & D)
Number
Average Value
Number
Average Value
Number
Average Value
Number
Average Value
Number
Average Value
Number
Average Value
LOANS ORIGINATED
73
$193,802
36
$180,356
32
$248,399
0
$0
19
$161,682
1
$148,790
APPLICATIONS APPROVED, NOT ACCEPTED
5
$210,568
3
$252,940
4
$206,140
0
$0
2
$148,710
0
$0
APPLICATIONS DENIED
16
$212,261
9
$214,857
15
$283,339
1
$108,630
6
$180,690
0
$0
APPLICATIONS WITHDRAWN
7
$207,627
5
$250,610
8
$234,681
1
$80,940
3
$219,780
0
$0
FILES CLOSED FOR INCOMPLETENESS
1
$310,620
1
$242,600
2
$258,190
0
$0
0
$0
0
$0
Aggregated Statistics For Year 2008 (Based on 2 partial tracts)
A) FHA, FSA/RHS & VA Home Purchase Loans
B) Conventional Home Purchase Loans
C) Refinancings
D) Home Improvement Loans
F) Non-occupant Loans on < 5 Family Dwellings (A B C & D)
G) Loans On Manufactured Home Dwelling (A B C & D)
Number
Average Value
Number
Average Value
Number
Average Value
Number
Average Value
Number
Average Value
Number
Average Value
LOANS ORIGINATED
50
$243,401
51
$267,951
14
$292,571
1
$77,710
18
$247,161
1
$157,150
APPLICATIONS APPROVED, NOT ACCEPTED
5
$232,096
9
$258,713
3
$353,320
1
$36,640
3
$216,260
0
$0
APPLICATIONS DENIED
12
$252,730
19
$319,521
21
$348,257
5
$133,274
8
$271,180
1
$136,410
APPLICATIONS WITHDRAWN
5
$264,430
11
$279,318
7
$304,857
1
$134,550
4
$280,030
0
$0
FILES CLOSED FOR INCOMPLETENESS
1
$155,080
2
$375,830
2
$418,800
0
$0
1
$584,980
0
$0
Aggregated Statistics For Year 2007 (Based on 2 partial tracts)
A) FHA, FSA/RHS & VA Home Purchase Loans
B) Conventional Home Purchase Loans
C) Refinancings
D) Home Improvement Loans
F) Non-occupant Loans on < 5 Family Dwellings (A B C & D)
G) Loans On Manufactured Home Dwelling (A B C & D)
Number
Average Value
Number
Average Value
Number
Average Value
Number
Average Value
Number
Average Value
Number
Average Value
LOANS ORIGINATED
8
$257,120
132
$250,552
47
$325,409
5
$112,526
30
$260,994
2
$125,980
APPLICATIONS APPROVED, NOT ACCEPTED
1
$212,420
32
$248,792
16
$296,931
4
$96,535
7
$290,066
0
$0
APPLICATIONS DENIED
2
$314,455
43
$338,239
54
$327,189
6
$128,568
15
$338,997
1
$223,150
APPLICATIONS WITHDRAWN
1
$230,390
29
$292,056
19
$339,631
1
$194,580
7
$306,561
0
$0
FILES CLOSED FOR INCOMPLETENESS
0
$0
4
$339,655
7
$336,357
0
$0
2
$236,185
0
$0
Aggregated Statistics For Year 2006 (Based on 2 partial tracts)
A) FHA, FSA/RHS & VA Home Purchase Loans
B) Conventional Home Purchase Loans
C) Refinancings
D) Home Improvement Loans
F) Non-occupant Loans on < 5 Family Dwellings (A B C & D)
G) Loans On Manufactured Home Dwelling (A B C & D)
Number
Average Value
Number
Average Value
Number
Average Value
Number
Average Value
Number
Average Value
Number
Average Value
LOANS ORIGINATED
2
$225,920
280
$247,028
67
$323,208
9
$112,594
68
$245,078
2
$155,230
APPLICATIONS APPROVED, NOT ACCEPTED
0
$0
49
$268,151
17
$342,288
3
$89,410
15
$250,898
0
$0
APPLICATIONS DENIED
0
$0
66
$304,576
45
$343,652
7
$110,757
23
$281,850
1
$181,410
APPLICATIONS WITHDRAWN
0
$0
64
$270,435
27
$355,723
2
$140,965
15
$265,427
0
$0
FILES CLOSED FOR INCOMPLETENESS
0
$0
11
$254,350
6
$336,382
0
$0
3
$318,723
0
$0
Aggregated Statistics For Year 2005 (Based on 2 partial tracts)
A) FHA, FSA/RHS & VA Home Purchase Loans
B) Conventional Home Purchase Loans
C) Refinancings
D) Home Improvement Loans
F) Non-occupant Loans on < 5 Family Dwellings (A B C & D)
G) Loans On Manufactured Home Dwelling (A B C & D)
Number
Average Value
Number
Average Value
Number
Average Value
Number
Average Value
Number
Average Value
Number
Average Value
LOANS ORIGINATED
1
$201,080
238
$248,757
69
$324,973
6
$172,783
68
$256,312
2
$115,525
APPLICATIONS APPROVED, NOT ACCEPTED
0
$0
31
$243,182
12
$287,188
1
$111,080
10
$230,706
1
$88,180
APPLICATIONS DENIED
0
$0
56
$298,813
35
$334,449
7
$129,481
18
$284,673
2
$92,570
APPLICATIONS WITHDRAWN
0
$0
54
$262,094
25
$304,742
3
$184,257
13
$260,750
1
$115,750
FILES CLOSED FOR INCOMPLETENESS
0
$0
8
$287,648
4
$375,290
0
$0
2
$276,405
0
$0
Aggregated Statistics For Year 2004 (Based on 2 partial tracts)
A) FHA, FSA/RHS & VA Home Purchase Loans
B) Conventional Home Purchase Loans
C) Refinancings
D) Home Improvement Loans
F) Non-occupant Loans on < 5 Family Dwellings (A B C & D)
G) Loans On Manufactured Home Dwelling (A B C & D)
Number
Average Value
Number
Average Value
Number
Average Value
Number
Average Value
Number
Average Value
Number
Average Value
LOANS ORIGINATED
2
$147,240
110
$256,221
71
$272,639
7
$124,164
37
$243,298
2
$96,485
APPLICATIONS APPROVED, NOT ACCEPTED
0
$0
20
$232,577
10
$269,986
2
$67,875
7
$231,964
1
$91,910
APPLICATIONS DENIED
0
$0
25
$271,218
25
$268,590
5
$95,080
7
$266,964
2
$79,925
APPLICATIONS WITHDRAWN
0
$0
20
$256,059
16
$268,564
2
$145,170
6
$237,437
1
$92,610
FILES CLOSED FOR INCOMPLETENESS
0
$0
4
$246,050
5
$256,772
0
$0
2
$156,470
0
$0
Aggregated Statistics For Year 2003 (Based on 2 partial tracts)
A) FHA, FSA/RHS & VA Home Purchase Loans
B) Conventional Home Purchase Loans
C) Refinancings
D) Home Improvement Loans
F) Non-occupant Loans on < 5 Family Dwellings (A B C & D)
Number
Average Value
Number
Average Value
Number
Average Value
Number
Average Value
Number
Average Value
LOANS ORIGINATED
4
$176,788
81
$212,513
62
$202,640
4
$48,530
22
$190,336
APPLICATIONS APPROVED, NOT ACCEPTED
0
$0
11
$199,883
9
$197,446
2
$53,035
3
$175,053
APPLICATIONS DENIED
0
$0
12
$205,665
20
$194,628
5
$45,814
2
$236,830
APPLICATIONS WITHDRAWN
1
$142,330
15
$187,995
14
$183,618
1
$33,950
3
$182,560
FILES CLOSED FOR INCOMPLETENESS
0
$0
3
$193,850
3
$213,860
0
$0
1
$87,730
Aggregated Statistics For Year 1999 (Based on 1 partial tract)
A) FHA, FSA/RHS & VA Home Purchase Loans
B) Conventional Home Purchase Loans
C) Refinancings
D) Home Improvement Loans
F) Non-occupant Loans on < 5 Family Dwellings (A B C & D)
Detailed PMIC statistics for the following Tracts:0058.16
2004 - 2018 National Fire Incident Reporting System (NFIRS) incidents
Based on the data from the years 2004 - 2018 the average number of fire incidents per year is 35. The highest number of fires - 53 took place in 2017, and the least - 17 in 2012. The data has a growing trend.
When looking into fire subcategories, the most incidents belonged to: Outside Fires (45.3%), and Structure Fires (27.7%).
Fire incident types reported to NFIRS in Zip Code 89141


 Nearest zip codes: 89139, 89183, 89054, 89123, 89178, 89118.


 Based on the data from the years 2004 - 2018 the average number of fire incidents per year is 35. The highest number of fires - 53 took place in 2017, and the least - 17 in 2012. The data has a growing trend.
 When looking into fire subcategories, the most incidents belonged to: Outside Fires (45.3%), and Structure Fires (27.7%).