Estimated zip code population in 2022: 34,389
Zip code population in 2010: 19,550
Zip code population in 2000: 175
Houses and condos: 15,113
Renter-occupied apartments: 4,180
% of renters here:
31%State:
40%
March 2022 cost of living index in zip code 89011: 99.3
(near average, U.S. average is 100)
Land area: 17.0
sq. mi.
Water area: 0.0
sq. mi.
Population density: 2,023 people per square mile (low).
OSM Map
General Map
Google Map
MSN Map
OSM Map
General Map
Google Map
MSN Map
OSM Map
General Map
Google Map
MSN Map
OSM Map
General Map
Google Map
MSN Map
Please wait while loading the map...
Real estate property taxes paid for housing units in 2022:
This zip code:
0.5% ($2,482)Nevada:
0.4% ($1,889)
Median real estate property taxes paid for housing units with mortgages in 2022: $2,365 (0.5%)
Median real estate property taxes paid for housing units with no mortgage in 2022: $2,642 (0.6%)
Profiles of local businesses
Business Search - 14 Million verified businesses
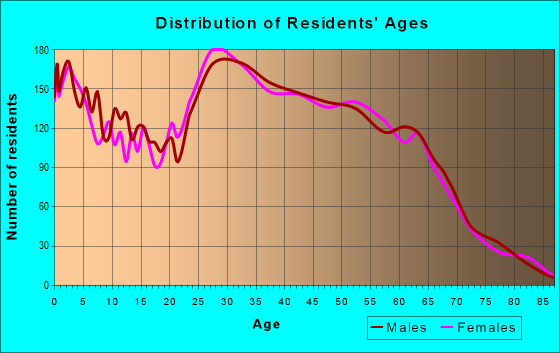
Males: 16,948 Females: 17,443
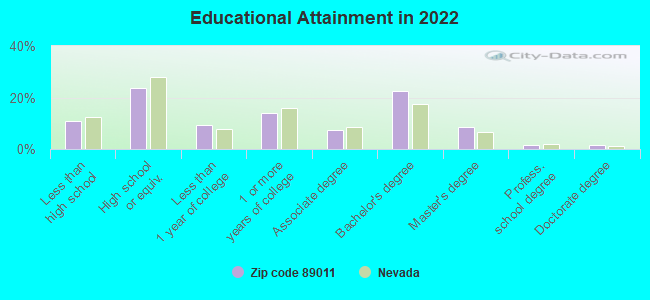
For population 25 years and over in 89011:
High school or higher: 89.2%Bachelor's degree or higher: 34.5%Graduate or professional degree: 11.9%Unemployed: 5.3%Mean travel time to work (commute): 26.1 minutes
For population 15 years and over in 89011:
Never married: 31.9%Now married: 51.2%Separated: 0.9%Widowed: 4.6%Divorced: 11.4%
Zip code 89011 compared to state average:
House age significantly below state average. 16,980 49.4% White 9,575 27.8% Hispanic or Latino 2,834 8.2% Asian 2,450 7.1% Black 1,984 5.8% Two or more races 417 1.2% Some other race 72 0.2% American Indian 73 0.2% Native Hawaiian and Other
Data:
Median household income ($)
Median household income (% change since 2000)
Household income diversity
Ratio of average income to average house value (%)
Ratio of average income to average rent
Median household income ($) - White
Median household income ($) - Black or African American
Median household income ($) - Asian
Median household income ($) - Hispanic or Latino
Median household income ($) - American Indian and Alaska Native
Median household income ($) - Multirace
Median household income ($) - Other Race
Median household income for houses/condos with a mortgage ($)
Median household income for apartments without a mortgage ($)
Races - White alone (%)
Races - White alone (% change since 2000)
Races - Black alone (%)
Races - Black alone (% change since 2000)
Races - American Indian alone (%)
Races - American Indian alone (% change since 2000)
Races - Asian alone (%)
Races - Asian alone (% change since 2000)
Races - Hispanic (%)
Races - Hispanic (% change since 2000)
Races - Native Hawaiian and Other Pacific Islander alone (%)
Races - Native Hawaiian and Other Pacific Islander alone (% change since 2000)
Races - Two or more races (%)
Races - Two or more races (% change since 2000)
Races - Other race alone (%)
Races - Other race alone (% change since 2000)
Racial diversity
Unemployment (%)
Unemployment (% change since 2000)
Unemployment (%) - White
Unemployment (%) - Black or African American
Unemployment (%) - Asian
Unemployment (%) - Hispanic or Latino
Unemployment (%) - American Indian and Alaska Native
Unemployment (%) - Multirace
Unemployment (%) - Other Race
Population density (people per square mile)
Population - Males (%)
Population - Females (%)
Population - Males (%) - White
Population - Males (%) - Black or African American
Population - Males (%) - Asian
Population - Males (%) - Hispanic or Latino
Population - Males (%) - American Indian and Alaska Native
Population - Males (%) - Multirace
Population - Males (%) - Other Race
Population - Females (%) - White
Population - Females (%) - Black or African American
Population - Females (%) - Asian
Population - Females (%) - Hispanic or Latino
Population - Females (%) - American Indian and Alaska Native
Population - Females (%) - Multirace
Population - Females (%) - Other Race
Coronavirus confirmed cases (Jun 08, 2024)
Deaths caused by coronavirus (Jun 08, 2024)
Coronavirus confirmed cases (per 100k population) (Jun 08, 2024)
Deaths caused by coronavirus (per 100k population) (Jun 08, 2024)
Daily increase in number of cases (Jun 08, 2024)
Weekly increase in number of cases (Jun 08, 2024)
Cases doubled (in days) (Jun 08, 2024)
Hospitalized patients (Apr 18, 2022)
Negative test results (Apr 18, 2022)
Total test results (Apr 18, 2022)
COVID Vaccine doses distributed (per 100k population) (Sep 19, 2023)
COVID Vaccine doses administered (per 100k population) (Sep 19, 2023)
COVID Vaccine doses distributed (Sep 19, 2023)
COVID Vaccine doses administered (Sep 19, 2023)
Likely homosexual households (%)
Likely homosexual households (% change since 2000)
Likely homosexual households - Lesbian couples (%)
Likely homosexual households - Lesbian couples (% change since 2000)
Likely homosexual households - Gay men (%)
Likely homosexual households - Gay men (% change since 2000)
Cost of living index
Median gross rent ($)
Median contract rent ($)
Median monthly housing costs ($)
Median house or condo value ($)
Median house or condo value ($ change since 2000)
Mean house or condo value by units in structure - 1, detached ($)
Mean house or condo value by units in structure - 1, attached ($)
Mean house or condo value by units in structure - 2 ($)
Mean house or condo value by units in structure by units in structure - 3 or 4 ($)
Mean house or condo value by units in structure - 5 or more ($)
Mean house or condo value by units in structure - Boat, RV, van, etc. ($)
Mean house or condo value by units in structure - Mobile home ($)
Median house or condo value ($) - White
Median house or condo value ($) - Black or African American
Median house or condo value ($) - Asian
Median house or condo value ($) - Hispanic or Latino
Median house or condo value ($) - American Indian and Alaska Native
Median house or condo value ($) - Multirace
Median house or condo value ($) - Other Race
Median resident age
Resident age diversity
Median resident age - Males
Median resident age - Females
Median resident age - White
Median resident age - Black or African American
Median resident age - Asian
Median resident age - Hispanic or Latino
Median resident age - American Indian and Alaska Native
Median resident age - Multirace
Median resident age - Other Race
Median resident age - Males - White
Median resident age - Males - Black or African American
Median resident age - Males - Asian
Median resident age - Males - Hispanic or Latino
Median resident age - Males - American Indian and Alaska Native
Median resident age - Males - Multirace
Median resident age - Males - Other Race
Median resident age - Females - White
Median resident age - Females - Black or African American
Median resident age - Females - Asian
Median resident age - Females - Hispanic or Latino
Median resident age - Females - American Indian and Alaska Native
Median resident age - Females - Multirace
Median resident age - Females - Other Race
Commute - mean travel time to work (minutes)
Travel time to work - Less than 5 minutes (%)
Travel time to work - Less than 5 minutes (% change since 2000)
Travel time to work - 5 to 9 minutes (%)
Travel time to work - 5 to 9 minutes (% change since 2000)
Travel time to work - 10 to 19 minutes (%)
Travel time to work - 10 to 19 minutes (% change since 2000)
Travel time to work - 20 to 29 minutes (%)
Travel time to work - 20 to 29 minutes (% change since 2000)
Travel time to work - 30 to 39 minutes (%)
Travel time to work - 30 to 39 minutes (% change since 2000)
Travel time to work - 40 to 59 minutes (%)
Travel time to work - 40 to 59 minutes (% change since 2000)
Travel time to work - 60 to 89 minutes (%)
Travel time to work - 60 to 89 minutes (% change since 2000)
Travel time to work - 90 or more minutes (%)
Travel time to work - 90 or more minutes (% change since 2000)
Marital status - Never married (%)
Marital status - Now married (%)
Marital status - Separated (%)
Marital status - Widowed (%)
Marital status - Divorced (%)
Median family income ($)
Median family income (% change since 2000)
Median non-family income ($)
Median non-family income (% change since 2000)
Median per capita income ($)
Median per capita income (% change since 2000)
Median family income ($) - White
Median family income ($) - Black or African American
Median family income ($) - Asian
Median family income ($) - Hispanic or Latino
Median family income ($) - American Indian and Alaska Native
Median family income ($) - Multirace
Median family income ($) - Other Race
Median year house/condo built
Median year apartment built
Year house built - Built 2005 or later (%)
Year house built - Built 2000 to 2004 (%)
Year house built - Built 1990 to 1999 (%)
Year house built - Built 1980 to 1989 (%)
Year house built - Built 1970 to 1979 (%)
Year house built - Built 1960 to 1969 (%)
Year house built - Built 1950 to 1959 (%)
Year house built - Built 1940 to 1949 (%)
Year house built - Built 1939 or earlier (%)
Average household size
Household density (households per square mile)
Average household size - White
Average household size - Black or African American
Average household size - Asian
Average household size - Hispanic or Latino
Average household size - American Indian and Alaska Native
Average household size - Multirace
Average household size - Other Race
Occupied housing units (%)
Vacant housing units (%)
Owner occupied housing units (%)
Renter occupied housing units (%)
Vacancy status - For rent (%)
Vacancy status - For sale only (%)
Vacancy status - Rented or sold, not occupied (%)
Vacancy status - For seasonal, recreational, or occasional use (%)
Vacancy status - For migrant workers (%)
Vacancy status - Other vacant (%)
Residents with income below the poverty level (%)
Residents with income below 50% of the poverty level (%)
Children below poverty level (%)
Poor families by family type - Married-couple family (%)
Poor families by family type - Male, no wife present (%)
Poor families by family type - Female, no husband present (%)
Poverty status for native-born residents (%)
Poverty status for foreign-born residents (%)
Poverty among high school graduates not in families (%)
Poverty among people who did not graduate high school not in families (%)
Residents with income below the poverty level (%) - White
Residents with income below the poverty level (%) - Black or African American
Residents with income below the poverty level (%) - Asian
Residents with income below the poverty level (%) - Hispanic or Latino
Residents with income below the poverty level (%) - American Indian and Alaska Native
Residents with income below the poverty level (%) - Multirace
Residents with income below the poverty level (%) - Other Race
Air pollution - Air Quality Index (AQI)
Air pollution - CO
Air pollution - NO2
Air pollution - SO2
Air pollution - Ozone
Air pollution - PM10
Air pollution - PM25
Air pollution - Pb
Crime - Murders per 100,000 population
Crime - Rapes per 100,000 population
Crime - Robberies per 100,000 population
Crime - Assaults per 100,000 population
Crime - Burglaries per 100,000 population
Crime - Thefts per 100,000 population
Crime - Auto thefts per 100,000 population
Crime - Arson per 100,000 population
Crime - City-data.com crime index
Crime - Violent crime index
Crime - Property crime index
Crime - Murders per 100,000 population (5 year average)
Crime - Rapes per 100,000 population (5 year average)
Crime - Robberies per 100,000 population (5 year average)
Crime - Assaults per 100,000 population (5 year average)
Crime - Burglaries per 100,000 population (5 year average)
Crime - Thefts per 100,000 population (5 year average)
Crime - Auto thefts per 100,000 population (5 year average)
Crime - Arson per 100,000 population (5 year average)
Crime - City-data.com crime index (5 year average)
Crime - Violent crime index (5 year average)
Crime - Property crime index (5 year average)
1996 Presidential Elections Results (%) - Democratic Party (Clinton)
1996 Presidential Elections Results (%) - Republican Party (Dole)
1996 Presidential Elections Results (%) - Other
2000 Presidential Elections Results (%) - Democratic Party (Gore)
2000 Presidential Elections Results (%) - Republican Party (Bush)
2000 Presidential Elections Results (%) - Other
2004 Presidential Elections Results (%) - Democratic Party (Kerry)
2004 Presidential Elections Results (%) - Republican Party (Bush)
2004 Presidential Elections Results (%) - Other
2008 Presidential Elections Results (%) - Democratic Party (Obama)
2008 Presidential Elections Results (%) - Republican Party (McCain)
2008 Presidential Elections Results (%) - Other
2012 Presidential Elections Results (%) - Democratic Party (Obama)
2012 Presidential Elections Results (%) - Republican Party (Romney)
2012 Presidential Elections Results (%) - Other
2016 Presidential Elections Results (%) - Democratic Party (Clinton)
2016 Presidential Elections Results (%) - Republican Party (Trump)
2016 Presidential Elections Results (%) - Other
2020 Presidential Elections Results (%) - Democratic Party (Biden)
2020 Presidential Elections Results (%) - Republican Party (Trump)
2020 Presidential Elections Results (%) - Other
Ancestries Reported - Arab (%)
Ancestries Reported - Czech (%)
Ancestries Reported - Danish (%)
Ancestries Reported - Dutch (%)
Ancestries Reported - English (%)
Ancestries Reported - French (%)
Ancestries Reported - French Canadian (%)
Ancestries Reported - German (%)
Ancestries Reported - Greek (%)
Ancestries Reported - Hungarian (%)
Ancestries Reported - Irish (%)
Ancestries Reported - Italian (%)
Ancestries Reported - Lithuanian (%)
Ancestries Reported - Norwegian (%)
Ancestries Reported - Polish (%)
Ancestries Reported - Portuguese (%)
Ancestries Reported - Russian (%)
Ancestries Reported - Scotch-Irish (%)
Ancestries Reported - Scottish (%)
Ancestries Reported - Slovak (%)
Ancestries Reported - Subsaharan African (%)
Ancestries Reported - Swedish (%)
Ancestries Reported - Swiss (%)
Ancestries Reported - Ukrainian (%)
Ancestries Reported - United States (%)
Ancestries Reported - Welsh (%)
Ancestries Reported - West Indian (%)
Ancestries Reported - Other (%)
Educational Attainment - No schooling completed (%)
Educational Attainment - Less than high school (%)
Educational Attainment - High school or equivalent (%)
Educational Attainment - Less than 1 year of college (%)
Educational Attainment - 1 or more years of college (%)
Educational Attainment - Associate degree (%)
Educational Attainment - Bachelor's degree (%)
Educational Attainment - Master's degree (%)
Educational Attainment - Professional school degree (%)
Educational Attainment - Doctorate degree (%)
School Enrollment - Nursery, preschool (%)
School Enrollment - Kindergarten (%)
School Enrollment - Grade 1 to 4 (%)
School Enrollment - Grade 5 to 8 (%)
School Enrollment - Grade 9 to 12 (%)
School Enrollment - College undergrad (%)
School Enrollment - Graduate or professional (%)
School Enrollment - Not enrolled in school (%)
School enrollment - Public schools (%)
School enrollment - Private schools (%)
School enrollment - Not enrolled (%)
Median number of rooms in houses and condos
Median number of rooms in apartments
Housing units lacking complete plumbing facilities (%)
Housing units lacking complete kitchen facilities (%)
Density of houses
Urban houses (%)
Rural houses (%)
Households with people 60 years and over (%)
Households with people 65 years and over (%)
Households with people 75 years and over (%)
Households with one or more nonrelatives (%)
Households with no nonrelatives (%)
Population in households (%)
Family households (%)
Nonfamily households (%)
Population in families (%)
Family households with own children (%)
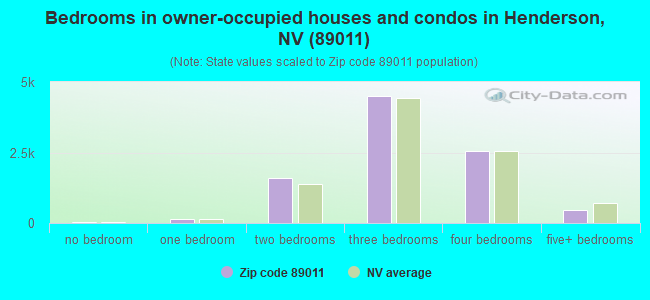
Median number of bedrooms in owner occupied houses
Mean number of bedrooms in owner occupied houses
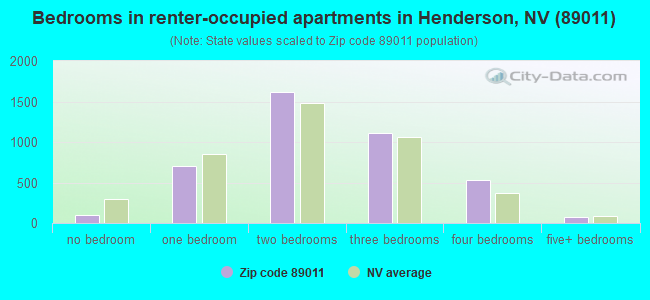
Median number of bedrooms in renter occupied houses
Mean number of bedrooms in renter occupied houses
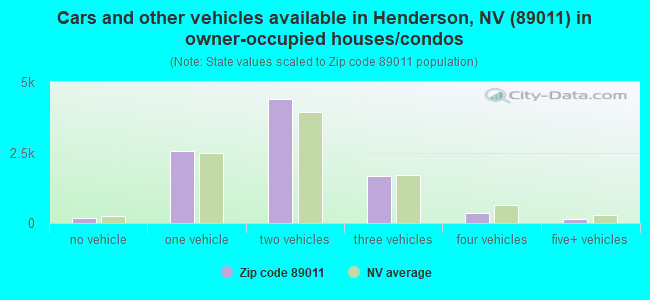
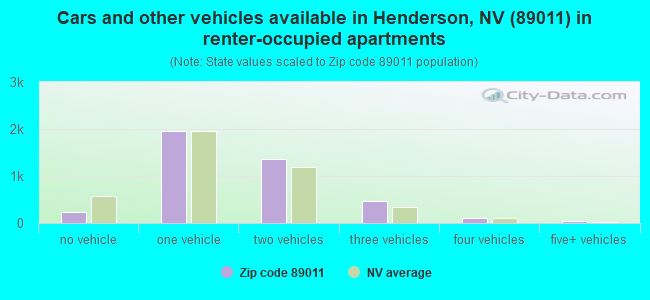
Median number of vehichles in owner occupied houses
Mean number of vehichles in owner occupied houses
Median number of vehichles in renter occupied houses
Mean number of vehichles in renter occupied houses
Mortgage status - with mortgage (%)
Mortgage status - with second mortgage (%)
Mortgage status - with home equity loan (%)
Mortgage status - with both second mortgage and home equity loan (%)
Mortgage status - without a mortgage (%)
Average family size
Average family size - White
Average family size - Black or African American
Average family size - Asian
Average family size - Hispanic or Latino
Average family size - American Indian and Alaska Native
Average family size - Multirace
Average family size - Other Race
Geographical mobility - Same house 1 year ago (%)
Geographical mobility - Moved within same county (%)
Geographical mobility - Moved from different county within same state (%)
Geographical mobility - Moved from different state (%)
Geographical mobility - Moved from abroad (%)
Place of birth - Born in state of residence (%)
Place of birth - Born in other state (%)
Place of birth - Native, outside of US (%)
Place of birth - Foreign born (%)
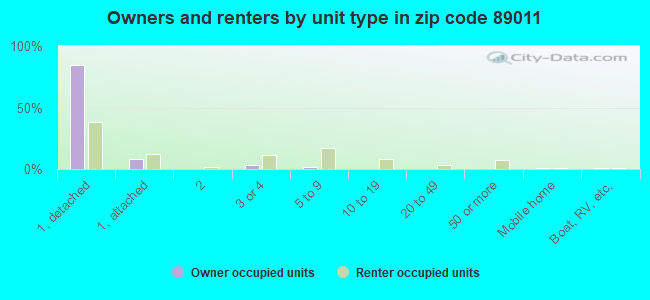
Housing units in structures - 1, detached (%)
Housing units in structures - 1, attached (%)
Housing units in structures - 2 (%)
Housing units in structures - 3 or 4 (%)
Housing units in structures - 5 to 9 (%)
Housing units in structures - 10 to 19 (%)
Housing units in structures - 20 to 49 (%)
Housing units in structures - 50 or more (%)
Housing units in structures - Mobile home (%)
Housing units in structures - Boat, RV, van, etc. (%)
House/condo owner moved in on average (years ago)
Renter moved in on average (years ago)
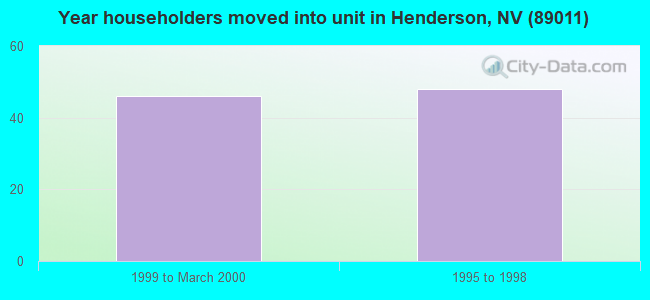
Year householder moved into unit - Moved in 1999 to March 2000 (%)
Year householder moved into unit - Moved in 1995 to 1998 (%)
Year householder moved into unit - Moved in 1990 to 1994 (%)
Year householder moved into unit - Moved in 1980 to 1989 (%)
Year householder moved into unit - Moved in 1970 to 1979 (%)
Year householder moved into unit - Moved in 1969 or earlier (%)
Means of transportation to work - Drove car alone (%)
Means of transportation to work - Carpooled (%)
Means of transportation to work - Public transportation (%)
Means of transportation to work - Bus or trolley bus (%)
Means of transportation to work - Streetcar or trolley car (%)
Means of transportation to work - Subway or elevated (%)
Means of transportation to work - Railroad (%)
Means of transportation to work - Ferryboat (%)
Means of transportation to work - Taxicab (%)
Means of transportation to work - Motorcycle (%)
Means of transportation to work - Bicycle (%)
Means of transportation to work - Walked (%)
Means of transportation to work - Other means (%)
Working at home (%)
Industry diversity
Most Common Industries - Agriculture, forestry, fishing and hunting, and mining (%)
Most Common Industries - Agriculture, forestry, fishing and hunting (%)
Most Common Industries - Mining, quarrying, and oil and gas extraction (%)
Most Common Industries - Construction (%)
Most Common Industries - Manufacturing (%)
Most Common Industries - Wholesale trade (%)
Most Common Industries - Retail trade (%)
Most Common Industries - Transportation and warehousing, and utilities (%)
Most Common Industries - Transportation and warehousing (%)
Most Common Industries - Utilities (%)
Most Common Industries - Information (%)
Most Common Industries - Finance and insurance, and real estate and rental and leasing (%)
Most Common Industries - Finance and insurance (%)
Most Common Industries - Real estate and rental and leasing (%)
Most Common Industries - Professional, scientific, and management, and administrative and waste management services (%)
Most Common Industries - Professional, scientific, and technical services (%)
Most Common Industries - Management of companies and enterprises (%)
Most Common Industries - Administrative and support and waste management services (%)
Most Common Industries - Educational services, and health care and social assistance (%)
Most Common Industries - Educational services (%)
Most Common Industries - Health care and social assistance (%)
Most Common Industries - Arts, entertainment, and recreation, and accommodation and food services (%)
Most Common Industries - Arts, entertainment, and recreation (%)
Most Common Industries - Accommodation and food services (%)
Most Common Industries - Other services, except public administration (%)
Most Common Industries - Public administration (%)
Occupation diversity
Most Common Occupations - Management, business, science, and arts occupations (%)
Most Common Occupations - Management, business, and financial occupations (%)
Most Common Occupations - Management occupations (%)
Most Common Occupations - Business and financial operations occupations (%)
Most Common Occupations - Computer, engineering, and science occupations (%)
Most Common Occupations - Computer and mathematical occupations (%)
Most Common Occupations - Architecture and engineering occupations (%)
Most Common Occupations - Life, physical, and social science occupations (%)
Most Common Occupations - Education, legal, community service, arts, and media occupations (%)
Most Common Occupations - Community and social service occupations (%)
Most Common Occupations - Legal occupations (%)
Most Common Occupations - Education, training, and library occupations (%)
Most Common Occupations - Arts, design, entertainment, sports, and media occupations (%)
Most Common Occupations - Healthcare practitioners and technical occupations (%)
Most Common Occupations - Health diagnosing and treating practitioners and other technical occupations (%)
Most Common Occupations - Health technologists and technicians (%)
Most Common Occupations - Service occupations (%)
Most Common Occupations - Healthcare support occupations (%)
Most Common Occupations - Protective service occupations (%)
Most Common Occupations - Fire fighting and prevention, and other protective service workers including supervisors (%)
Most Common Occupations - Law enforcement workers including supervisors (%)
Most Common Occupations - Food preparation and serving related occupations (%)
Most Common Occupations - Building and grounds cleaning and maintenance occupations (%)
Most Common Occupations - Personal care and service occupations (%)
Most Common Occupations - Sales and office occupations (%)
Most Common Occupations - Sales and related occupations (%)
Most Common Occupations - Office and administrative support occupations (%)
Most Common Occupations - Natural resources, construction, and maintenance occupations (%)
Most Common Occupations - Farming, fishing, and forestry occupations (%)
Most Common Occupations - Construction and extraction occupations (%)
Most Common Occupations - Installation, maintenance, and repair occupations (%)
Most Common Occupations - Production, transportation, and material moving occupations (%)
Most Common Occupations - Production occupations (%)
Most Common Occupations - Transportation occupations (%)
Most Common Occupations - Material moving occupations (%)
People in Group quarters - Institutionalized population (%)
People in Group quarters - Correctional institutions (%)
People in Group quarters - Federal prisons and detention centers (%)
People in Group quarters - Halfway houses (%)
People in Group quarters - Local jails and other confinement facilities (including police lockups) (%)
People in Group quarters - Military disciplinary barracks (%)
People in Group quarters - State prisons (%)
People in Group quarters - Other types of correctional institutions (%)
People in Group quarters - Nursing homes (%)
People in Group quarters - Hospitals/wards, hospices, and schools for the handicapped (%)
People in Group quarters - Hospitals/wards and hospices for chronically ill (%)
People in Group quarters - Hospices or homes for chronically ill (%)
People in Group quarters - Military hospitals or wards for chronically ill (%)
People in Group quarters - Other hospitals or wards for chronically ill (%)
People in Group quarters - Hospitals or wards for drug/alcohol abuse (%)
People in Group quarters - Mental (Psychiatric) hospitals or wards (%)
People in Group quarters - Schools, hospitals, or wards for the mentally retarded (%)
People in Group quarters - Schools, hospitals, or wards for the physically handicapped (%)
People in Group quarters - Institutions for the deaf (%)
People in Group quarters - Institutions for the blind (%)
People in Group quarters - Orthopedic wards and institutions for the physically handicapped (%)
People in Group quarters - Wards in general hospitals for patients who have no usual home elsewhere (%)
People in Group quarters - Wards in military hospitals for patients who have no usual home elsewhere (%)
People in Group quarters - Juvenile institutions (%)
People in Group quarters - Long-term care (%)
People in Group quarters - Homes for abused, dependent, and neglected children (%)
People in Group quarters - Residential treatment centers for emotionally disturbed children (%)
People in Group quarters - Training schools for juvenile delinquents (%)
People in Group quarters - Short-term care, detention or diagnostic centers for delinquent children (%)
People in Group quarters - Type of juvenile institution unknown (%)
People in Group quarters - Noninstitutionalized population (%)
People in Group quarters - College dormitories (includes college quarters off campus) (%)
People in Group quarters - Military quarters (%)
People in Group quarters - On base (%)
People in Group quarters - Barracks, unaccompanied personnel housing (UPH), (Enlisted/Officer), ;and similar group living quarters for military personnel (%)
People in Group quarters - Transient quarters for temporary residents (%)
People in Group quarters - Military ships (%)
People in Group quarters - Group homes (%)
People in Group quarters - Homes or halfway houses for drug/alcohol abuse (%)
People in Group quarters - Homes for the mentally ill (%)
People in Group quarters - Homes for the mentally retarded (%)
People in Group quarters - Homes for the physically handicapped (%)
People in Group quarters - Other group homes (%)
People in Group quarters - Religious group quarters (%)
People in Group quarters - Dormitories (%)
People in Group quarters - Agriculture workers' dormitories on farms (%)
People in Group quarters - Job Corps and vocational training facilities (%)
People in Group quarters - Other workers' dormitories (%)
People in Group quarters - Crews of maritime vessels (%)
People in Group quarters - Other nonhousehold living situations (%)
People in Group quarters - Other noninstitutional group quarters (%)
Residents speaking English at home (%)
Residents speaking English at home - Born in the United States (%)
Residents speaking English at home - Native, born elsewhere (%)
Residents speaking English at home - Foreign born (%)
Residents speaking Spanish at home (%)
Residents speaking Spanish at home - Born in the United States (%)
Residents speaking Spanish at home - Native, born elsewhere (%)
Residents speaking Spanish at home - Foreign born (%)
Residents speaking other language at home (%)
Residents speaking other language at home - Born in the United States (%)
Residents speaking other language at home - Native, born elsewhere (%)
Residents speaking other language at home - Foreign born (%)
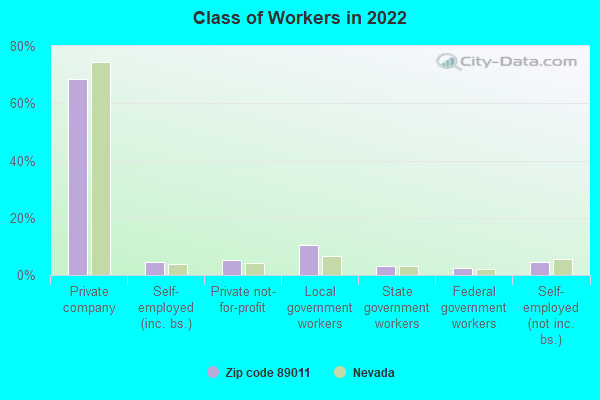
Class of Workers - Employee of private company (%)
Class of Workers - Self-employed in own incorporated business (%)
Class of Workers - Private not-for-profit wage and salary workers (%)
Class of Workers - Local government workers (%)
Class of Workers - State government workers (%)
Class of Workers - Federal government workers (%)
Class of Workers - Self-employed workers in own not incorporated business and Unpaid family workers (%)
House heating fuel used in houses and condos - Utility gas (%)
House heating fuel used in houses and condos - Bottled, tank, or LP gas (%)
House heating fuel used in houses and condos - Electricity (%)
House heating fuel used in houses and condos - Fuel oil, kerosene, etc. (%)
House heating fuel used in houses and condos - Coal or coke (%)
House heating fuel used in houses and condos - Wood (%)
House heating fuel used in houses and condos - Solar energy (%)
House heating fuel used in houses and condos - Other fuel (%)
House heating fuel used in houses and condos - No fuel used (%)
House heating fuel used in apartments - Utility gas (%)
House heating fuel used in apartments - Bottled, tank, or LP gas (%)
House heating fuel used in apartments - Electricity (%)
House heating fuel used in apartments - Fuel oil, kerosene, etc. (%)
House heating fuel used in apartments - Coal or coke (%)
House heating fuel used in apartments - Wood (%)
House heating fuel used in apartments - Solar energy (%)
House heating fuel used in apartments - Other fuel (%)
House heating fuel used in apartments - No fuel used (%)
Armed forces status - In Armed Forces (%)
Armed forces status - Civilian (%)
Armed forces status - Civilian - Veteran (%)
Armed forces status - Civilian - Nonveteran (%)
Fatal accidents locations in years 2005-2021
Fatal accidents locations in 2005
Fatal accidents locations in 2006
Fatal accidents locations in 2007
Fatal accidents locations in 2008
Fatal accidents locations in 2009
Fatal accidents locations in 2010
Fatal accidents locations in 2011
Fatal accidents locations in 2012
Fatal accidents locations in 2013
Fatal accidents locations in 2014
Fatal accidents locations in 2015
Fatal accidents locations in 2016
Fatal accidents locations in 2017
Fatal accidents locations in 2018
Fatal accidents locations in 2019
Fatal accidents locations in 2020
Fatal accidents locations in 2021
Alcohol use - People drinking some alcohol every month (%)
Alcohol use - People not drinking at all (%)
Alcohol use - Average days/month drinking alcohol
Alcohol use - Average drinks/week
Alcohol use - Average days/year people drink much
Audiometry - Average condition of hearing (%)
Audiometry - People that can hear a whisper from across a quiet room (%)
Audiometry - People that can hear normal voice from across a quiet room (%)
Audiometry - Ears ringing, roaring, buzzing (%)
Audiometry - Had a job exposure to loud noise (%)
Audiometry - Had off-work exposure to loud noise (%)
Blood Pressure & Cholesterol - Has high blood pressure (%)
Blood Pressure & Cholesterol - Checking blood pressure at home (%)
Blood Pressure & Cholesterol - Frequently checking blood cholesterol (%)
Blood Pressure & Cholesterol - Has high cholesterol level (%)
Consumer Behavior - Money monthly spent on food at supermarket/grocery store
Consumer Behavior - Money monthly spent on food at other stores
Consumer Behavior - Money monthly spent on eating out
Consumer Behavior - Money monthly spent on carryout/delivered foods
Consumer Behavior - Income spent on food at supermarket/grocery store (%)
Consumer Behavior - Income spent on food at other stores (%)
Consumer Behavior - Income spent on eating out (%)
Consumer Behavior - Income spent on carryout/delivered foods (%)
Current Health Status - General health condition (%)
Current Health Status - Blood donors (%)
Current Health Status - Has blood ever tested for HIV virus (%)
Current Health Status - Left-handed people (%)
Dermatology - People using sunscreen (%)
Diabetes - Diabetics (%)
Diabetes - Had a blood test for high blood sugar (%)
Diabetes - People taking insulin (%)
Diet Behavior & Nutrition - Diet health (%)
Diet Behavior & Nutrition - Milk product consumption (# of products/month)
Diet Behavior & Nutrition - Meals not home prepared (#/week)
Diet Behavior & Nutrition - Meals from fast food or pizza place (#/week)
Diet Behavior & Nutrition - Ready-to-eat foods (#/month)
Diet Behavior & Nutrition - Frozen meals/pizza (#/month)
Drug Use - People that ever used marijuana or hashish (%)
Drug Use - Ever used hard drugs (%)
Drug Use - Ever used any form of cocaine (%)
Drug Use - Ever used heroin (%)
Drug Use - Ever used methamphetamine (%)
Health Insurance - People covered by health insurance (%)
Kidney Conditions-Urology - Avg. # of times urinating at night
Medical Conditions - People with asthma (%)
Medical Conditions - People with anemia (%)
Medical Conditions - People with psoriasis (%)
Medical Conditions - People with overweight (%)
Medical Conditions - Elderly people having difficulties in thinking or remembering (%)
Medical Conditions - People who ever received blood transfusion (%)
Medical Conditions - People having trouble seeing even with glass/contacts (%)
Medical Conditions - People with arthritis (%)
Medical Conditions - People with gout (%)
Medical Conditions - People with congestive heart failure (%)
Medical Conditions - People with coronary heart disease (%)
Medical Conditions - People with angina pectoris (%)
Medical Conditions - People who ever had heart attack (%)
Medical Conditions - People who ever had stroke (%)
Medical Conditions - People with emphysema (%)
Medical Conditions - People with thyroid problem (%)
Medical Conditions - People with chronic bronchitis (%)
Medical Conditions - People with any liver condition (%)
Medical Conditions - People who ever had cancer or malignancy (%)
Mental Health - People who have little interest in doing things (%)
Mental Health - People feeling down, depressed, or hopeless (%)
Mental Health - People who have trouble sleeping or sleeping too much (%)
Mental Health - People feeling tired or having little energy (%)
Mental Health - People with poor appetite or overeating (%)
Mental Health - People feeling bad about themself (%)
Mental Health - People who have trouble concentrating on things (%)
Mental Health - People moving or speaking slowly or too fast (%)
Mental Health - People having thoughts they would be better off dead (%)
Oral Health - Average years since last visit a dentist
Oral Health - People embarrassed because of mouth (%)
Oral Health - People with gum disease (%)
Oral Health - General health of teeth and gums (%)
Oral Health - Average days a week using dental floss/device
Oral Health - Average days a week using mouthwash for dental problem
Oral Health - Average number of teeth
Pesticide Use - Households using pesticides to control insects (%)
Pesticide Use - Households using pesticides to kill weeds (%)
Physical Activity - People doing vigorous-intensity work activities (%)
Physical Activity - People doing moderate-intensity work activities (%)
Physical Activity - People walking or bicycling (%)
Physical Activity - People doing vigorous-intensity recreational activities (%)
Physical Activity - People doing moderate-intensity recreational activities (%)
Physical Activity - Average hours a day doing sedentary activities
Physical Activity - Average hours a day watching TV or videos
Physical Activity - Average hours a day using computer
Physical Functioning - People having limitations keeping them from working (%)
Physical Functioning - People limited in amount of work they can do (%)
Physical Functioning - People that need special equipment to walk (%)
Physical Functioning - People experiencing confusion/memory problems (%)
Physical Functioning - People requiring special healthcare equipment (%)
Prescription Medications - Average number of prescription medicines taking
Preventive Aspirin Use - Adults 40+ taking low-dose aspirin (%)
Reproductive Health - Vaginal deliveries (%)
Reproductive Health - Cesarean deliveries (%)
Reproductive Health - Deliveries resulted in a live birth (%)
Reproductive Health - Pregnancies resulted in a delivery (%)
Reproductive Health - Women breastfeeding newborns (%)
Reproductive Health - Women that had a hysterectomy (%)
Reproductive Health - Women that had both ovaries removed (%)
Reproductive Health - Women that have ever taken birth control pills (%)
Reproductive Health - Women taking birth control pills (%)
Reproductive Health - Women that have ever used Depo-Provera or injectables (%)
Reproductive Health - Women that have ever used female hormones (%)
Sexual Behavior - People 18+ that ever had sex (vaginal, anal, or oral) (%)
Sexual Behavior - Males 18+ that ever had vaginal sex with a woman (%)
Sexual Behavior - Males 18+ that ever performed oral sex on a woman (%)
Sexual Behavior - Males 18+ that ever had anal sex with a woman (%)
Sexual Behavior - Males 18+ that ever had any sex with a man (%)
Sexual Behavior - Females 18+ that ever had vaginal sex with a man (%)
Sexual Behavior - Females 18+ that ever performed oral sex on a man (%)
Sexual Behavior - Females 18+ that ever had anal sex with a man (%)
Sexual Behavior - Females 18+ that ever had any kind of sex with a woman (%)
Sexual Behavior - Average age people first had sex
Sexual Behavior - Average number of female sex partners in lifetime (males 18+)
Sexual Behavior - Average number of female vaginal sex partners in lifetime (males 18+)
Sexual Behavior - Average age people first performed oral sex on a woman (18+)
Sexual Behavior - Average number of woman performed oral sex on in lifetime (18+)
Sexual Behavior - Average number of male sex partners in lifetime (males 18+)
Sexual Behavior - Average number of male anal sex partners in lifetime (males 18+)
Sexual Behavior - Average age people first performed oral sex on a man (18+)
Sexual Behavior - Average number of male oral sex partners in lifetime (18+)
Sexual Behavior - People using protection when performing oral sex (%)
Sexual Behavior - Average number of times people have vaginal or anal sex a year
Sexual Behavior - People having sex without condom (%)
Sexual Behavior - Average number of male sex partners in lifetime (females 18+)
Sexual Behavior - Average number of male vaginal sex partners in lifetime (females 18+)
Sexual Behavior - Average number of female sex partners in lifetime (females 18+)
Sexual Behavior - Circumcised males 18+ (%)
Sleep Disorders - Average hours sleeping at night
Sleep Disorders - People that has trouble sleeping (%)
Smoking-Cigarette Use - People smoking cigarettes (%)
Taste & Smell - People 40+ having problems with smell (%)
Taste & Smell - People 40+ having problems with taste (%)
Taste & Smell - People 40+ that ever had wisdom teeth removed (%)
Taste & Smell - People 40+ that ever had tonsils teeth removed (%)
Taste & Smell - People 40+ that ever had a loss of consciousness because of a head injury (%)
Taste & Smell - People 40+ that ever had a broken nose or other serious injury to face or skull (%)
Taste & Smell - People 40+ that ever had two or more sinus infections (%)
Weight - Average height (inches)
Weight - Average weight (pounds)
Weight - Average BMI
Weight - People that are obese (%)
Weight - People that ever were obese (%)
Weight - People trying to lose weight (%)
100%
rural population.
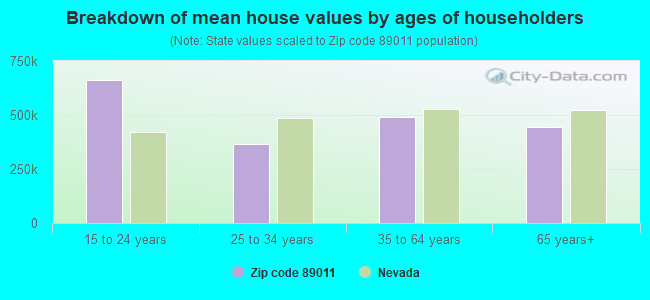
Estimated median house/condo value in 2022: $472,495
89011:
$472,495Nevada:
$434,700
According to our research of Nevada and other state lists, there were 81 registered sex offenders living in 89011 zip code as of June 08, 2024 . The ratio of all residents to sex offenders in zip code 89011 is 269 to 1.The ratio of registered sex offenders to all residents in this zip code is near the state average.
Median resident age: This zip code:
41.4 yearsNevada median age:
39.0 years
Average household size: This zip code:
2.6 peopleNevada:
2.6 people
Averages for the 2020 tax year for zip code 89011, filed in 2021:
Average Adjusted Gross Income (AGI) in 2020: $101,246 (Individual Income Tax Returns) Here:
$101,246State:
$78,964
Salary/wage: $64,318 (reported on 81.4% of returns )Here:
$64,318State:
$54,472
(% of AGI for various income ranges: 1174.5% for AGIs below $25k , 3465.3% for AGIs $25k-50k , 6170.8% for AGIs $50k-75k , 8945.1% for AGIs $75k-100k , 16672.0% for AGIs $100k-200k , 77492.3% for AGIs over 200k ) Taxable interest for individuals: $4,298 (reported on 28.0% of returns )This zip code:
$4,298Nevada:
$3,521
(% of AGI for various income ranges: 12.7% for AGIs below $25k , 15.4% for AGIs $25k-50k , 38.5% for AGIs $50k-75k , 56.6% for AGIs $75k-100k , 146.9% for AGIs $100k-200k , 4807.7% for AGIs over 200k ) Ordinary dividends: $13,427 (reported on 16.9% of returns )Here:
$13,427State:
$13,390
(% of AGI for various income ranges: 18.2% for AGIs below $25k , 30.5% for AGIs $25k-50k , 74.6% for AGIs $50k-75k , 137.0% for AGIs $75k-100k , 315.7% for AGIs $100k-200k , 8780.0% for AGIs over 200k ) Net capital gain/loss in AGI: +$75,387 (reported on 18.2% of returns )Here:
+$75,387State:
+$63,025
(% of AGI for various income ranges: 12.7% for AGIs below $25k , 28.9% for AGIs $25k-50k , 72.9% for AGIs $50k-75k , 154.5% for AGIs $75k-100k , 723.4% for AGIs $100k-200k , 66102.3% for AGIs over 200k ) Profit/loss from business: +$12,234 (reported on 16.2% of returns )Here:
+$12,234State:
+$11,500
(% of AGI for various income ranges: 67.3% for AGIs below $25k , 82.9% for AGIs $25k-50k , 92.1% for AGIs $50k-75k , 191.6% for AGIs $75k-100k , 507.7% for AGIs $100k-200k , 5135.4% for AGIs over 200k ) Taxable individual retirement arrangement distribution: $30,768 (reported on 8.4% of returns )89011:
$30,768Nevada:
$23,628
(% of AGI for various income ranges: 44.6% for AGIs below $25k , 77.5% for AGIs $25k-50k , 161.5% for AGIs $50k-75k , 378.1% for AGIs $75k-100k , 978.2% for AGIs $100k-200k , 5287.4% for AGIs over 200k ) Self-employed (Keogh) retirement plans: $25,329 (reported on 0.4% of returns )89011:
$25,329Nevada:
$26,634
(% of AGI for various income ranges: 25.1% for AGIs $75k-100k , 416.9% for AGIs over 200k ) Total itemized deductions: $45,196 (reported on 13.4% of returns )Here:
$45,196State:
$44,173
(% of AGI for various income ranges: 51.4% for AGIs below $25k , 148.8% for AGIs $25k-50k , 418.3% for AGIs $50k-75k , 662.5% for AGIs $75k-100k , 1658.2% for AGIs $100k-200k , 16596.6% for AGIs over 200k ) Charity contributions: $9,208 (reported on 11.0% of returns )(% of AGI for various income ranges: 4.0% for AGIs below $25k , 18.0% for AGIs $25k-50k , 53.0% for AGIs $50k-75k , 92.0% for AGIs $75k-100k , 299.3% for AGIs $100k-200k , 2959.1% for AGIs over 200k ) Taxes paid: $6,723 (reported on 13.2% of returns )(% of AGI for various income ranges: 8.9% for AGIs below $25k , 29.7% for AGIs $25k-50k , 81.3% for AGIs $50k-75k , 138.4% for AGIs $75k-100k , 340.9% for AGIs $100k-200k , 1649.7% for AGIs over 200k ) Earned income credit: $2,075 (reported on 14.1% of returns )(% of AGI for various income ranges: 87.7% for AGIs below $25k , 59.8% for AGIs $25k-50k , 1.0% for AGIs $50k-75k ) Percentage of individuals using paid preparers for their 2020 taxes: 94.2%(% for various income ranges: 93.2% for AGIs below $25k , 95.2% for AGIs $25k-50k , 93.7% for AGIs $50k-75k , 94.5% for AGIs $75k-100k , 94.3% for AGIs $100k-200k , 95.1% for AGIs over 200k )
Averages for the 2012 tax year for zip code 89011, filed in 2013:
Average Adjusted Gross Income (AGI) in 2012: $76,749 (Individual Income Tax Returns) Here:
$76,749State:
$61,164
Salary/wage: $51,717 (reported on 86.4% of returns )Here:
$51,717State:
$45,924
(% of AGI for various income ranges: 78.7% for AGIs below $25k , 85.1% for AGIs $25k-50k , 82.3% for AGIs $50k-75k , 79.4% for AGIs $75k-100k , 71.8% for AGIs $100k-200k , 30.0% for AGIs over 200k ) Taxable interest for individuals: $5,019 (reported on 22.5% of returns )This zip code:
$5,019Nevada:
$3,137
(% of AGI for various income ranges: 0.7% for AGIs below $25k , 0.4% for AGIs $25k-50k , 0.5% for AGIs $50k-75k , 0.5% for AGIs $75k-100k , 0.8% for AGIs $100k-200k , 2.7% for AGIs over 200k ) Ordinary dividends: $30,038 (reported on 12.5% of returns )Here:
$30,038State:
$11,762
(% of AGI for various income ranges: 2.3% for AGIs below $25k , 1.0% for AGIs $25k-50k , 0.9% for AGIs $50k-75k , 0.8% for AGIs $75k-100k , 1.5% for AGIs $100k-200k , 9.8% for AGIs over 200k ) Net capital gain/loss in AGI: +$51,066 (reported on 11.9% of returns )Here:
+$51,066State:
+$33,127
(% of AGI for various income ranges: 0.1% for AGIs $25k-50k , 0.4% for AGIs $50k-75k , 0.4% for AGIs $75k-100k , 1.1% for AGIs $100k-200k , 17.9% for AGIs over 200k ) Profit/loss from business: +$13,816 (reported on 12.8% of returns )Here:
+$13,816State:
+$12,567
(% of AGI for various income ranges: 6.3% for AGIs below $25k , 1.7% for AGIs $25k-50k , 1.1% for AGIs $50k-75k , 1.4% for AGIs $75k-100k , 2.2% for AGIs $100k-200k , 2.5% for AGIs over 200k ) Taxable individual retirement arrangement distribution: $38,237 (reported on 7.0% of returns )89011:
$38,237Nevada:
$20,808
(% of AGI for various income ranges: 1.8% for AGIs below $25k , 1.7% for AGIs $25k-50k , 1.8% for AGIs $50k-75k , 2.8% for AGIs $75k-100k , 4.5% for AGIs $100k-200k , 4.6% for AGIs over 200k ) Self-employment retirement plans: $33,550 (reported on 0.2% of returns )89011:
$33,550Nevada:
$22,197
Total itemized deductions: $29,673 (18% of AGI, reported on 30.8% of returns )Here:
$29,673State:
$26,148
Here:
17.8% of AGIState:
20.0% of AGI
(% of AGI for various income ranges: 7.9% for AGIs below $25k , 10.0% for AGIs $25k-50k , 13.5% for AGIs $50k-75k , 13.6% for AGIs $75k-100k , 14.9% for AGIs $100k-200k , 11.2% for AGIs over 200k ) Charity contributions: $4,518 (reported on 24.3% of returns )(% of AGI for various income ranges: 0.5% for AGIs below $25k , 0.9% for AGIs $25k-50k , 1.3% for AGIs $50k-75k , 1.4% for AGIs $75k-100k , 1.7% for AGIs $100k-200k , 1.7% for AGIs over 200k ) Taxes paid: $6,422 (reported on 30.2% of returns )(% of AGI for various income ranges: 1.3% for AGIs below $25k , 1.6% for AGIs $25k-50k , 2.3% for AGIs $50k-75k , 2.6% for AGIs $75k-100k , 3.2% for AGIs $100k-200k , 2.8% for AGIs over 200k ) Earned income credit: $2,149 (reported on 18.5% of returns )(% of AGI for various income ranges: 6.3% for AGIs below $25k , 0.9% for AGIs $25k-50k ) Percentage of individuals using paid preparers for their 2012 taxes: 50.1%(% for various income ranges: 45.9% for AGIs below $25k , 46.3% for AGIs $25k-50k , 51.9% for AGIs $50k-75k , 55.1% for AGIs $75k-100k , 58.9% for AGIs $100k-200k , 80.6% for AGIs over 200k )
Averages for the 2004 tax year for zip code 89011, filed in 2005:
Average Adjusted Gross Income (AGI) in 2004: $889,783 (Individual Income Tax Returns) Here:
$889,783State:
$58,367
Salary/wage: $303,874 (reported on 61.2% of returns )Here:
$303,874State:
$42,695
(% of AGI for various income ranges: 93.9% for AGIs $10k-25k , 75.6% for AGIs $50k-75k , 20.0% for AGIs over 100k ) Taxable interest for individuals: $40,962 (reported on 82.2% of returns )This zip code:
$40,962Nevada:
$3,867
(% of AGI for various income ranges: 18.7% for AGIs $10k-25k , 8.1% for AGIs $50k-75k , 3.6% for AGIs over 100k ) Taxable dividends: $90,506 (reported on 61.5% of returns )(% of AGI for various income ranges: 12.7% for AGIs $10k-25k , 6.0% for AGIs over 100k ) Net capital gain/loss: +$486,601 (reported on 71.0% of returns )Here:
+$486,601State:
+$50,644
(% of AGI for various income ranges: -5.5% for AGIs $10k-25k , 2.6% for AGIs $50k-75k , 38.1% for AGIs over 100k ) Profit/loss from business: +$94,165 (reported on 29.7% of returns )Here:
+$94,165State:
+$13,618
Self-employed pension: $40,429 (reported on 4.9% of returns )Here:
$40,429Nevada:
$16,706
Total itemized deductions: $132,367 (12% of AGI, reported on 77.3% of returns )Here:
$132,367State:
$22,990
Here:
11.9% of AGIState:
21.8% of AGI
(% of AGI for various income ranges: 145.9% for AGIs $10k-25k , 89.9% for AGIs $50k-75k , 10.8% for AGIs over 100k ) Charity contributions deductions: $16,286 (1% of AGI, reported on 69.6% of returns )Here:
1.4% of AGIState:
3.1% of AGI
(% of AGI for various income ranges: 5.5% for AGIs $10k-25k , 3.5% for AGIs $50k-75k , 1.2% for AGIs over 100k ) Total tax: $227,709 (reported on 87.8% of returns )89011:
$227,709State:
$10,585
(% of AGI for various income ranges: 6.1% for AGIs $10k-25k , 9.5% for AGIs $25k-50k , 6.9% for AGIs $50k-75k , 13.0% for AGIs $75k-100k , 21.9% for AGIs over 100k ) Percentage of individuals using paid preparers for their 2004 taxes: 86.0%(% for various income ranges: 81.1% for AGIs below $10k , 72.7% for AGIs $10k-25k , 62.5% for AGIs $25k-50k , 150.0% for AGIs $50k-75k , 91.0% for AGIs over 100k )
Estimated median household income in 2022: This zip code:
$85,824Nevada:
$72,333
Nearest zip codes: 89015 ,
89122 ,
89156 ,
89002 ,
89014 ,
89142 .
Whitney Zip Code Map
Percentage of family households: This zip code:
46.1%Nevada:
45.2%
Percentage of households with unmarried partners: This zip code:
6.3%Nevada:
44.2%
Likely homosexual households (counted as self-reported same-sex unmarried-partner households)
Lesbian couples: 0.2% of all households Gay men: 0.3% of all households
Household received Food Stamps/SNAP in the past 12 months: 1,149Household did not receive Food Stamps/SNAP in the past 12 months: 12,117
Women who had a birth in the past 12 months: 432 (380 now married , 75 unmarried) Women who did not have a birth in the past 12 months: 7,696 (2,645 now married , 5,069 unmarried)
Housing units in zip code 89011 with a mortgage: 6,416 (422
second mortgage , 3
home equity loan , 417
both second mortgage and home equity loan )
Houses without a mortgage: 38
Median monthly owner costs for units with a mortgage: $1,811
Median monthly owner costs for units without a mortgage: $516
Residents with income below the poverty level in 2022:
This zip code:
8.4%Whole state:
12.5%
Residents with income below 50% of the poverty level in 2022:
This zip code:
4.1%Whole state:
5.9%
Median number of rooms in houses and condos: Median number of rooms in apartments:
Year house built (houses)
382 2020 or later6,343 2010 to 20194,861 2000 to 20092,566 1990 to 19991,153 1980 to 1989470 1970 to 1979152 1960 to 196968 1950 to 19590 1940 to 194957 1939 or earlier
Zip code 89011 household income distribution in 2022 481 Less than $10,000436 $10,000 to $14,999349 $15,000 to $19,999454 $20,000 to $24,999451 $25,000 to $29,999321 $30,000 to $34,999252 $35,000 to $39,999395 $40,000 to $44,999314 $45,000 to $49,999656 $50,000 to $59,9991,523 $60,000 to $74,9991,890 $75,000 to $99,9991,740 $100,000 to $124,999733 $125,000 to $149,9991,419 $150,000 to $199,9991,918 $200,000 or moreEstimate of home value of owner-occupied houses/condos in 2022 in zip code 89011 110 Less than $10,0004 $10,000 to $14,99942 $15,000 to $19,99957 $20,000 to $24,99969 $25,000 to $29,99910 $30,000 to $34,9997 $35,000 to $39,999107 $40,000 to $49,99926 $60,000 to $69,9997 $70,000 to $79,99939 $80,000 to $89,99917 $100,000 to $124,99911 $125,000 to $149,999124 $150,000 to $174,99984 $175,000 to $199,999301 $200,000 to $249,999432 $250,000 to $299,9992,067 $300,000 to $399,9991,775 $400,000 to $499,9993,439 $500,000 to $749,999559 $750,000 to $999,999281 $1,000,000 to $1,499,999115 $1,500,000 to $1,999,999176 $2,000,000 or moreRent paid by renters in 2022 in zip code 89011 18 $150 to $19914 $450 to $49916 $600 to $64942 $650 to $69969 $700 to $74922 $750 to $799105 $800 to $899130 $900 to $999858 $1,000 to $1,249880 $1,250 to $1,4991,308 $1,500 to $1,999933 $2,000 to $2,49943 $2,500 to $2,99942 $3,500 or more62 No cash rent
Median gross rent in 2022: $1,707.
Median price asked for vacant for-sale houses and condos in 2022: $387,813.
Estimated median house (or condo) value in 2022 for: White Non-Hispanic householders: $472,494Estimated median house or condo value in 2022: $472,495
89011:
$472,495Nevada:
$434,700
Lower value quartile - upper value quartile: $365,048 - $725,518
Mean price in 2022: Detached houses: $588,907Here:
$588,907State:
$549,327
Townhouses or other attached units: $292,071Here:
$292,071State:
$328,893
In 3-to-4-unit structures: $583,724Here:
$583,724State:
$295,216
In 5-or-more-unit structures: $242,472Here:
$242,472State:
$297,847
Mobile homes: $29,248Here:
$29,248State:
$159,995
Occupied boats, RVs, vans, etc.: $98,259Here:
$98,259State:
$92,244
Housing units in structures:
One, detached: 10,401One, attached: 1,496Two: 743 or 4: 8225 to 9: 83310 to 19: 41120 to 49: 27450 or more: 596Mobile homes: 87Boats, RVs, vans, etc.: 125Unemployment : 5.3%
Means of transportation to work in zip code 89011 72.2% 11,767 Drove a car alone8.3% 1,345 Carpooled0.8% 129 Bus or trolley bus0.4% 69 Taxi0.8% 128 Walked2.4% 392 Other means16.0% 2,606 Worked at homeTravel time to work (commute) in zip code 89011 69 Less than 5 minutes709 5 to 9 minutes1,435 10 to 14 minutes2,259 15 to 19 minutes2,179 20 to 24 minutes1,846 25 to 29 minutes3,114 30 to 34 minutes481 35 to 39 minutes487 40 to 44 minutes828 45 to 59 minutes62 60 to 89 minutes398 90 or more minutes
Percentage of zip code residents living and working in this county: 96.6%
Household type by relationship:
Households: 34,389
Male householders: 6,911 (1,610 living alone ), Female householders: 6,430 (1,484 living alone )6,769 spouses (6,629 opposite-sex spouses ), 1,306 unmarried partners , (1,236 opposite-sex unmarried partners ), 9,208 children (8,794 natural , 138 adopted , 262 stepchildren ), 717 grandchildren , 535 brothers or sisters , 680 parents , 0 foster children , 958 other relatives , 935 non-relatives In group quarters: 14 (-1 institutionalized population )
Size of family households: 4,294 2-persons , 2,126 3-persons , 1,429 4-persons , 707 5-persons , 353 6-persons , 164 7-or-more-persons
Size of nonfamily households: 3,094 1-person , 1,123 2-persons , 57 3-persons , 19 4-persons
3,642 married couples with children. single-parent households (733 men , 1,338 women ).
76.1% of residents of 89011 zip code speak English at home. of residents speak Spanish at home (67% very well, 11% well, 15% not well, 7% not at all ).of residents speak other Indo-European language at home (79% very well, 14% well, 7% not well ).of residents speak Asian or Pacific Island language at home (68% very well, 26% well, 3% not well, 3% not at all ).of residents speak other language at home (83% very well, 17% well ).
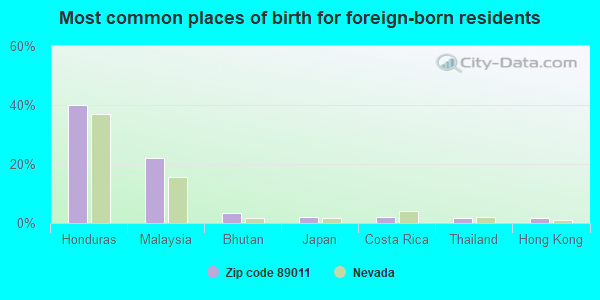
Foreign born population: 5,259 (15.3%)
(51.4%
of them are naturalized citizens )
This zip code:
15.3%Whole state:
18.9%
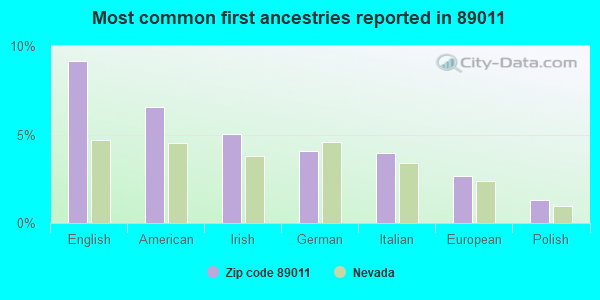
40% Honduras 22% Malaysia 3% Bhutan 2% Japan 2% Costa Rica 2% Thailand 2% Hong Kong 9% English 7% American 5% Irish 4% German 4% Italian 3% European 1% Polish
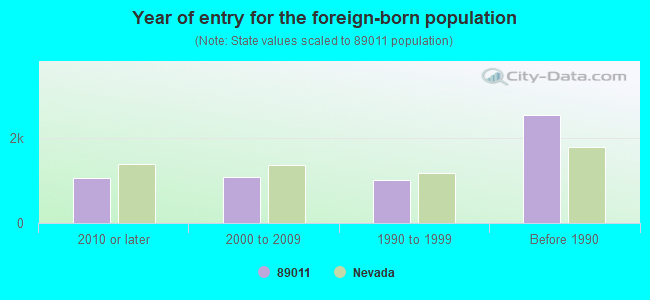
Year of entry for the foreign-born population
1,060 2010 or later 1,086 2000 to 2009 1,002 1990 to 1999 2,528 Before 1990
There are
20 Medical Specialists in Zip Code 89011 .
Facilities with environmental interests located in this zip code:
LAKE LAS VEGAS RESORT (1605 LAS VEGAS PKWY in HENDERSON, NV)
National Pollutant Discharge Elimination System NON-MAJOR (Tracking pollutant discharge elimination systems) - permit Business SIC classification: HOTELS AND MOTELS
Housing units lacking complete plumbing facilities: 0.1%
Housing units lacking complete kitchen facilities: 0.6%
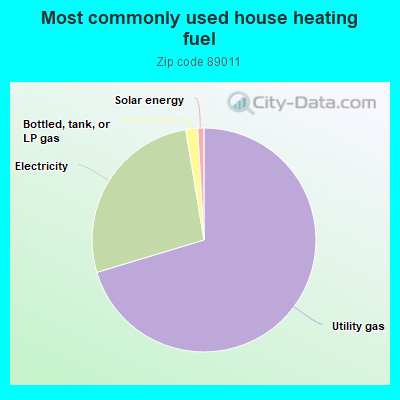
70.2% Utility gas 27.0% Electricity 1.7% Bottled, tank, or LP gas 0.9% Solar energy
Place of birth for U.S.-born residents:
This state: 6,035Northeast: 2,890Midwest: 5,125South: 2,693West: 11,772
16% of the 89011 zip code residents lived in the same house 5 years ago.
Out of people who lived in different houses, 32% lived in this county.
Out of people who lived in different counties, 50% lived in Nevada.
86% of the 89011 zip code residents lived in the same house 1 year ago.
Out of people who lived in different houses, 48% moved from this county.
Out of people who lived in different houses, 1% moved from different county within same state.
Out of people who lived in different houses, 50% moved from different state.
Out of people who lived in different houses, 2% moved from abroad.
Private vs. public school enrollment:
Students in private schools in grades 1 to 8 (elementary and middle school): 359
Students in private schools in grades 9 to 12 (high school): 95
Students in private undergraduate colleges: 134
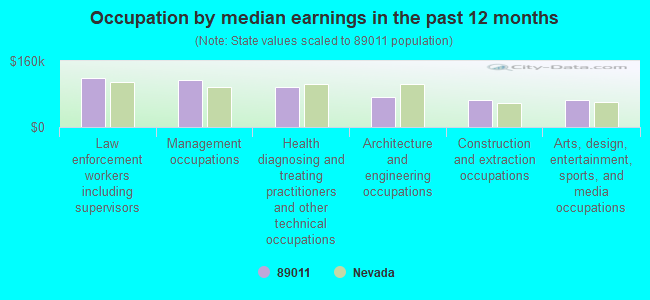
Occupation by median earnings in the past 12 months ($)
118,842 Law enforcement workers including supervisors 113,939 Management occupations 95,881 Health diagnosing and treating practitioners and other technical occupations 71,861 Architecture and engineering occupations 65,533 Construction and extraction occupations 64,638 Arts, design, entertainment, sports, and media occupations
Companies with federal contracts located in this zip code:
Kathy mansfield (41 Grand Miramar Drive in Henderson, NV) in 2 contracts in 2004
$43,000 with Offices, Boards and Divisions (includes Attorney General, Deputy Attorney General, etc.) for Legal Services. Signed on 2004-07-30. Completion date: 2005-07-30.
, same as above. Signed on 2004-07-15. Completion date: 2005-03-01.
Top industries in this zip code by the number of employees in 2005:
Accommodation and Food Services: Hotels (except Casino Hotels) and Motels (500-999 employees: 2 establishments, 1-4 employees: 1 establishment)Arts, Entertainment, and Recreation: Golf Courses and Country Clubs (50-99: 3)Arts, Entertainment, and Recreation: Casinos (except Casino Hotels) (100-249: 1, 20-49: 1)Other Services (except Public Administration): Religious Organizations (100-249: 1, 5-9: 1)Accommodation and Food Services: Full-Service Restaurants (50-99: 1, 20-49: 2)Administrative and Support and Waste Management and Remediation Services: Landscaping Services (50-99: 1, 5-9: 1, 1-4: 1)Construction: Poured Concrete Foundation and Structure Contractors (50-99: 1, 1-4: 1)Arts, Entertainment, and Recreation: Marinas (50-99: 1)Construction: Plumbing, Heating, and Air-Conditioning Contractors (20-49: 1, 10-19: 1)Real Estate and Rental and Leasing: Other Commercial and Industrial Machinery and Equipment Rental and Leasing (20-49: 1, 1-4: 1)
Fatal accident statistics in 2014:
Fatal accident count: 5Vehicles involved in fatal accidents: 9Fatal accidents caused by drunken drivers: 2Fatalities: 6Persons involved in fatal accidents: 10Pedestrians involved in fatal accidents: 1
Fatal accident statistics in 2013:
Fatal accident count: 1Vehicles involved in fatal accidents: 1Fatal accidents caused by drunken drivers: 0Fatalities: 1Persons involved in fatal accidents: 1Pedestrians involved in fatal accidents: 1
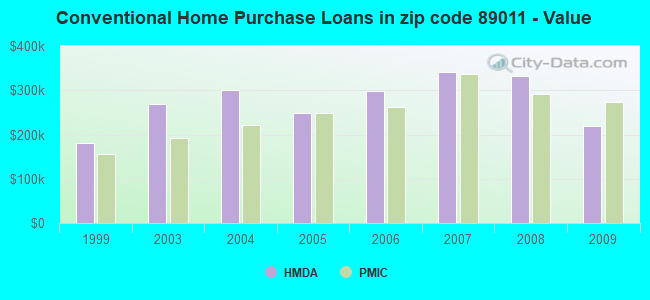
Home Mortgage Disclosure Act Aggregated Statistics For Year 2009(Based on 4 partial tracts) A) FHA, FSA/RHS & VA B) Conventional C) Refinancings D) Home Improvement Loans F) Non-occupant Loans on G) Loans On Manufactured Number Average Value Number Average Value Number Average Value Number Average Value Number Average Value Number Average Value
LOANS ORIGINATED 154 $183,561 127 $220,201 143 $256,428 2 $125,155 69 $222,682 0 $0 APPLICATIONS APPROVED, NOT ACCEPTED 12 $169,697 18 $283,118 10 $231,912 2 $6,820 8 $256,029 1 $99,330 APPLICATIONS DENIED 42 $194,516 44 $241,618 76 $331,479 11 $45,145 30 $258,383 0 $0 APPLICATIONS WITHDRAWN 30 $188,516 21 $245,596 41 $318,539 3 $197,500 11 $243,714 0 $0 FILES CLOSED FOR INCOMPLETENESS 3 $134,070 3 $240,203 7 $264,099 1 $24,670 1 $196,060 0 $0
Aggregated Statistics For Year 2008(Based on 4 partial tracts) A) FHA, FSA/RHS & VA B) Conventional C) Refinancings D) Home Improvement Loans E) Loans on Dwellings For 5+ Families F) Non-occupant Loans on Number Average Value Number Average Value Number Average Value Number Average Value Number Average Value Number Average Value
LOANS ORIGINATED 167 $235,581 177 $332,223 89 $353,179 6 $95,795 0 $0 78 $359,677 APPLICATIONS APPROVED, NOT ACCEPTED 17 $230,920 26 $377,110 21 $373,243 4 $16,110 0 $0 13 $413,785 APPLICATIONS DENIED 50 $235,223 70 $380,209 101 $433,942 12 $268,150 0 $0 38 $512,025 APPLICATIONS WITHDRAWN 39 $232,781 39 $331,602 31 $384,211 2 $84,650 1 $5,609,090 18 $396,138 FILES CLOSED FOR INCOMPLETENESS 2 $266,200 7 $541,857 10 $204,918 1 $68,170 0 $0 2 $182,300
Aggregated Statistics For Year 2007(Based on 4 partial tracts) A) FHA, FSA/RHS & VA B) Conventional C) Refinancings D) Home Improvement Loans E) Loans on Dwellings For 5+ Families F) Non-occupant Loans on G) Loans On Manufactured Number Average Value Number Average Value Number Average Value Number Average Value Number Average Value Number Average Value Number Average Value
LOANS ORIGINATED 27 $275,765 496 $340,441 217 $374,292 18 $211,119 1 $298,630 175 $426,776 0 $0 APPLICATIONS APPROVED, NOT ACCEPTED 0 $0 126 $371,859 59 $401,443 6 $64,448 0 $0 57 $443,118 0 $0 APPLICATIONS DENIED 6 $264,090 219 $432,366 245 $413,356 34 $233,151 0 $0 90 $509,689 1 $64,920 APPLICATIONS WITHDRAWN 8 $263,381 115 $348,747 105 $360,745 4 $130,155 0 $0 50 $397,354 0 $0 FILES CLOSED FOR INCOMPLETENESS 0 $0 28 $359,735 28 $370,199 2 $360,320 0 $0 7 $370,896 0 $0
Aggregated Statistics For Year 2006(Based on 4 partial tracts) A) FHA, FSA/RHS & VA B) Conventional C) Refinancings D) Home Improvement Loans F) Non-occupant Loans on G) Loans On Manufactured Number Average Value Number Average Value Number Average Value Number Average Value Number Average Value Number Average Value
LOANS ORIGINATED 4 $255,722 741 $298,817 331 $346,720 27 $177,243 352 $348,708 1 $33,760 APPLICATIONS APPROVED, NOT ACCEPTED 0 $0 151 $330,469 74 $319,935 12 $95,668 64 $385,667 1 $131,790 APPLICATIONS DENIED 0 $0 239 $340,338 221 $361,181 30 $87,508 97 $437,509 0 $0 APPLICATIONS WITHDRAWN 0 $0 171 $355,476 146 $327,162 13 $168,252 67 $389,202 0 $0 FILES CLOSED FOR INCOMPLETENESS 0 $0 21 $424,543 36 $280,415 2 $118,075 11 $339,985 0 $0
Aggregated Statistics For Year 2005(Based on 4 partial tracts) A) FHA, FSA/RHS & VA B) Conventional C) Refinancings D) Home Improvement Loans E) Loans on Dwellings For 5+ Families F) Non-occupant Loans on G) Loans On Manufactured Number Average Value Number Average Value Number Average Value Number Average Value Number Average Value Number Average Value Number Average Value
LOANS ORIGINATED 4 $248,638 693 $248,359 363 $325,555 39 $143,703 1 $4,349,640 268 $319,136 0 $0 APPLICATIONS APPROVED, NOT ACCEPTED 0 $0 90 $243,639 46 $342,373 6 $71,340 0 $0 30 $242,625 0 $0 APPLICATIONS DENIED 1 $402,500 207 $277,185 144 $445,080 29 $114,586 0 $0 98 $367,356 2 $32,395 APPLICATIONS WITHDRAWN 0 $0 123 $251,705 135 $327,736 16 $177,946 0 $0 46 $306,558 0 $0 FILES CLOSED FOR INCOMPLETENESS 0 $0 34 $246,414 34 $336,738 4 $184,312 0 $0 9 $312,911 0 $0
Aggregated Statistics For Year 2004(Based on 4 partial tracts) A) FHA, FSA/RHS & VA B) Conventional C) Refinancings D) Home Improvement Loans F) Non-occupant Loans on G) Loans On Manufactured Number Average Value Number Average Value Number Average Value Number Average Value Number Average Value Number Average Value
LOANS ORIGINATED 7 $191,149 420 $300,461 345 $254,824 37 $109,621 165 $341,987 0 $0 APPLICATIONS APPROVED, NOT ACCEPTED 0 $0 59 $241,601 51 $281,481 8 $102,181 19 $369,714 0 $0 APPLICATIONS DENIED 3 $141,310 124 $358,106 141 $260,079 43 $66,061 51 $313,536 1 $190,980 APPLICATIONS WITHDRAWN 2 $154,135 80 $274,223 103 $255,582 10 $176,203 31 $329,964 0 $0 FILES CLOSED FOR INCOMPLETENESS 0 $0 16 $275,191 22 $381,548 1 $45,440 5 $350,366 0 $0
Aggregated Statistics For Year 2003(Based on 4 partial tracts) A) FHA, FSA/RHS & VA B) Conventional C) Refinancings D) Home Improvement Loans F) Non-occupant Loans on Number Average Value Number Average Value Number Average Value Number Average Value Number Average Value
LOANS ORIGINATED 26 $285,585 324 $268,147 454 $219,223 25 $35,013 126 $299,644 APPLICATIONS APPROVED, NOT ACCEPTED 1 $149,320 40 $207,580 75 $208,874 7 $53,904 16 $226,442 APPLICATIONS DENIED 9 $164,559 58 $305,109 163 $222,703 20 $36,720 26 $282,092 APPLICATIONS WITHDRAWN 5 $131,398 47 $289,646 113 $202,351 5 $28,184 20 $350,258 FILES CLOSED FOR INCOMPLETENESS 1 $109,070 12 $201,614 16 $160,150 1 $55,540 3 $145,203
Aggregated Statistics For Year 1999(Based on 2 partial tracts) A) FHA, FSA/RHS & VA B) Conventional C) Refinancings D) Home Improvement Loans F) Non-occupant Loans on Number Average Value Number Average Value Number Average Value Number Average Value Number Average Value
LOANS ORIGINATED 69 $112,251 71 $180,549 51 $112,038 18 $25,066 15 $137,966 APPLICATIONS APPROVED, NOT ACCEPTED 2 $119,580 10 $164,772 14 $121,135 8 $23,680 2 $121,165 APPLICATIONS DENIED 13 $109,747 23 $139,243 34 $131,260 21 $22,830 5 $203,960 APPLICATIONS WITHDRAWN 15 $106,733 17 $163,636 23 $113,540 2 $25,565 4 $170,660 FILES CLOSED FOR INCOMPLETENESS 3 $130,010 2 $208,115 4 $121,460 1 $33,520 0 $0
Detailed HMDA statistics for the following Tracts:
0054.11
,
0061.01
Private Mortgage Insurance Companies Aggregated Statistics For Year 2009(Based on 4 partial tracts) A) Conventional B) Refinancings C) Non-occupant Loans on Number Average Value Number Average Value Number Average Value
LOANS ORIGINATED 11 $273,470 1 $225,920 1 $218,780 APPLICATIONS APPROVED, NOT ACCEPTED 9 $236,336 1 $565,450 2 $297,660 APPLICATIONS DENIED 6 $215,858 1 $94,780 1 $220,730 APPLICATIONS WITHDRAWN 2 $218,315 0 $0 1 $110,360 FILES CLOSED FOR INCOMPLETENESS 0 $0 0 $0 0 $0
Aggregated Statistics For Year 2008(Based on 4 partial tracts) A) Conventional B) Refinancings C) Non-occupant Loans on Number Average Value Number Average Value Number Average Value
LOANS ORIGINATED 42 $290,776 4 $280,665 10 $276,300 APPLICATIONS APPROVED, NOT ACCEPTED 16 $329,053 4 $356,570 2 $359,980 APPLICATIONS DENIED 6 $292,688 0 $0 2 $333,060 APPLICATIONS WITHDRAWN 1 $638,030 2 $287,330 1 $234,360 FILES CLOSED FOR INCOMPLETENESS 3 $343,630 0 $0 3 $383,257
Aggregated Statistics For Year 2007(Based on 4 partial tracts) A) Conventional B) Refinancings C) Non-occupant Loans on Number Average Value Number Average Value Number Average Value
LOANS ORIGINATED 77 $336,806 23 $299,190 12 $349,717 APPLICATIONS APPROVED, NOT ACCEPTED 7 $337,534 7 $311,737 0 $0 APPLICATIONS DENIED 4 $321,355 2 $414,795 1 $525,850 APPLICATIONS WITHDRAWN 6 $336,952 2 $480,735 1 $725,160 FILES CLOSED FOR INCOMPLETENESS 1 $118,150 0 $0 1 $118,150
Aggregated Statistics For Year 2006(Based on 4 partial tracts) A) Conventional B) Refinancings C) Non-occupant Loans on Number Average Value Number Average Value Number Average Value
LOANS ORIGINATED 27 $263,050 7 $322,994 10 $188,953 APPLICATIONS APPROVED, NOT ACCEPTED 8 $213,369 3 $328,883 5 $232,302 APPLICATIONS DENIED 1 $453,140 1 $392,770 1 $453,140 APPLICATIONS WITHDRAWN 2 $534,580 1 $295,140 1 $584,930 FILES CLOSED FOR INCOMPLETENESS 1 $232,390 0 $0 0 $0
Aggregated Statistics For Year 2005(Based on 4 partial tracts) A) Conventional B) Refinancings C) Non-occupant Loans on Number Average Value Number Average Value Number Average Value
LOANS ORIGINATED 100 $247,882 11 $276,663 40 $253,440 APPLICATIONS APPROVED, NOT ACCEPTED 26 $279,465 3 $228,950 10 $317,973 APPLICATIONS DENIED 4 $215,682 1 $186,970 3 $222,617 APPLICATIONS WITHDRAWN 7 $262,740 0 $0 3 $301,413 FILES CLOSED FOR INCOMPLETENESS 2 $221,430 0 $0 1 $342,010
Aggregated Statistics For Year 2004(Based on 4 partial tracts) A) Conventional B) Refinancings C) Non-occupant Loans on Number Average Value Number Average Value Number Average Value
LOANS ORIGINATED 67 $221,875 11 $168,475 26 $206,228 APPLICATIONS APPROVED, NOT ACCEPTED 17 $176,645 8 $205,835 7 $177,013 APPLICATIONS DENIED 3 $191,680 0 $0 1 $291,490 APPLICATIONS WITHDRAWN 5 $274,126 0 $0 2 $309,880 FILES CLOSED FOR INCOMPLETENESS 0 $0 0 $0 0 $0
Aggregated Statistics For Year 2003(Based on 4 partial tracts) A) Conventional B) Refinancings C) Non-occupant Loans on Number Average Value Number Average Value Number Average Value
LOANS ORIGINATED 60 $192,763 41 $190,528 12 $174,080 APPLICATIONS APPROVED, NOT ACCEPTED 4 $219,702 13 $185,875 1 $85,690 APPLICATIONS DENIED 0 $0 2 $178,855 0 $0 APPLICATIONS WITHDRAWN 2 $167,170 1 $263,580 0 $0 FILES CLOSED FOR INCOMPLETENESS 0 $0 0 $0 0 $0
Aggregated Statistics For Year 1999(Based on 2 partial tracts) A) Conventional B) Refinancings C) Non-occupant Loans on Number Average Value Number Average Value Number Average Value
LOANS ORIGINATED 17 $154,959 5 $99,610 2 $81,165 APPLICATIONS APPROVED, NOT ACCEPTED 2 $121,725 1 $119,510 0 $0 APPLICATIONS DENIED 1 $86,490 2 $99,740 1 $60,650 APPLICATIONS WITHDRAWN 0 $0 0 $0 0 $0 FILES CLOSED FOR INCOMPLETENESS 0 $0 0 $0 0 $0
Detailed PMIC statistics for the following Tracts:
0054.11
,
0061.01
2002 - 2018 National Fire Incident Reporting System (NFIRS) incidents See full 2006 National Fire Incident Reporting System statistics for zip code 89011, Nevada
Most common first names in zip code 89011 among deceased individuals Name Count Lived (average)
James 8 65.9 years Robert 8 69.8 years Donald 6 71.5 years Mary 6 84.3 years John 4 60.7 years Michael 4 58.2 years Thomas 4 73.2 years Dennis 3 59.0 years Joseph 3 82.4 years Marie 3 79.3 years
Most common last names in zip code 89011 among deceased individuals Last name Count Lived (average)
Davis 3 48.0 years Jones 2 80.0 years Brown 2 65.0 years Bykowski 2 85.1 years Lopez 2 66.5 years Morris 2 81.4 years Richter 2 81.0 years Thompson 2 55.0 years Toth 2 68.0 years Young 2 67.5 years
Businesses in zip code 89011
Name Count Name Count
Ace Hardware 1 Toyota 1 Audi 1 U-Haul 2 Loews 1


 Nearest zip codes: 89015, 89122, 89156, 89002, 89014, 89142.
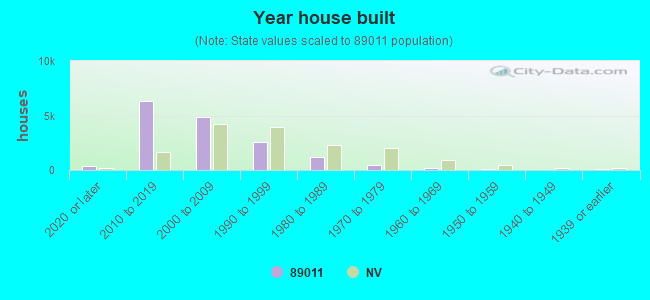


 According to the data from the years 2002 - 2018 the average number of fires per year is 27. The highest number of reported fires - 83 took place in 2018, and the least - 1 in 2003. The data has a growing trend.
 When looking into fire subcategories, the most reports belonged to: Outside Fires (51.5%), and Structure Fires (26.6%).