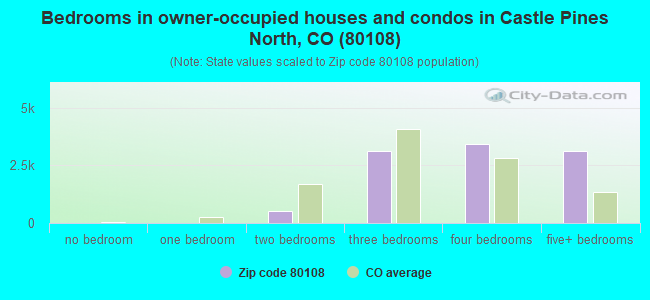
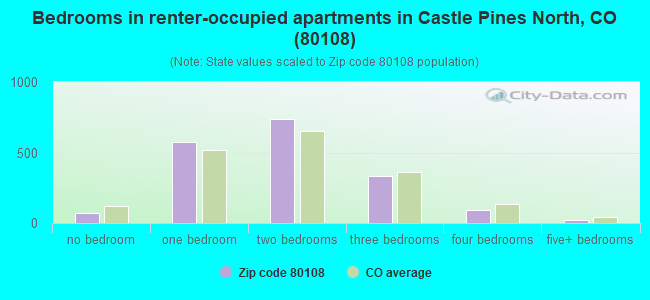
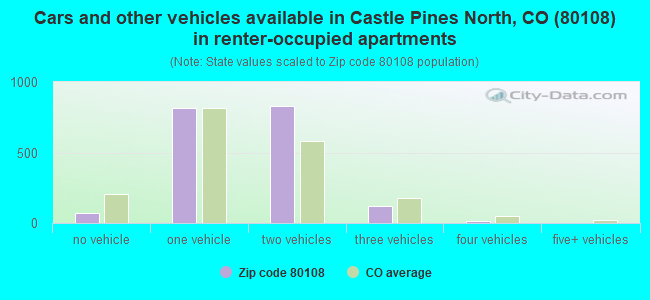
Houses and condos: 12,452 Renter-occupied apartments: 1,844
% of renters here:
15%
State:
34%
March 2022 cost of living index in zip code 80108: 101.9 (near average, U.S. average is 100)
Land area: 35.6 sq. mi. Water area: 0.0 sq. mi.
Population density: 946 people per square mile
(low).
OSM Map
Google Map
MSN Map
OSM Map
General Map
Google Map
MSN Map
OSM Map
Google Map
MSN Map
OSM Map
Google Map
MSN Map
Please wait while loading the map...
Real estate property taxes paid for housing units in 2022:
This zip code:
0.6% ($5,033)
Colorado:
0.5% ($2,422)
Median real estate property taxes paid for housing units with mortgages in 2022: $4,985 (0.6%) Median real estate property taxes paid for housing units with no mortgage in 2022: $5,268 (0.6%)
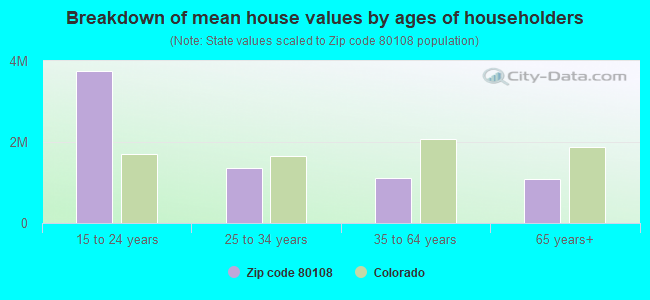
Estimated median house/condo value in 2022: $857,352
80108:
$857,352
Colorado:
$531,100
According to our research of Colorado and other state lists, there were 14 registered sex offenders living in 80108 zip code as of June 08, 2024. The ratio of all residents to sex offenders in zip code 80108 is 1,824 to 1. The ratio of registered sex offenders to all residents in this zip code is much lower than the state average.
Median resident age:
This zip code:
41.6 years
Colorado median age:
37.7 years
Average household size:
This zip code:
2.8 people
Colorado:
2.4 people
Averages for the 2020 tax year for zip code 80108, filed in 2021:
Average Adjusted Gross Income (AGI) in 2020: $187,966 (Individual Income Tax Returns)
Here:
$187,966
State:
$89,260
Salary/wage: $143,735 (reported on 83.0% of returns)
Here:
$143,735
State:
$70,330
(% of AGI for various income ranges: 1209.2% for AGIs below $25k, 3598.0% for AGIs $25k-50k, 6209.0% for AGIs $50k-75k, 9274.9% for AGIs $75k-100k, 19851.1% for AGIs $100k-200k, 100046.4% for AGIs over 200k)
Taxable interest for individuals: $3,872 (reported on 46.1% of returns)
This zip code:
$3,872
Colorado:
$2,176
(% of AGI for various income ranges: 29.4% for AGIs below $25k, 51.1% for AGIs $25k-50k, 81.3% for AGIs $50k-75k, 140.8% for AGIs $75k-100k, 230.9% for AGIs $100k-200k, 1599.0% for AGIs over 200k)
Ordinary dividends: $14,917 (reported on 39.8% of returns)
Here:
$14,917
State:
$8,820
(% of AGI for various income ranges: 63.0% for AGIs below $25k, 134.5% for AGIs $25k-50k, 271.7% for AGIs $50k-75k, 377.2% for AGIs $75k-100k, 574.1% for AGIs $100k-200k, 5805.4% for AGIs over 200k)
Net capital gain/loss in AGI: +$58,759 (reported on 38.5% of returns)
Here:
+$58,759
State:
+$37,276
(% of AGI for various income ranges: 34.1% for AGIs below $25k, 103.9% for AGIs $25k-50k, 230.8% for AGIs $50k-75k, 431.4% for AGIs $75k-100k, 786.3% for AGIs $100k-200k, 26471.3% for AGIs over 200k)
Profit/loss from business: +$22,645 (reported on 20.0% of returns)
Here:
+$22,645
State:
+$15,295
(% of AGI for various income ranges: 98.2% for AGIs below $25k, 200.3% for AGIs $25k-50k, 426.5% for AGIs $50k-75k, 505.3% for AGIs $75k-100k, 791.6% for AGIs $100k-200k, 3352.5% for AGIs over 200k)
Taxable individual retirement arrangement distribution: $37,305 (reported on 12.3% of returns)
80108:
$37,305
Colorado:
$23,785
(% of AGI for various income ranges: 55.0% for AGIs below $25k, 181.8% for AGIs $25k-50k, 459.4% for AGIs $50k-75k, 736.1% for AGIs $75k-100k, 1214.2% for AGIs $100k-200k, 2649.2% for AGIs over 200k)
Self-employed (Keogh) retirement plans: $26,146 (reported on 1.8% of returns)
80108:
$26,146
Colorado:
$23,633
(% of AGI for various income ranges: 41.2% for AGIs $100k-200k, 511.3% for AGIs over 200k)
Total itemized deductions: $40,781 (reported on 30.2% of returns)
Here:
$40,781
State:
$35,141
(% of AGI for various income ranges: 130.7% for AGIs below $25k, 325.0% for AGIs $25k-50k, 678.8% for AGIs $50k-75k, 1232.6% for AGIs $75k-100k, 2380.2% for AGIs $100k-200k, 9630.6% for AGIs over 200k)
Charity contributions: $13,303 (reported on 26.0% of returns)
Here:
$13,303
State:
$12,103
(% of AGI for various income ranges: 10.0% for AGIs below $25k, 31.0% for AGIs $25k-50k, 80.2% for AGIs $50k-75k, 159.2% for AGIs $75k-100k, 366.2% for AGIs $100k-200k, 3515.5% for AGIs over 200k)
Taxes paid: $9,155 (reported on 30.2% of returns)
80108:
$9,155
State:
$7,710
(% of AGI for various income ranges: 21.6% for AGIs below $25k, 55.9% for AGIs $25k-50k, 142.7% for AGIs $50k-75k, 321.8% for AGIs $75k-100k, 678.6% for AGIs $100k-200k, 1924.0% for AGIs over 200k)
Earned income credit: $1,767 (reported on 4.0% of returns)
Here:
$1,767
State:
$2,053
(% of AGI for various income ranges: 30.2% for AGIs below $25k, 32.4% for AGIs $25k-50k)
Percentage of individuals using paid preparers for their 2020 taxes: 93.9%
Here:
94%
State:
93%
(% for various income ranges: 91.5% for AGIs below $25k, 93.3% for AGIs $25k-50k, 93.6% for AGIs $50k-75k, 93.3% for AGIs $75k-100k, 94.7% for AGIs $100k-200k, 95.8% for AGIs over 200k)
Averages for the 2012 tax year for zip code 80108, filed in 2013:
Average Adjusted Gross Income (AGI) in 2012: $182,582 (Individual Income Tax Returns)
Here:
$182,582
State:
$69,103
Salary/wage: $137,058 (reported on 84.6% of returns)
Here:
$137,058
State:
$54,794
(% of AGI for various income ranges: 76.2% for AGIs below $25k, 73.7% for AGIs $25k-50k, 71.4% for AGIs $50k-75k, 66.2% for AGIs $75k-100k, 74.8% for AGIs $100k-200k, 59.1% for AGIs over 200k)
Taxable interest for individuals: $4,183 (reported on 52.2% of returns)
This zip code:
$4,183
Colorado:
$1,971
(% of AGI for various income ranges: 2.0% for AGIs below $25k, 1.5% for AGIs $25k-50k, 1.1% for AGIs $50k-75k, 1.2% for AGIs $75k-100k, 0.7% for AGIs $100k-200k, 1.3% for AGIs over 200k)
Ordinary dividends: $14,617 (reported on 40.7% of returns)
Here:
$14,617
State:
$7,140
(% of AGI for various income ranges: 4.0% for AGIs below $25k, 1.9% for AGIs $25k-50k, 2.4% for AGIs $50k-75k, 2.9% for AGIs $75k-100k, 2.0% for AGIs $100k-200k, 3.7% for AGIs over 200k)
Net capital gain/loss in AGI: +$55,777 (reported on 39.2% of returns)
Here:
+$55,777
State:
+$23,009
(% of AGI for various income ranges: 0.3% for AGIs below $25k, 1.0% for AGIs $25k-50k, 0.6% for AGIs $50k-75k, 1.3% for AGIs $75k-100k, 2.2% for AGIs $100k-200k, 16.6% for AGIs over 200k)
Profit/loss from business: +$26,820 (reported on 20.7% of returns)
Here:
+$26,820
State:
+$13,514
(% of AGI for various income ranges: 6.6% for AGIs below $25k, 5.6% for AGIs $25k-50k, 4.0% for AGIs $50k-75k, 3.7% for AGIs $75k-100k, 4.2% for AGIs $100k-200k, 2.5% for AGIs over 200k)
Taxable individual retirement arrangement distribution: $32,437 (reported on 13.5% of returns)
80108:
$32,437
Colorado:
$17,927
(% of AGI for various income ranges: 5.1% for AGIs below $25k, 4.3% for AGIs $25k-50k, 4.3% for AGIs $50k-75k, 5.3% for AGIs $75k-100k, 4.3% for AGIs $100k-200k, 1.5% for AGIs over 200k)
Self-employment retirement plans: $22,886 (reported on 2.1% of returns)
80108:
$22,886
Colorado:
$19,483
(% of AGI for various income ranges: 0.4% for AGIs $25k-50k, 0.3% for AGIs $100k-200k, 0.3% for AGIs over 200k)
Total itemized deductions: $42,499 (16% of AGI, reported on 62.2% of returns)
Here:
$42,499
State:
$24,621
Here:
15.6% of AGI
State:
18.5% of AGI
(% of AGI for various income ranges: 20.4% for AGIs below $25k, 17.3% for AGIs $25k-50k, 21.6% for AGIs $50k-75k, 20.9% for AGIs $75k-100k, 19.1% for AGIs $100k-200k, 12.2% for AGIs over 200k)
Charity contributions: $7,668 (reported on 56.7% of returns)
Here:
$7,668
State:
$4,449
(% of AGI for various income ranges: 1.2% for AGIs below $25k, 1.6% for AGIs $25k-50k, 2.5% for AGIs $50k-75k, 2.3% for AGIs $75k-100k, 2.4% for AGIs $100k-200k, 2.4% for AGIs over 200k)
Taxes paid: $16,870 (reported on 62.2% of returns)
80108:
$16,870
State:
$7,641
(% of AGI for various income ranges: 3.7% for AGIs below $25k, 3.6% for AGIs $25k-50k, 5.2% for AGIs $50k-75k, 5.9% for AGIs $75k-100k, 6.4% for AGIs $100k-200k, 5.7% for AGIs over 200k)
Earned income credit: $1,716 (reported on 5.4% of returns)
Here:
$1,716
State:
$2,095
(% of AGI for various income ranges: 2.6% for AGIs below $25k, 0.6% for AGIs $25k-50k)
Percentage of individuals using paid preparers for their 2012 taxes: 53.8%
Here:
54%
State:
49%
(% for various income ranges: 41.7% for AGIs below $25k, 48.1% for AGIs $25k-50k, 51.6% for AGIs $50k-75k, 51.1% for AGIs $75k-100k, 54.3% for AGIs $100k-200k, 72.0% for AGIs over 200k)
Averages for the 2004 tax year for zip code 80108, filed in 2005:
Average Adjusted Gross Income (AGI) in 2004: $138,780 (Individual Income Tax Returns)
Here:
$138,780
State:
$55,014
Salary/wage: $116,143 (reported on 86.2% of returns)
Here:
$116,143
State:
$46,010
(% of AGI for various income ranges: 77.9% for AGIs $10k-25k, 79.8% for AGIs $25k-50k, 76.4% for AGIs $50k-75k, 80.3% for AGIs $75k-100k, 69.1% for AGIs over 100k)
Taxable interest for individuals: $4,303 (reported on 64.2% of returns)
This zip code:
$4,303
Colorado:
$2,127
(% of AGI for various income ranges: 3.1% for AGIs $10k-25k, 2.4% for AGIs $25k-50k, 2.1% for AGIs $50k-75k, 1.4% for AGIs $75k-100k, 1.9% for AGIs over 100k)
Taxable dividends: $6,859 (reported on 47.1% of returns)
Here:
$6,859
State:
$3,782
(% of AGI for various income ranges: 3.9% for AGIs $10k-25k, 2.3% for AGIs $25k-50k, 2.0% for AGIs $50k-75k, 1.7% for AGIs $75k-100k, 2.3% for AGIs over 100k)
Net capital gain/loss: +$33,926 (reported on 47.1% of returns)
Here:
+$33,926
State:
+$17,882
(% of AGI for various income ranges: 1.0% for AGIs $10k-25k, 1.5% for AGIs $25k-50k, 2.0% for AGIs $50k-75k, 1.9% for AGIs $75k-100k, 13.2% for AGIs over 100k)
Profit/loss from business: +$22,133 (reported on 21.5% of returns)
Here:
+$22,133
State:
+$11,247
(% of AGI for various income ranges: 8.0% for AGIs $10k-25k, 4.9% for AGIs $25k-50k, 4.5% for AGIs $50k-75k, 4.2% for AGIs $75k-100k, 3.2% for AGIs over 100k)
IRA payment deduction: $3,594 (reported on 3.8% of returns)
80108:
$3,594
Colorado:
$2,947
(% of AGI for various income ranges: 0.5% for AGIs $10k-25k, 0.4% for AGIs $25k-50k, 0.3% for AGIs $50k-75k, 0.2% for AGIs $75k-100k, 0.1% for AGIs over 100k)
Self-employed pension: $14,716 (reported on 3.2% of returns)
Here:
$14,716
Colorado:
$13,653
(% of AGI for various income ranges: 0.2% for AGIs $25k-50k, 0.3% for AGIs $50k-75k, 0.3% for AGIs $75k-100k, 0.4% for AGIs over 100k)
Total itemized deductions: $36,553 (18% of AGI, reported on 66.3% of returns)
Here:
$36,553
State:
$20,560
Here:
18.3% of AGI
State:
21.4% of AGI
(% of AGI for various income ranges: 28.0% for AGIs $10k-25k, 25.0% for AGIs $25k-50k, 26.1% for AGIs $50k-75k, 26.3% for AGIs $75k-100k, 15.4% for AGIs over 100k)
Charity contributions deductions: $4,904 (2% of AGI, reported on 61.6% of returns)
Here:
$4,904
State:
$3,518
Here:
2.5% of AGI
State:
3.4% of AGI
(% of AGI for various income ranges: 1.8% for AGIs $10k-25k, 2.1% for AGIs $25k-50k, 2.8% for AGIs $50k-75k, 2.7% for AGIs $75k-100k, 2.1% for AGIs over 100k)
Total tax: $30,396 (reported on 85.1% of returns)
80108:
$30,396
State:
$9,173
(% of AGI for various income ranges: 5.3% for AGIs $10k-25k, 7.6% for AGIs $25k-50k, 8.7% for AGIs $50k-75k, 9.6% for AGIs $75k-100k, 20.2% for AGIs over 100k)
Earned income credit: $1,234 (reported on 3.8% of returns)
Here:
$1,234
State:
$1,595
Percentage of individuals using paid preparers for their 2004 taxes: 56.1%
Here:
56%
State:
55%
(% for various income ranges: 50.7% for AGIs below $10k, 46.0% for AGIs $10k-25k, 51.6% for AGIs $25k-50k, 56.1% for AGIs $50k-75k, 54.4% for AGIs $75k-100k, 62.6% for AGIs over 100k)
Likely homosexual households (counted as self-reported same-sex unmarried-partner households)
Lesbian couples: 0.0% of all households
Gay men: 0.0% of all households
Household received Food Stamps/SNAP in the past 12 months: 180 Household did not receive Food Stamps/SNAP in the past 12 months: 11,755
Women who had a birth in the past 12 months: 400 (390 now married, 19 unmarried) Women who did not have a birth in the past 12 months: 7,046 (4,073 now married, 2,944 unmarried)
Housing units in zip code 80108 with a mortgage: 7,686 (1,187 second mortgage, 40 home equity loan, 911 both second mortgage and home equity loan) Houses without a mortgage: 317
Median monthly owner costs for units with a mortgage: $3,179 Median monthly owner costs for units without a mortgage: $961
Residents with income below the poverty level in 2022:
This zip code:
3.4%
Whole state:
9.4%
Residents with income below 50% of the poverty level in 2022:
This zip code:
1.3%
Whole state:
4.6%
Median number of rooms in houses and condos:
Here:
9.9
State:
6.8
Median number of rooms in apartments:
Here:
3.9
State:
4.0
Notable locations in this zip code not listed on our city pages
Notable locations in zip code 80108: Happy Canyon Ranch (A), South Metro Fire Rescue Authority Station 39 (B), South Metro Fire Rescue Authority Station 36 (C), Castle Rock Fire and Rescue Department Station 155 (D). Display/hide their locations on the map
6,994 married couples with children.
872 single-parent households (237 men, 635 women).
91.8% of residents of 80108 zip code speak English at home.
3.4% of residents speak Spanish at home (68% very well, 14% well, 3% not well, 15% not at all).
2.4% of residents speak other Indo-European language at home (93% very well, 7% well, 1% not at all).
1.5% of residents speak Asian or Pacific Island language at home (74% very well, 16% well, 9% not well, 1% not at all).
0.9% of residents speak other language at home (65% very well, 35% well).
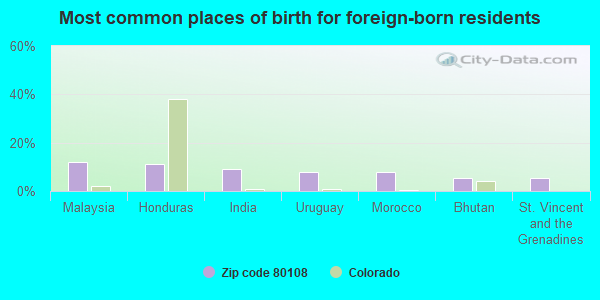
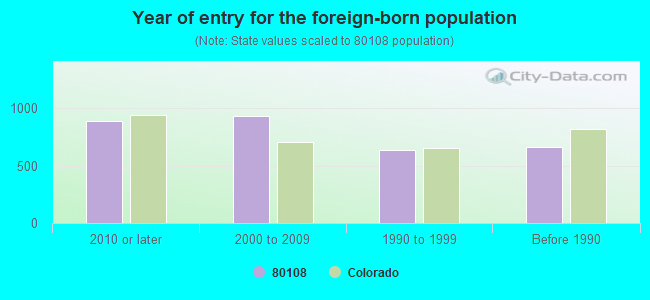
Foreign born population: 2,689 (8.0%) (49.1% of them are naturalized citizens)
This zip code:
8.0%
Whole state:
9.5%
12%Malaysia
11%Honduras
9%India
8%Uruguay
8%Morocco
6%Bhutan
5%St. Vincent and the Grenadines
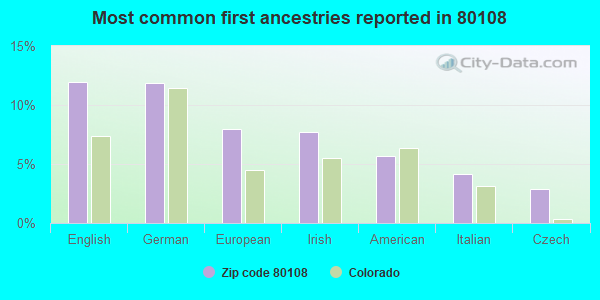
12%English
12%German
8%European
8%Irish
6%American
4%Italian
3%Czech
Year of entry for the foreign-born population
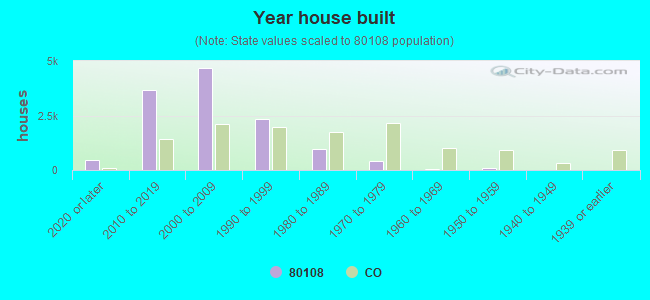
8892010 or later
9302000 to 2009
6351990 to 1999
663Before 1990
Facilities with environmental interests located in this zip code:
BELL MTN RANCH METRO DISTRICT (4260 BELL MOUNTAIN DRIVE in CASTLE ROCK, CO)
National Pollutant Discharge Elimination System NON-MAJOR (Tracking pollutant discharge elimination systems) - permit COMMUNITY WATER SYSTEM (SDWIS) - SDWIS-CO0118002 5, WATER TREATMENT PLANT Business SIC classification: WATER SUPPLY Alternative names: BELL MOUNTAIN RANCH
BUFFALO RIDGE ELEMENTARY SCHOOL (7075 NORTH SHOREHAM DRIVE in CASTLE ROCK, CO)
(National Center for Education Statistics) - STATE ID-1131 Organizations: DOUGLAS COUNTY RE 1 (SCHOOL DISTRICT)
K&G PETROLEUM, LLC (7610 N DEBBIE LN in CASTLE ROCK, CO)
AIR MINOR (AIRS/AFS) Large Quantity Generators, more that 1000 kg of hazardous waste/month (Resource Conservation and Recovery Act (tracking hazardous waste)) Business SIC classification: GASOLINE SERVICE STATIONS Organizations: BP FACILITY #70951 (CONTACT/OPERATOR)
, BP PRODUCTS NORTH AMERICA INC (CONTACT/OWNER)
Alternative names: BP FACILITY #70951, BP NORTH AMERICA - BP #2849
CASTLEWOOD FIRE STATION #36 (421 CASTLE PINES PARKWAY in CASTLE ROCK, CO)
National Pollutant Discharge Elimination System NON-MAJOR (Tracking pollutant discharge elimination systems) - permit Business SIC classification: FIRE PROTECTION Organizations: SOUTH METRO FIRE RESCUE (CONTACT/OWNER)
Alternative names: SOUTH METRO FIRE RESCUE
Housing units lacking complete kitchen facilities: 0.8%
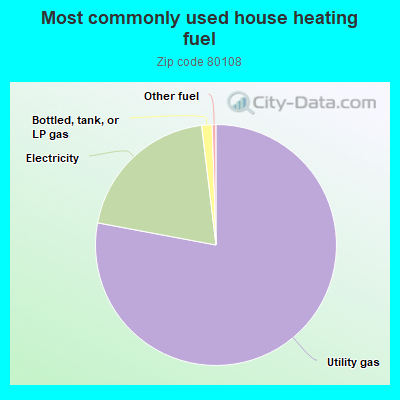
77.8%Utility gas
20.1%Electricity
1.4%Bottled, tank, or LP gas
0.5%Other fuel
Place of birth for U.S.-born residents:
This state: 11,315
Northeast: 2,309
Midwest: 7,046
South: 4,149
West: 5,682
87% of the 80108 zip code residents lived in the same house 1 year ago. Out of people who lived in different houses, 40% moved from this county. Out of people who lived in different houses, 28% moved from different county within same state. Out of people who lived in different houses, 31% moved from different state. Out of people who lived in different houses, 1% moved from abroad.
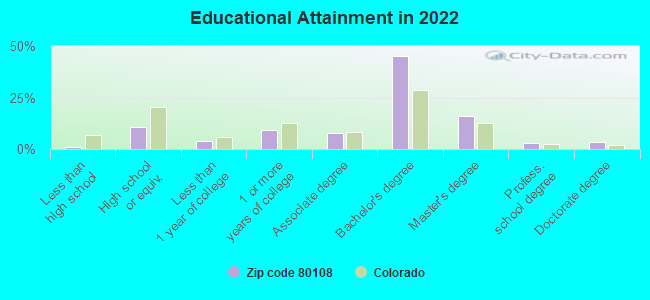
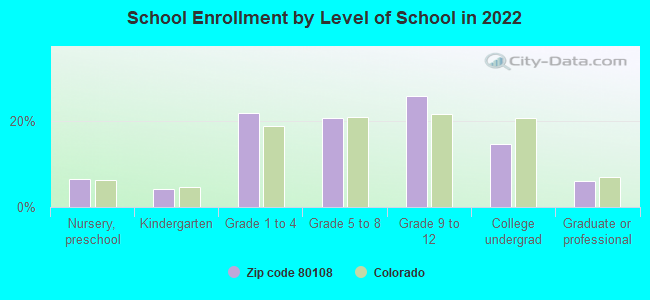
Private vs. public school enrollment:
Students in private schools in grades 1 to 8 (elementary and middle school): 588
Here:
14.9%
Colorado:
11.4%
Students in private schools in grades 9 to 12 (high school): 567
Here:
23.8%
Colorado:
8.5%
Students in private undergraduate colleges: 79
Here:
5.9%
Colorado:
14.0%
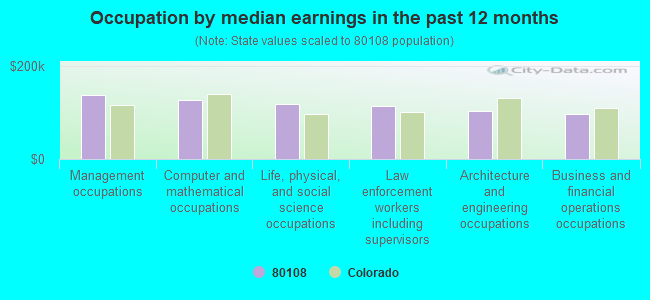
Occupation by median earnings in the past 12 months ($)
137,380Management occupations
127,586Computer and mathematical occupations
117,056Life, physical, and social science occupations
114,035Law enforcement workers including supervisors
102,503Architecture and engineering occupations
97,545Business and financial operations occupations
Companies with federal contracts located in this zip code:
FOX ENVIRONMENTAL SERVICES, IN (7826 in CASTLE ROCK, CO; small business) : $5,882,989 in 22 contractsfrom 1999 to 2005
Contracts for Facilities Operations Support Services, Maintenance, Repair or Alteration of Real Property -- Restoration of real property, Hazardous Substance Removal, Cleanup, and Disposal Services and Operational Support, Other Management Support Services, and moreby Army, U.S. Army Corps of Engineers - civil program financing only, EPA Signed by year:2000: $0; 2001: $2,872,845; 2002: $25,500; 2003: $1,133,890; 2004: $1,044,733; 2005: $780,521; 2006: $0.
Biggest contracts:
$2,561,386 with Army for Facilities Operations Support Services. Signed on 2001-02-22. Completion date: 2002-10-29.
$725,000 with Army for Maintenance, Repair or Alteration of Real Property -- Restoration of real property. Signed on 2005-09-30. Completion date: 2003-11-26.
$696,252, same as above.Signed on 2004-11-23. Completion date: 2003-11-26.
$562,773, same as above.Signed on 2003-01-24. Completion date: 2003-11-26.
TECHNOLOGY ASSET RECOVERY LLC (308 W JUAN WAY in CASTLE ROCK, CO; small business)
$3,225 with Navy for Training Aids. Signed on 2006-04-24. Completion date: 2006-05-18.
Top industries in this zip code by the number of employees in 2005:
Administrative and Support and Waste Management and Remediation Services: Employment Placement Agencies (100-249 employees: 1 establishment)
Accommodation and Food Services: Limited-Service Restaurants (10-19: 3, 1-4: 5)
Real Estate and Rental and Leasing: Offices of Real Estate Agents and Brokers (5-9: 2, 1-4: 12)
Construction: Commercial and Institutional Building Construction (20-49: 1, 1-4: 2)
Fatal accident statistics in 2014:
Fatal accident count: 3
Vehicles involved in fatal accidents: 4
Fatal accidents caused by drunken drivers: 1
Fatalities: 3
Persons involved in fatal accidents: 4
Pedestrians involved in fatal accidents: 1
Fatal accident statistics in 2013:
Fatal accident count: 1
Vehicles involved in fatal accidents: 1
Fatal accidents caused by drunken drivers: 1
Fatalities: 1
Persons involved in fatal accidents: 1
Pedestrians involved in fatal accidents: 0
2003 - 2018 National Fire Incident Reporting System (NFIRS) incidents
Based on the data from the years 2003 - 2018 the average number of fire incidents per year is 30. The highest number of reported fire incidents - 44 took place in 2018, and the least - 17 in 2003. The data has an increasing trend.
When looking into fire subcategories, the most reports belonged to: Structure Fires (37.0%), and Outside Fires (35.8%).
Fire incident types reported to NFIRS in Zip Code 80108


 Based on the data from the years 2003 - 2018 the average number of fire incidents per year is 30. The highest number of reported fire incidents - 44 took place in 2018, and the least - 17 in 2003. The data has an increasing trend.
 When looking into fire subcategories, the most reports belonged to: Structure Fires (37.0%), and Outside Fires (35.8%).