Estimated zip code population in 2022: 11,461
Zip code population in 2010: 17,726
Zip code population in 2000: 11,876
Houses and condos: 5,444
Renter-occupied apartments: 1,110
% of renters here:
23%State:
38%
March 2022 cost of living index in zip code 79108: 83.1
(low, U.S. average is 100)
Land area: 165.4
sq. mi.
Water area: 2.2
sq. mi.
Population density: 69 people per square mile (very low).
OSM Map
General Map
Google Map
MSN Map
OSM Map
General Map
Google Map
MSN Map
OSM Map
General Map
Google Map
MSN Map
OSM Map
General Map
Google Map
MSN Map
Please wait while loading the map...
Real estate property taxes paid for housing units in 2022:
This zip code:
1.3% ($1,893)Texas:
1.5% ($4,050)
Median real estate property taxes paid for housing units with mortgages in 2022: $2,273 (1.4%)
Median real estate property taxes paid for housing units with no mortgage in 2022: $1,574 (1.1%)
Profiles of local businesses
Business Search - 14 Million verified businesses
Males: 5,490 Females: 5,970
For population 25 years and over in 79108:
High school or higher: 84.7%Bachelor's degree or higher: 13.8%Graduate or professional degree: 2.0%Unemployed: 1.9%Mean travel time to work (commute): 20.6 minutes
For population 15 years and over in 79108:
Never married: 30.5%Now married: 48.5%Separated: 1.4%Widowed: 6.6%Divorced: 13.0%
Zip code 79108 compared to state average:
Median house value below state average. Unemployed percentage below state average. Black race population percentage significantly below state average. Median age above state average. Foreign-born population percentage below state average. Renting percentage below state average. Length of stay since moving in above state average. Percentage of population with a bachelor's degree or higher significantly below state average. 7,438 64.9% White 3,147 27.5% Hispanic or Latino 479 4.2% Two or more races 301 2.6% Black 65 0.6% American Indian 13 0.1% Asian 14 0.1% Native Hawaiian and Other
Data:
Median household income ($)
Median household income (% change since 2000)
Household income diversity
Ratio of average income to average house value (%)
Ratio of average income to average rent
Median household income ($) - White
Median household income ($) - Black or African American
Median household income ($) - Asian
Median household income ($) - Hispanic or Latino
Median household income ($) - American Indian and Alaska Native
Median household income ($) - Multirace
Median household income ($) - Other Race
Median household income for houses/condos with a mortgage ($)
Median household income for apartments without a mortgage ($)
Races - White alone (%)
Races - White alone (% change since 2000)
Races - Black alone (%)
Races - Black alone (% change since 2000)
Races - American Indian alone (%)
Races - American Indian alone (% change since 2000)
Races - Asian alone (%)
Races - Asian alone (% change since 2000)
Races - Hispanic (%)
Races - Hispanic (% change since 2000)
Races - Native Hawaiian and Other Pacific Islander alone (%)
Races - Native Hawaiian and Other Pacific Islander alone (% change since 2000)
Races - Two or more races (%)
Races - Two or more races (% change since 2000)
Races - Other race alone (%)
Races - Other race alone (% change since 2000)
Racial diversity
Unemployment (%)
Unemployment (% change since 2000)
Unemployment (%) - White
Unemployment (%) - Black or African American
Unemployment (%) - Asian
Unemployment (%) - Hispanic or Latino
Unemployment (%) - American Indian and Alaska Native
Unemployment (%) - Multirace
Unemployment (%) - Other Race
Population density (people per square mile)
Population - Males (%)
Population - Females (%)
Population - Males (%) - White
Population - Males (%) - Black or African American
Population - Males (%) - Asian
Population - Males (%) - Hispanic or Latino
Population - Males (%) - American Indian and Alaska Native
Population - Males (%) - Multirace
Population - Males (%) - Other Race
Population - Females (%) - White
Population - Females (%) - Black or African American
Population - Females (%) - Asian
Population - Females (%) - Hispanic or Latino
Population - Females (%) - American Indian and Alaska Native
Population - Females (%) - Multirace
Population - Females (%) - Other Race
Coronavirus confirmed cases (Jun 03, 2024)
Deaths caused by coronavirus (Jun 03, 2024)
Coronavirus confirmed cases (per 100k population) (Jun 03, 2024)
Deaths caused by coronavirus (per 100k population) (Jun 03, 2024)
Daily increase in number of cases (Jun 03, 2024)
Weekly increase in number of cases (Jun 03, 2024)
Cases doubled (in days) (Jun 03, 2024)
Hospitalized patients (Apr 18, 2022)
Negative test results (Apr 18, 2022)
Total test results (Apr 18, 2022)
COVID Vaccine doses distributed (per 100k population) (Sep 19, 2023)
COVID Vaccine doses administered (per 100k population) (Sep 19, 2023)
COVID Vaccine doses distributed (Sep 19, 2023)
COVID Vaccine doses administered (Sep 19, 2023)
Likely homosexual households (%)
Likely homosexual households (% change since 2000)
Likely homosexual households - Lesbian couples (%)
Likely homosexual households - Lesbian couples (% change since 2000)
Likely homosexual households - Gay men (%)
Likely homosexual households - Gay men (% change since 2000)
Cost of living index
Median gross rent ($)
Median contract rent ($)
Median monthly housing costs ($)
Median house or condo value ($)
Median house or condo value ($ change since 2000)
Mean house or condo value by units in structure - 1, detached ($)
Mean house or condo value by units in structure - 1, attached ($)
Mean house or condo value by units in structure - 2 ($)
Mean house or condo value by units in structure by units in structure - 3 or 4 ($)
Mean house or condo value by units in structure - 5 or more ($)
Mean house or condo value by units in structure - Boat, RV, van, etc. ($)
Mean house or condo value by units in structure - Mobile home ($)
Median house or condo value ($) - White
Median house or condo value ($) - Black or African American
Median house or condo value ($) - Asian
Median house or condo value ($) - Hispanic or Latino
Median house or condo value ($) - American Indian and Alaska Native
Median house or condo value ($) - Multirace
Median house or condo value ($) - Other Race
Median resident age
Resident age diversity
Median resident age - Males
Median resident age - Females
Median resident age - White
Median resident age - Black or African American
Median resident age - Asian
Median resident age - Hispanic or Latino
Median resident age - American Indian and Alaska Native
Median resident age - Multirace
Median resident age - Other Race
Median resident age - Males - White
Median resident age - Males - Black or African American
Median resident age - Males - Asian
Median resident age - Males - Hispanic or Latino
Median resident age - Males - American Indian and Alaska Native
Median resident age - Males - Multirace
Median resident age - Males - Other Race
Median resident age - Females - White
Median resident age - Females - Black or African American
Median resident age - Females - Asian
Median resident age - Females - Hispanic or Latino
Median resident age - Females - American Indian and Alaska Native
Median resident age - Females - Multirace
Median resident age - Females - Other Race
Commute - mean travel time to work (minutes)
Travel time to work - Less than 5 minutes (%)
Travel time to work - Less than 5 minutes (% change since 2000)
Travel time to work - 5 to 9 minutes (%)
Travel time to work - 5 to 9 minutes (% change since 2000)
Travel time to work - 10 to 19 minutes (%)
Travel time to work - 10 to 19 minutes (% change since 2000)
Travel time to work - 20 to 29 minutes (%)
Travel time to work - 20 to 29 minutes (% change since 2000)
Travel time to work - 30 to 39 minutes (%)
Travel time to work - 30 to 39 minutes (% change since 2000)
Travel time to work - 40 to 59 minutes (%)
Travel time to work - 40 to 59 minutes (% change since 2000)
Travel time to work - 60 to 89 minutes (%)
Travel time to work - 60 to 89 minutes (% change since 2000)
Travel time to work - 90 or more minutes (%)
Travel time to work - 90 or more minutes (% change since 2000)
Marital status - Never married (%)
Marital status - Now married (%)
Marital status - Separated (%)
Marital status - Widowed (%)
Marital status - Divorced (%)
Median family income ($)
Median family income (% change since 2000)
Median non-family income ($)
Median non-family income (% change since 2000)
Median per capita income ($)
Median per capita income (% change since 2000)
Median family income ($) - White
Median family income ($) - Black or African American
Median family income ($) - Asian
Median family income ($) - Hispanic or Latino
Median family income ($) - American Indian and Alaska Native
Median family income ($) - Multirace
Median family income ($) - Other Race
Median year house/condo built
Median year apartment built
Year house built - Built 2005 or later (%)
Year house built - Built 2000 to 2004 (%)
Year house built - Built 1990 to 1999 (%)
Year house built - Built 1980 to 1989 (%)
Year house built - Built 1970 to 1979 (%)
Year house built - Built 1960 to 1969 (%)
Year house built - Built 1950 to 1959 (%)
Year house built - Built 1940 to 1949 (%)
Year house built - Built 1939 or earlier (%)
Average household size
Household density (households per square mile)
Average household size - White
Average household size - Black or African American
Average household size - Asian
Average household size - Hispanic or Latino
Average household size - American Indian and Alaska Native
Average household size - Multirace
Average household size - Other Race
Occupied housing units (%)
Vacant housing units (%)
Owner occupied housing units (%)
Renter occupied housing units (%)
Vacancy status - For rent (%)
Vacancy status - For sale only (%)
Vacancy status - Rented or sold, not occupied (%)
Vacancy status - For seasonal, recreational, or occasional use (%)
Vacancy status - For migrant workers (%)
Vacancy status - Other vacant (%)
Residents with income below the poverty level (%)
Residents with income below 50% of the poverty level (%)
Children below poverty level (%)
Poor families by family type - Married-couple family (%)
Poor families by family type - Male, no wife present (%)
Poor families by family type - Female, no husband present (%)
Poverty status for native-born residents (%)
Poverty status for foreign-born residents (%)
Poverty among high school graduates not in families (%)
Poverty among people who did not graduate high school not in families (%)
Residents with income below the poverty level (%) - White
Residents with income below the poverty level (%) - Black or African American
Residents with income below the poverty level (%) - Asian
Residents with income below the poverty level (%) - Hispanic or Latino
Residents with income below the poverty level (%) - American Indian and Alaska Native
Residents with income below the poverty level (%) - Multirace
Residents with income below the poverty level (%) - Other Race
Air pollution - Air Quality Index (AQI)
Air pollution - CO
Air pollution - NO2
Air pollution - SO2
Air pollution - Ozone
Air pollution - PM10
Air pollution - PM25
Air pollution - Pb
Crime - Murders per 100,000 population
Crime - Rapes per 100,000 population
Crime - Robberies per 100,000 population
Crime - Assaults per 100,000 population
Crime - Burglaries per 100,000 population
Crime - Thefts per 100,000 population
Crime - Auto thefts per 100,000 population
Crime - Arson per 100,000 population
Crime - City-data.com crime index
Crime - Violent crime index
Crime - Property crime index
Crime - Murders per 100,000 population (5 year average)
Crime - Rapes per 100,000 population (5 year average)
Crime - Robberies per 100,000 population (5 year average)
Crime - Assaults per 100,000 population (5 year average)
Crime - Burglaries per 100,000 population (5 year average)
Crime - Thefts per 100,000 population (5 year average)
Crime - Auto thefts per 100,000 population (5 year average)
Crime - Arson per 100,000 population (5 year average)
Crime - City-data.com crime index (5 year average)
Crime - Violent crime index (5 year average)
Crime - Property crime index (5 year average)
1996 Presidential Elections Results (%) - Democratic Party (Clinton)
1996 Presidential Elections Results (%) - Republican Party (Dole)
1996 Presidential Elections Results (%) - Other
2000 Presidential Elections Results (%) - Democratic Party (Gore)
2000 Presidential Elections Results (%) - Republican Party (Bush)
2000 Presidential Elections Results (%) - Other
2004 Presidential Elections Results (%) - Democratic Party (Kerry)
2004 Presidential Elections Results (%) - Republican Party (Bush)
2004 Presidential Elections Results (%) - Other
2008 Presidential Elections Results (%) - Democratic Party (Obama)
2008 Presidential Elections Results (%) - Republican Party (McCain)
2008 Presidential Elections Results (%) - Other
2012 Presidential Elections Results (%) - Democratic Party (Obama)
2012 Presidential Elections Results (%) - Republican Party (Romney)
2012 Presidential Elections Results (%) - Other
2016 Presidential Elections Results (%) - Democratic Party (Clinton)
2016 Presidential Elections Results (%) - Republican Party (Trump)
2016 Presidential Elections Results (%) - Other
2020 Presidential Elections Results (%) - Democratic Party (Biden)
2020 Presidential Elections Results (%) - Republican Party (Trump)
2020 Presidential Elections Results (%) - Other
Ancestries Reported - Arab (%)
Ancestries Reported - Czech (%)
Ancestries Reported - Danish (%)
Ancestries Reported - Dutch (%)
Ancestries Reported - English (%)
Ancestries Reported - French (%)
Ancestries Reported - French Canadian (%)
Ancestries Reported - German (%)
Ancestries Reported - Greek (%)
Ancestries Reported - Hungarian (%)
Ancestries Reported - Irish (%)
Ancestries Reported - Italian (%)
Ancestries Reported - Lithuanian (%)
Ancestries Reported - Norwegian (%)
Ancestries Reported - Polish (%)
Ancestries Reported - Portuguese (%)
Ancestries Reported - Russian (%)
Ancestries Reported - Scotch-Irish (%)
Ancestries Reported - Scottish (%)
Ancestries Reported - Slovak (%)
Ancestries Reported - Subsaharan African (%)
Ancestries Reported - Swedish (%)
Ancestries Reported - Swiss (%)
Ancestries Reported - Ukrainian (%)
Ancestries Reported - United States (%)
Ancestries Reported - Welsh (%)
Ancestries Reported - West Indian (%)
Ancestries Reported - Other (%)
Educational Attainment - No schooling completed (%)
Educational Attainment - Less than high school (%)
Educational Attainment - High school or equivalent (%)
Educational Attainment - Less than 1 year of college (%)
Educational Attainment - 1 or more years of college (%)
Educational Attainment - Associate degree (%)
Educational Attainment - Bachelor's degree (%)
Educational Attainment - Master's degree (%)
Educational Attainment - Professional school degree (%)
Educational Attainment - Doctorate degree (%)
School Enrollment - Nursery, preschool (%)
School Enrollment - Kindergarten (%)
School Enrollment - Grade 1 to 4 (%)
School Enrollment - Grade 5 to 8 (%)
School Enrollment - Grade 9 to 12 (%)
School Enrollment - College undergrad (%)
School Enrollment - Graduate or professional (%)
School Enrollment - Not enrolled in school (%)
School enrollment - Public schools (%)
School enrollment - Private schools (%)
School enrollment - Not enrolled (%)
Median number of rooms in houses and condos
Median number of rooms in apartments
Housing units lacking complete plumbing facilities (%)
Housing units lacking complete kitchen facilities (%)
Density of houses
Urban houses (%)
Rural houses (%)
Households with people 60 years and over (%)
Households with people 65 years and over (%)
Households with people 75 years and over (%)
Households with one or more nonrelatives (%)
Households with no nonrelatives (%)
Population in households (%)
Family households (%)
Nonfamily households (%)
Population in families (%)
Family households with own children (%)
Median number of bedrooms in owner occupied houses
Mean number of bedrooms in owner occupied houses
Median number of bedrooms in renter occupied houses
Mean number of bedrooms in renter occupied houses
Median number of vehichles in owner occupied houses
Mean number of vehichles in owner occupied houses
Median number of vehichles in renter occupied houses
Mean number of vehichles in renter occupied houses
Mortgage status - with mortgage (%)
Mortgage status - with second mortgage (%)
Mortgage status - with home equity loan (%)
Mortgage status - with both second mortgage and home equity loan (%)
Mortgage status - without a mortgage (%)
Average family size
Average family size - White
Average family size - Black or African American
Average family size - Asian
Average family size - Hispanic or Latino
Average family size - American Indian and Alaska Native
Average family size - Multirace
Average family size - Other Race
Geographical mobility - Same house 1 year ago (%)
Geographical mobility - Moved within same county (%)
Geographical mobility - Moved from different county within same state (%)
Geographical mobility - Moved from different state (%)
Geographical mobility - Moved from abroad (%)
Place of birth - Born in state of residence (%)
Place of birth - Born in other state (%)
Place of birth - Native, outside of US (%)
Place of birth - Foreign born (%)
Housing units in structures - 1, detached (%)
Housing units in structures - 1, attached (%)
Housing units in structures - 2 (%)
Housing units in structures - 3 or 4 (%)
Housing units in structures - 5 to 9 (%)
Housing units in structures - 10 to 19 (%)
Housing units in structures - 20 to 49 (%)
Housing units in structures - 50 or more (%)
Housing units in structures - Mobile home (%)
Housing units in structures - Boat, RV, van, etc. (%)
House/condo owner moved in on average (years ago)
Renter moved in on average (years ago)
Year householder moved into unit - Moved in 1999 to March 2000 (%)
Year householder moved into unit - Moved in 1995 to 1998 (%)
Year householder moved into unit - Moved in 1990 to 1994 (%)
Year householder moved into unit - Moved in 1980 to 1989 (%)
Year householder moved into unit - Moved in 1970 to 1979 (%)
Year householder moved into unit - Moved in 1969 or earlier (%)
Means of transportation to work - Drove car alone (%)
Means of transportation to work - Carpooled (%)
Means of transportation to work - Public transportation (%)
Means of transportation to work - Bus or trolley bus (%)
Means of transportation to work - Streetcar or trolley car (%)
Means of transportation to work - Subway or elevated (%)
Means of transportation to work - Railroad (%)
Means of transportation to work - Ferryboat (%)
Means of transportation to work - Taxicab (%)
Means of transportation to work - Motorcycle (%)
Means of transportation to work - Bicycle (%)
Means of transportation to work - Walked (%)
Means of transportation to work - Other means (%)
Working at home (%)
Industry diversity
Most Common Industries - Agriculture, forestry, fishing and hunting, and mining (%)
Most Common Industries - Agriculture, forestry, fishing and hunting (%)
Most Common Industries - Mining, quarrying, and oil and gas extraction (%)
Most Common Industries - Construction (%)
Most Common Industries - Manufacturing (%)
Most Common Industries - Wholesale trade (%)
Most Common Industries - Retail trade (%)
Most Common Industries - Transportation and warehousing, and utilities (%)
Most Common Industries - Transportation and warehousing (%)
Most Common Industries - Utilities (%)
Most Common Industries - Information (%)
Most Common Industries - Finance and insurance, and real estate and rental and leasing (%)
Most Common Industries - Finance and insurance (%)
Most Common Industries - Real estate and rental and leasing (%)
Most Common Industries - Professional, scientific, and management, and administrative and waste management services (%)
Most Common Industries - Professional, scientific, and technical services (%)
Most Common Industries - Management of companies and enterprises (%)
Most Common Industries - Administrative and support and waste management services (%)
Most Common Industries - Educational services, and health care and social assistance (%)
Most Common Industries - Educational services (%)
Most Common Industries - Health care and social assistance (%)
Most Common Industries - Arts, entertainment, and recreation, and accommodation and food services (%)
Most Common Industries - Arts, entertainment, and recreation (%)
Most Common Industries - Accommodation and food services (%)
Most Common Industries - Other services, except public administration (%)
Most Common Industries - Public administration (%)
Occupation diversity
Most Common Occupations - Management, business, science, and arts occupations (%)
Most Common Occupations - Management, business, and financial occupations (%)
Most Common Occupations - Management occupations (%)
Most Common Occupations - Business and financial operations occupations (%)
Most Common Occupations - Computer, engineering, and science occupations (%)
Most Common Occupations - Computer and mathematical occupations (%)
Most Common Occupations - Architecture and engineering occupations (%)
Most Common Occupations - Life, physical, and social science occupations (%)
Most Common Occupations - Education, legal, community service, arts, and media occupations (%)
Most Common Occupations - Community and social service occupations (%)
Most Common Occupations - Legal occupations (%)
Most Common Occupations - Education, training, and library occupations (%)
Most Common Occupations - Arts, design, entertainment, sports, and media occupations (%)
Most Common Occupations - Healthcare practitioners and technical occupations (%)
Most Common Occupations - Health diagnosing and treating practitioners and other technical occupations (%)
Most Common Occupations - Health technologists and technicians (%)
Most Common Occupations - Service occupations (%)
Most Common Occupations - Healthcare support occupations (%)
Most Common Occupations - Protective service occupations (%)
Most Common Occupations - Fire fighting and prevention, and other protective service workers including supervisors (%)
Most Common Occupations - Law enforcement workers including supervisors (%)
Most Common Occupations - Food preparation and serving related occupations (%)
Most Common Occupations - Building and grounds cleaning and maintenance occupations (%)
Most Common Occupations - Personal care and service occupations (%)
Most Common Occupations - Sales and office occupations (%)
Most Common Occupations - Sales and related occupations (%)
Most Common Occupations - Office and administrative support occupations (%)
Most Common Occupations - Natural resources, construction, and maintenance occupations (%)
Most Common Occupations - Farming, fishing, and forestry occupations (%)
Most Common Occupations - Construction and extraction occupations (%)
Most Common Occupations - Installation, maintenance, and repair occupations (%)
Most Common Occupations - Production, transportation, and material moving occupations (%)
Most Common Occupations - Production occupations (%)
Most Common Occupations - Transportation occupations (%)
Most Common Occupations - Material moving occupations (%)
People in Group quarters - Institutionalized population (%)
People in Group quarters - Correctional institutions (%)
People in Group quarters - Federal prisons and detention centers (%)
People in Group quarters - Halfway houses (%)
People in Group quarters - Local jails and other confinement facilities (including police lockups) (%)
People in Group quarters - Military disciplinary barracks (%)
People in Group quarters - State prisons (%)
People in Group quarters - Other types of correctional institutions (%)
People in Group quarters - Nursing homes (%)
People in Group quarters - Hospitals/wards, hospices, and schools for the handicapped (%)
People in Group quarters - Hospitals/wards and hospices for chronically ill (%)
People in Group quarters - Hospices or homes for chronically ill (%)
People in Group quarters - Military hospitals or wards for chronically ill (%)
People in Group quarters - Other hospitals or wards for chronically ill (%)
People in Group quarters - Hospitals or wards for drug/alcohol abuse (%)
People in Group quarters - Mental (Psychiatric) hospitals or wards (%)
People in Group quarters - Schools, hospitals, or wards for the mentally retarded (%)
People in Group quarters - Schools, hospitals, or wards for the physically handicapped (%)
People in Group quarters - Institutions for the deaf (%)
People in Group quarters - Institutions for the blind (%)
People in Group quarters - Orthopedic wards and institutions for the physically handicapped (%)
People in Group quarters - Wards in general hospitals for patients who have no usual home elsewhere (%)
People in Group quarters - Wards in military hospitals for patients who have no usual home elsewhere (%)
People in Group quarters - Juvenile institutions (%)
People in Group quarters - Long-term care (%)
People in Group quarters - Homes for abused, dependent, and neglected children (%)
People in Group quarters - Residential treatment centers for emotionally disturbed children (%)
People in Group quarters - Training schools for juvenile delinquents (%)
People in Group quarters - Short-term care, detention or diagnostic centers for delinquent children (%)
People in Group quarters - Type of juvenile institution unknown (%)
People in Group quarters - Noninstitutionalized population (%)
People in Group quarters - College dormitories (includes college quarters off campus) (%)
People in Group quarters - Military quarters (%)
People in Group quarters - On base (%)
People in Group quarters - Barracks, unaccompanied personnel housing (UPH), (Enlisted/Officer), ;and similar group living quarters for military personnel (%)
People in Group quarters - Transient quarters for temporary residents (%)
People in Group quarters - Military ships (%)
People in Group quarters - Group homes (%)
People in Group quarters - Homes or halfway houses for drug/alcohol abuse (%)
People in Group quarters - Homes for the mentally ill (%)
People in Group quarters - Homes for the mentally retarded (%)
People in Group quarters - Homes for the physically handicapped (%)
People in Group quarters - Other group homes (%)
People in Group quarters - Religious group quarters (%)
People in Group quarters - Dormitories (%)
People in Group quarters - Agriculture workers' dormitories on farms (%)
People in Group quarters - Job Corps and vocational training facilities (%)
People in Group quarters - Other workers' dormitories (%)
People in Group quarters - Crews of maritime vessels (%)
People in Group quarters - Other nonhousehold living situations (%)
People in Group quarters - Other noninstitutional group quarters (%)
Residents speaking English at home (%)
Residents speaking English at home - Born in the United States (%)
Residents speaking English at home - Native, born elsewhere (%)
Residents speaking English at home - Foreign born (%)
Residents speaking Spanish at home (%)
Residents speaking Spanish at home - Born in the United States (%)
Residents speaking Spanish at home - Native, born elsewhere (%)
Residents speaking Spanish at home - Foreign born (%)
Residents speaking other language at home (%)
Residents speaking other language at home - Born in the United States (%)
Residents speaking other language at home - Native, born elsewhere (%)
Residents speaking other language at home - Foreign born (%)
Class of Workers - Employee of private company (%)
Class of Workers - Self-employed in own incorporated business (%)
Class of Workers - Private not-for-profit wage and salary workers (%)
Class of Workers - Local government workers (%)
Class of Workers - State government workers (%)
Class of Workers - Federal government workers (%)
Class of Workers - Self-employed workers in own not incorporated business and Unpaid family workers (%)
House heating fuel used in houses and condos - Utility gas (%)
House heating fuel used in houses and condos - Bottled, tank, or LP gas (%)
House heating fuel used in houses and condos - Electricity (%)
House heating fuel used in houses and condos - Fuel oil, kerosene, etc. (%)
House heating fuel used in houses and condos - Coal or coke (%)
House heating fuel used in houses and condos - Wood (%)
House heating fuel used in houses and condos - Solar energy (%)
House heating fuel used in houses and condos - Other fuel (%)
House heating fuel used in houses and condos - No fuel used (%)
House heating fuel used in apartments - Utility gas (%)
House heating fuel used in apartments - Bottled, tank, or LP gas (%)
House heating fuel used in apartments - Electricity (%)
House heating fuel used in apartments - Fuel oil, kerosene, etc. (%)
House heating fuel used in apartments - Coal or coke (%)
House heating fuel used in apartments - Wood (%)
House heating fuel used in apartments - Solar energy (%)
House heating fuel used in apartments - Other fuel (%)
House heating fuel used in apartments - No fuel used (%)
Armed forces status - In Armed Forces (%)
Armed forces status - Civilian (%)
Armed forces status - Civilian - Veteran (%)
Armed forces status - Civilian - Nonveteran (%)
Fatal accidents locations in years 2005-2021
Fatal accidents locations in 2005
Fatal accidents locations in 2006
Fatal accidents locations in 2007
Fatal accidents locations in 2008
Fatal accidents locations in 2009
Fatal accidents locations in 2010
Fatal accidents locations in 2011
Fatal accidents locations in 2012
Fatal accidents locations in 2013
Fatal accidents locations in 2014
Fatal accidents locations in 2015
Fatal accidents locations in 2016
Fatal accidents locations in 2017
Fatal accidents locations in 2018
Fatal accidents locations in 2019
Fatal accidents locations in 2020
Fatal accidents locations in 2021
Alcohol use - People drinking some alcohol every month (%)
Alcohol use - People not drinking at all (%)
Alcohol use - Average days/month drinking alcohol
Alcohol use - Average drinks/week
Alcohol use - Average days/year people drink much
Audiometry - Average condition of hearing (%)
Audiometry - People that can hear a whisper from across a quiet room (%)
Audiometry - People that can hear normal voice from across a quiet room (%)
Audiometry - Ears ringing, roaring, buzzing (%)
Audiometry - Had a job exposure to loud noise (%)
Audiometry - Had off-work exposure to loud noise (%)
Blood Pressure & Cholesterol - Has high blood pressure (%)
Blood Pressure & Cholesterol - Checking blood pressure at home (%)
Blood Pressure & Cholesterol - Frequently checking blood cholesterol (%)
Blood Pressure & Cholesterol - Has high cholesterol level (%)
Consumer Behavior - Money monthly spent on food at supermarket/grocery store
Consumer Behavior - Money monthly spent on food at other stores
Consumer Behavior - Money monthly spent on eating out
Consumer Behavior - Money monthly spent on carryout/delivered foods
Consumer Behavior - Income spent on food at supermarket/grocery store (%)
Consumer Behavior - Income spent on food at other stores (%)
Consumer Behavior - Income spent on eating out (%)
Consumer Behavior - Income spent on carryout/delivered foods (%)
Current Health Status - General health condition (%)
Current Health Status - Blood donors (%)
Current Health Status - Has blood ever tested for HIV virus (%)
Current Health Status - Left-handed people (%)
Dermatology - People using sunscreen (%)
Diabetes - Diabetics (%)
Diabetes - Had a blood test for high blood sugar (%)
Diabetes - People taking insulin (%)
Diet Behavior & Nutrition - Diet health (%)
Diet Behavior & Nutrition - Milk product consumption (# of products/month)
Diet Behavior & Nutrition - Meals not home prepared (#/week)
Diet Behavior & Nutrition - Meals from fast food or pizza place (#/week)
Diet Behavior & Nutrition - Ready-to-eat foods (#/month)
Diet Behavior & Nutrition - Frozen meals/pizza (#/month)
Drug Use - People that ever used marijuana or hashish (%)
Drug Use - Ever used hard drugs (%)
Drug Use - Ever used any form of cocaine (%)
Drug Use - Ever used heroin (%)
Drug Use - Ever used methamphetamine (%)
Health Insurance - People covered by health insurance (%)
Kidney Conditions-Urology - Avg. # of times urinating at night
Medical Conditions - People with asthma (%)
Medical Conditions - People with anemia (%)
Medical Conditions - People with psoriasis (%)
Medical Conditions - People with overweight (%)
Medical Conditions - Elderly people having difficulties in thinking or remembering (%)
Medical Conditions - People who ever received blood transfusion (%)
Medical Conditions - People having trouble seeing even with glass/contacts (%)
Medical Conditions - People with arthritis (%)
Medical Conditions - People with gout (%)
Medical Conditions - People with congestive heart failure (%)
Medical Conditions - People with coronary heart disease (%)
Medical Conditions - People with angina pectoris (%)
Medical Conditions - People who ever had heart attack (%)
Medical Conditions - People who ever had stroke (%)
Medical Conditions - People with emphysema (%)
Medical Conditions - People with thyroid problem (%)
Medical Conditions - People with chronic bronchitis (%)
Medical Conditions - People with any liver condition (%)
Medical Conditions - People who ever had cancer or malignancy (%)
Mental Health - People who have little interest in doing things (%)
Mental Health - People feeling down, depressed, or hopeless (%)
Mental Health - People who have trouble sleeping or sleeping too much (%)
Mental Health - People feeling tired or having little energy (%)
Mental Health - People with poor appetite or overeating (%)
Mental Health - People feeling bad about themself (%)
Mental Health - People who have trouble concentrating on things (%)
Mental Health - People moving or speaking slowly or too fast (%)
Mental Health - People having thoughts they would be better off dead (%)
Oral Health - Average years since last visit a dentist
Oral Health - People embarrassed because of mouth (%)
Oral Health - People with gum disease (%)
Oral Health - General health of teeth and gums (%)
Oral Health - Average days a week using dental floss/device
Oral Health - Average days a week using mouthwash for dental problem
Oral Health - Average number of teeth
Pesticide Use - Households using pesticides to control insects (%)
Pesticide Use - Households using pesticides to kill weeds (%)
Physical Activity - People doing vigorous-intensity work activities (%)
Physical Activity - People doing moderate-intensity work activities (%)
Physical Activity - People walking or bicycling (%)
Physical Activity - People doing vigorous-intensity recreational activities (%)
Physical Activity - People doing moderate-intensity recreational activities (%)
Physical Activity - Average hours a day doing sedentary activities
Physical Activity - Average hours a day watching TV or videos
Physical Activity - Average hours a day using computer
Physical Functioning - People having limitations keeping them from working (%)
Physical Functioning - People limited in amount of work they can do (%)
Physical Functioning - People that need special equipment to walk (%)
Physical Functioning - People experiencing confusion/memory problems (%)
Physical Functioning - People requiring special healthcare equipment (%)
Prescription Medications - Average number of prescription medicines taking
Preventive Aspirin Use - Adults 40+ taking low-dose aspirin (%)
Reproductive Health - Vaginal deliveries (%)
Reproductive Health - Cesarean deliveries (%)
Reproductive Health - Deliveries resulted in a live birth (%)
Reproductive Health - Pregnancies resulted in a delivery (%)
Reproductive Health - Women breastfeeding newborns (%)
Reproductive Health - Women that had a hysterectomy (%)
Reproductive Health - Women that had both ovaries removed (%)
Reproductive Health - Women that have ever taken birth control pills (%)
Reproductive Health - Women taking birth control pills (%)
Reproductive Health - Women that have ever used Depo-Provera or injectables (%)
Reproductive Health - Women that have ever used female hormones (%)
Sexual Behavior - People 18+ that ever had sex (vaginal, anal, or oral) (%)
Sexual Behavior - Males 18+ that ever had vaginal sex with a woman (%)
Sexual Behavior - Males 18+ that ever performed oral sex on a woman (%)
Sexual Behavior - Males 18+ that ever had anal sex with a woman (%)
Sexual Behavior - Males 18+ that ever had any sex with a man (%)
Sexual Behavior - Females 18+ that ever had vaginal sex with a man (%)
Sexual Behavior - Females 18+ that ever performed oral sex on a man (%)
Sexual Behavior - Females 18+ that ever had anal sex with a man (%)
Sexual Behavior - Females 18+ that ever had any kind of sex with a woman (%)
Sexual Behavior - Average age people first had sex
Sexual Behavior - Average number of female sex partners in lifetime (males 18+)
Sexual Behavior - Average number of female vaginal sex partners in lifetime (males 18+)
Sexual Behavior - Average age people first performed oral sex on a woman (18+)
Sexual Behavior - Average number of woman performed oral sex on in lifetime (18+)
Sexual Behavior - Average number of male sex partners in lifetime (males 18+)
Sexual Behavior - Average number of male anal sex partners in lifetime (males 18+)
Sexual Behavior - Average age people first performed oral sex on a man (18+)
Sexual Behavior - Average number of male oral sex partners in lifetime (18+)
Sexual Behavior - People using protection when performing oral sex (%)
Sexual Behavior - Average number of times people have vaginal or anal sex a year
Sexual Behavior - People having sex without condom (%)
Sexual Behavior - Average number of male sex partners in lifetime (females 18+)
Sexual Behavior - Average number of male vaginal sex partners in lifetime (females 18+)
Sexual Behavior - Average number of female sex partners in lifetime (females 18+)
Sexual Behavior - Circumcised males 18+ (%)
Sleep Disorders - Average hours sleeping at night
Sleep Disorders - People that has trouble sleeping (%)
Smoking-Cigarette Use - People smoking cigarettes (%)
Taste & Smell - People 40+ having problems with smell (%)
Taste & Smell - People 40+ having problems with taste (%)
Taste & Smell - People 40+ that ever had wisdom teeth removed (%)
Taste & Smell - People 40+ that ever had tonsils teeth removed (%)
Taste & Smell - People 40+ that ever had a loss of consciousness because of a head injury (%)
Taste & Smell - People 40+ that ever had a broken nose or other serious injury to face or skull (%)
Taste & Smell - People 40+ that ever had two or more sinus infections (%)
Weight - Average height (inches)
Weight - Average weight (pounds)
Weight - Average BMI
Weight - People that are obese (%)
Weight - People that ever were obese (%)
Weight - People trying to lose weight (%)
Urban population: 7,071
Rural population: 4,389
Estimated median house/condo value in 2022: $151,123
79108:
$151,123Texas:
$275,400
Median resident age: This zip code:
40.9 yearsTexas median age:
35.6 years
Average household size: This zip code:
2.4 peopleTexas:
2.6 people
Averages for the 2020 tax year for zip code 79108, filed in 2021:
Average Adjusted Gross Income (AGI) in 2020: $50,013 (Individual Income Tax Returns) Here:
$50,013State:
$77,054
Salary/wage: $46,656 (reported on 83.5% of returns )Here:
$46,656State:
$62,766
(% of AGI for various income ranges: 1163.9% for AGIs below $25k , 3545.9% for AGIs $25k-50k , 6266.6% for AGIs $50k-75k , 9237.2% for AGIs $75k-100k , 15423.5% for AGIs $100k-200k , 51815.0% for AGIs over 200k ) Taxable interest for individuals: $1,084 (reported on 20.4% of returns )This zip code:
$1,084Texas:
$2,665
(% of AGI for various income ranges: 10.1% for AGIs below $25k , 14.0% for AGIs $25k-50k , 45.4% for AGIs $50k-75k , 29.0% for AGIs $75k-100k , 57.0% for AGIs $100k-200k , 1185.0% for AGIs over 200k ) Ordinary dividends: $2,442 (reported on 7.5% of returns )(% of AGI for various income ranges: 7.7% for AGIs below $25k , 12.8% for AGIs $25k-50k , 27.4% for AGIs $50k-75k , 49.2% for AGIs $75k-100k , 85.2% for AGIs $100k-200k ) Net capital gain/loss in AGI: +$6,595 (reported on 7.1% of returns )Here:
+$6,595State:
+$39,590
(% of AGI for various income ranges: 6.1% for AGIs below $25k , 12.4% for AGIs $25k-50k , 22.6% for AGIs $50k-75k , 107.4% for AGIs $75k-100k , 246.7% for AGIs $100k-200k , 3570.0% for AGIs over 200k ) Profit/loss from business: +$6,771 (reported on 16.9% of returns )Here:
+$6,771State:
+$10,888
(% of AGI for various income ranges: 120.7% for AGIs below $25k , 145.1% for AGIs $25k-50k , 103.0% for AGIs $50k-75k , 81.8% for AGIs $75k-100k , 375.5% for AGIs $100k-200k ) Taxable individual retirement arrangement distribution: $15,889 (reported on 6.6% of returns )79108:
$15,889Texas:
$24,740
(% of AGI for various income ranges: 34.8% for AGIs below $25k , 75.1% for AGIs $25k-50k , 145.9% for AGIs $50k-75k , 211.5% for AGIs $75k-100k , 595.5% for AGIs $100k-200k ) Total itemized deductions: $34,175 (reported on 2.2% of returns )Here:
$34,175State:
$40,428
(% of AGI for various income ranges: 69.6% for AGIs $25k-50k , 208.5% for AGIs $50k-75k , 279.5% for AGIs $100k-200k , 4240.0% for AGIs over 200k ) Charity contributions: $12,920 (reported on 1.9% of returns )Here:
$12,920State:
$18,201
(% of AGI for various income ranges: 10.3% for AGIs below $25k , 45.7% for AGIs $50k-75k , 72.2% for AGIs $100k-200k , 2830.0% for AGIs over 200k ) Taxes paid: $5,067 (reported on 2.2% of returns )(% of AGI for various income ranges: 7.3% for AGIs $25k-50k , 29.5% for AGIs $50k-75k , 45.8% for AGIs $100k-200k , 775.0% for AGIs over 200k ) Earned income credit: $2,523 (reported on 23.0% of returns )(% of AGI for various income ranges: 124.0% for AGIs below $25k , 96.2% for AGIs $25k-50k , 2.1% for AGIs $50k-75k ) Percentage of individuals using paid preparers for their 2020 taxes: 94.0%(% for various income ranges: 92.7% for AGIs below $25k , 94.7% for AGIs $25k-50k , 93.5% for AGIs $50k-75k , 96.1% for AGIs $75k-100k , 94.9% for AGIs $100k-200k , 100.0% for AGIs over 200k )
Averages for the 2012 tax year for zip code 79108, filed in 2013:
Average Adjusted Gross Income (AGI) in 2012: $42,989 (Individual Income Tax Returns) Here:
$42,989State:
$65,384
Salary/wage: $39,711 (reported on 86.7% of returns )Here:
$39,711State:
$52,524
(% of AGI for various income ranges: 80.0% for AGIs below $25k , 83.4% for AGIs $25k-50k , 83.2% for AGIs $50k-75k , 84.6% for AGIs $75k-100k , 77.7% for AGIs $100k-200k , 51.8% for AGIs over 200k ) Taxable interest for individuals: $970 (reported on 21.7% of returns )This zip code:
$970Texas:
$2,372
(% of AGI for various income ranges: 0.8% for AGIs below $25k , 0.3% for AGIs $25k-50k , 0.6% for AGIs $50k-75k , 0.4% for AGIs $75k-100k , 0.4% for AGIs $100k-200k , 0.9% for AGIs over 200k ) Ordinary dividends: $2,978 (reported on 7.6% of returns )(% of AGI for various income ranges: 1.0% for AGIs below $25k , 0.2% for AGIs $25k-50k , 0.4% for AGIs $50k-75k , 0.5% for AGIs $75k-100k , 0.9% for AGIs $100k-200k ) Net capital gain/loss in AGI: +$4,972 (reported on 6.1% of returns )Here:
+$4,972State:
+$35,319
(% of AGI for various income ranges: 0.1% for AGIs $25k-50k , 0.3% for AGIs $75k-100k , 3.0% for AGIs $100k-200k ) Profit/loss from business: +$9,152 (reported on 15.4% of returns )Here:
+$9,152State:
+$13,732
(% of AGI for various income ranges: 8.3% for AGIs below $25k , 3.4% for AGIs $25k-50k , 1.5% for AGIs $50k-75k , 1.7% for AGIs $75k-100k , 4.0% for AGIs $100k-200k ) Taxable individual retirement arrangement distribution: $9,815 (reported on 7.4% of returns )79108:
$9,815Texas:
$19,511
(% of AGI for various income ranges: 2.4% for AGIs below $25k , 1.4% for AGIs $25k-50k , 1.4% for AGIs $50k-75k , 1.3% for AGIs $75k-100k , 2.7% for AGIs $100k-200k ) Total itemized deductions: $18,299 (24% of AGI, reported on 14.9% of returns )Here:
$18,299State:
$24,724
Here:
23.8% of AGIState:
15.9% of AGI
(% of AGI for various income ranges: 4.2% for AGIs below $25k , 6.0% for AGIs $25k-50k , 6.2% for AGIs $50k-75k , 7.3% for AGIs $75k-100k , 7.9% for AGIs $100k-200k , 4.5% for AGIs over 200k ) Charity contributions: $5,450 (reported on 9.9% of returns )(% of AGI for various income ranges: 0.5% for AGIs below $25k , 0.8% for AGIs $25k-50k , 1.0% for AGIs $50k-75k , 1.6% for AGIs $75k-100k , 2.5% for AGIs $100k-200k ) Taxes paid: $4,173 (reported on 14.1% of returns )(% of AGI for various income ranges: 0.7% for AGIs below $25k , 1.3% for AGIs $25k-50k , 1.3% for AGIs $50k-75k , 1.5% for AGIs $75k-100k , 1.8% for AGIs $100k-200k , 1.4% for AGIs over 200k ) Earned income credit: $2,493 (reported on 25.0% of returns )(% of AGI for various income ranges: 8.2% for AGIs below $25k , 1.7% for AGIs $25k-50k ) Percentage of individuals using paid preparers for their 2012 taxes: 49.3%(% for various income ranges: 45.7% for AGIs below $25k , 48.2% for AGIs $25k-50k , 56.2% for AGIs $50k-75k , 50.0% for AGIs $75k-100k , 57.9% for AGIs $100k-200k , 75.0% for AGIs over 200k )
Averages for the 2004 tax year for zip code 79108, filed in 2005:
Average Adjusted Gross Income (AGI) in 2004: $33,076 (Individual Income Tax Returns) Here:
$33,076State:
$47,881
Salary/wage: $32,317 (reported on 87.3% of returns )Here:
$32,317State:
$41,947
(% of AGI for various income ranges: 135.1% for AGIs below $10k , 81.9% for AGIs $10k-25k , 87.5% for AGIs $25k-50k , 87.7% for AGIs $50k-75k , 86.5% for AGIs $75k-100k , 69.6% for AGIs over 100k ) Taxable interest for individuals: $1,121 (reported on 28.3% of returns )This zip code:
$1,121Texas:
$2,255
(% of AGI for various income ranges: 4.9% for AGIs below $10k , 1.0% for AGIs $10k-25k , 0.5% for AGIs $25k-50k , 0.8% for AGIs $50k-75k , 0.8% for AGIs $75k-100k , 1.9% for AGIs over 100k ) Taxable dividends: $1,464 (reported on 10.0% of returns )(% of AGI for various income ranges: 1.3% for AGIs below $10k , 0.4% for AGIs $10k-25k , 0.4% for AGIs $25k-50k , 0.3% for AGIs $50k-75k , 0.3% for AGIs $75k-100k , 0.9% for AGIs over 100k ) Net capital gain/loss: +$2,885 (reported on 8.4% of returns )Here:
+$2,885State:
+$16,110
(% of AGI for various income ranges: -2.1% for AGIs below $10k , -0.1% for AGIs $10k-25k , 0.3% for AGIs $25k-50k , 0.7% for AGIs $50k-75k , 0.8% for AGIs $75k-100k , 3.1% for AGIs over 100k ) Profit/loss from business: +$5,012 (reported on 16.4% of returns )Here:
+$5,012State:
+$11,013
(% of AGI for various income ranges: 13.8% for AGIs below $10k , 3.2% for AGIs $10k-25k , 1.8% for AGIs $25k-50k , 1.8% for AGIs $50k-75k , 1.6% for AGIs $75k-100k , 4.0% for AGIs over 100k ) IRA payment deduction: $2,944 (reported on 1.5% of returns )(% of AGI for various income ranges: 0.1% for AGIs $10k-25k , 0.1% for AGIs $25k-50k , 0.1% for AGIs $50k-75k , 0.2% for AGIs $75k-100k ) Total itemized deductions: $14,494 (23% of AGI, reported on 15.0% of returns )Here:
$14,494State:
$19,631
Here:
22.7% of AGIState:
18.9% of AGI
(% of AGI for various income ranges: 3.7% for AGIs below $10k , 3.2% for AGIs $10k-25k , 6.0% for AGIs $25k-50k , 7.8% for AGIs $50k-75k , 7.9% for AGIs $75k-100k , 8.0% for AGIs over 100k ) Charity contributions deductions: $3,818 (6% of AGI, reported on 11.9% of returns )Here:
5.6% of AGIState:
4.2% of AGI
(% of AGI for various income ranges: 0.7% for AGIs $10k-25k , 1.0% for AGIs $25k-50k , 1.5% for AGIs $50k-75k , 1.8% for AGIs $75k-100k , 2.5% for AGIs over 100k ) Total tax: $3,967 (reported on 70.1% of returns )(% of AGI for various income ranges: 4.1% for AGIs below $10k , 3.5% for AGIs $10k-25k , 6.1% for AGIs $25k-50k , 8.5% for AGIs $50k-75k , 11.3% for AGIs $75k-100k , 16.4% for AGIs over 100k ) Earned income credit: $1,911 (reported on 23.6% of returns )Percentage of individuals using paid preparers for their 2004 taxes: 50.5%(% for various income ranges: 46.0% for AGIs below $10k , 51.3% for AGIs $10k-25k , 49.4% for AGIs $25k-50k , 53.5% for AGIs $50k-75k , 55.8% for AGIs $75k-100k , 61.5% for AGIs over 100k )
Estimated median household income in 2022: This zip code:
$59,497Texas:
$72,284
Nearest zip codes: 79111 ,
79107 ,
79104 ,
79103 ,
79101 ,
79118 .
Amarillo Zip Code Map
Percentage of family households: This zip code:
50.7%Texas:
50.5%
Percentage of households with unmarried partners: This zip code:
4.3%Texas:
48.7%
No gay or lesbian households reported
Household received Food Stamps/SNAP in the past 12 months: 731Household did not receive Food Stamps/SNAP in the past 12 months: 4,024
Women who had a birth in the past 12 months: 82 (70 now married , 12 unmarried) Women who did not have a birth in the past 12 months: 2,483 (1,057 now married , 1,426 unmarried)
Housing units in zip code 79108 with a mortgage: 1,809 (18
second mortgage , 20
both second mortgage and home equity loan )
Houses without a mortgage: 25
Median monthly owner costs for units with a mortgage: $1,390
Median monthly owner costs for units without a mortgage: $499
Residents with income below the poverty level in 2022:
This zip code:
17.9%Whole state:
14.0%
Residents with income below 50% of the poverty level in 2022:
This zip code:
8.0%Whole state:
7.4%
Median number of rooms in houses and condos: Median number of rooms in apartments: Notable locations in this zip code not listed on our city pages
Click to draw/clear zip code borders Notable locations in zip code 79108: (A) , Kritser Ranch (B) , Wilkins Ranch (C) , Amarillo Rifle and Pistol Club Firing Range (D) , Amarillo Speed Bowl (E) , Canadian River Store (F) , Amarillo Fire Department Station 4 (G) , Potter County Fire Rescue Station 5 Central Headquarters (H) , Potter County Fire Rescue Station 6 (I) , Potter County Fire Rescue Station 4 (J) . Display/hide their locations on the map
Churches in zip code 79108 include: (A) , Holiness Church (B) , Primitive Baptist Church (C) , Pavillard Baptist Church (D) , Irwin Road Baptist Church (E) , Pleasant Valley Assembly of God Church (F) , Northside Assembly of God Church (G) , Pleasant Valley Church of Christ (H) , Fairlane Church of Christ (I) . Display/hide their locations on the map
Cemetery: (1) . Display/hide its location on the map
Lakes and reservoirs: (A) , Stalanaker Lake (B) , Southwestern Public Service Lake (C) . Display/hide their locations on the map
Creeks: (A) , Pitcher Creek (B) , East Amarillo Creek (C) . Display/hide their locations on the map
Year house built (houses)
68 2020 or later428 2010 to 2019478 2000 to 2009773 1990 to 1999594 1980 to 1989766 1970 to 1979577 1960 to 1969716 1950 to 1959419 1940 to 1949310 1939 or earlier
Zip code 79108 household income distribution in 2022 206 Less than $10,000253 $10,000 to $14,999237 $15,000 to $19,999173 $20,000 to $24,999413 $25,000 to $29,999285 $30,000 to $34,999192 $35,000 to $39,99971 $40,000 to $44,999164 $45,000 to $49,999349 $50,000 to $59,999701 $60,000 to $74,999591 $75,000 to $99,999386 $100,000 to $124,999260 $125,000 to $149,999317 $150,000 to $199,999134 $200,000 or moreEstimate of home value of owner-occupied houses/condos in 2022 in zip code 79108 156 Less than $10,00027 $10,000 to $14,99982 $15,000 to $19,9993 $20,000 to $24,999106 $25,000 to $29,99915 $30,000 to $34,99928 $35,000 to $39,99991 $40,000 to $49,999118 $50,000 to $59,999140 $60,000 to $69,99978 $70,000 to $79,99984 $80,000 to $89,999126 $90,000 to $99,999394 $100,000 to $124,999307 $125,000 to $149,999283 $150,000 to $174,999265 $175,000 to $199,999406 $200,000 to $249,999187 $250,000 to $299,999111 $300,000 to $399,99942 $400,000 to $499,99937 $500,000 to $749,9995 $2,000,000 or moreRent paid by renters in 2022 in zip code 79108 63 Less than $10036 $200 to $24925 $250 to $29927 $350 to $39952 $400 to $4498 $500 to $54952 $550 to $59959 $600 to $649140 $650 to $69970 $700 to $7497 $750 to $79967 $800 to $899116 $900 to $99975 $1,000 to $1,2497 $1,250 to $1,4995 $1,500 to $1,999233 No cash rent
Median gross rent in 2022: $1,082.
Median price asked for vacant for-sale houses and condos in 2022: $195,153.
Estimated median house (or condo) value in 2022 for: White Non-Hispanic householders: $171,332Black or African American householders: $22,452American Indian or Alaska Native householders: $190,868Asian householders: $180,988Some other race householders: $137,874Two or more races householders: $178,068Hispanic or Latino householders: $146,631Estimated median house or condo value in 2022: $151,123
79108:
$151,123Texas:
$275,400
Lower value quartile - upper value quartile: $92,272 - $219,195
Mean price in 2022: Detached houses: $283,683Here:
$283,683State:
$369,058
Townhouses or other attached units: $233,417Here:
$233,417State:
$327,631
In 2-unit structures: $561,325Here:
$561,325State:
$374,947
In 5-or-more-unit structures: $651,893Here:
$651,893State:
$413,944
Mobile homes: $102,166Here:
$102,166State:
$124,413
Housing units in structures:
One, detached: 3,378One, attached: 47Two: 993 or 4: 9120 to 49: 30Mobile homes: 1,696Unemployment : 1.9%
Means of transportation to work in zip code 79108 78.1% 4,216 Drove a car alone6.5% 353 Carpooled0.9% 47 Walked13.7% 737 Worked at homeTravel time to work (commute) in zip code 79108 233 Less than 5 minutes183 5 to 9 minutes650 10 to 14 minutes1,083 15 to 19 minutes1,395 20 to 24 minutes274 25 to 29 minutes430 30 to 34 minutes39 35 to 39 minutes139 45 to 59 minutes158 60 to 89 minutes57 90 or more minutes
Percentage of zip code residents living and working in this county: 81.9%
Household type by relationship:
Households: 11,461
Male householders: 2,691 (635 living alone ), Female householders: 2,053 (475 living alone )2,064 spouses (2,057 opposite-sex spouses ), 503 unmarried partners , (503 opposite-sex unmarried partners ), 3,044 children (2,864 natural , 25 adopted , 154 stepchildren ), 550 grandchildren , 225 brothers or sisters , 117 parents , 0 foster children , 87 other relatives , 191 non-relatives In group quarters: 6 (-1 institutionalized population )
Size of family households: 1,641 2-persons , 714 3-persons , 666 4-persons , 183 5-persons , 47 6-persons , 38 7-or-more-persons
Size of nonfamily households: 1,110 1-person , 308 2-persons , 48 3-persons
1,427 married couples with children. single-parent households (134 men , 602 women ).
78.7% of residents of 79108 zip code speak English at home. of residents speak Spanish at home (67% very well, 17% well, 14% not well, 2% not at all ).of residents speak other Indo-European language at home (100% very well ).of residents speak Asian or Pacific Island language at home (100% very well ).of residents speak other language at home (50% very well, 19% well, 17% not well, 14% not at all ).
Foreign born population: 847 (7.4%)
(32.9%
of them are naturalized citizens )
This zip code:
7.4%Whole state:
17.2%
81% Honduras 3% Congo 3% El Salvador 2% Eritrea 2% Singapore 2% United Kingdom, excluding England and Scotland 2% Kenya 17% English 11% American 10% German 7% Irish 4% Scottish 4% European 1% African
Year of entry for the foreign-born population
396 2010 or later 259 2000 to 2009 92 1990 to 1999 220 Before 1990
There are
1 Medical Specialists in Zip Code 79108 .
Facilities with environmental interests located in this zip code:
ASARCO INCORPORATED AMARILLO COPPER REFINERY (7901 NORTH HIGHWAY 136 in AMARILLO, TX)
AIR MAJOR (AIRS/AFS) ENFORCEMENT/COMPLIANCE ACTIVITY (Integrated Compliance Information System) - ICIS-06-1999-0400, FORMAL ENFORCEMENT ACTION, ICIS-06-1997-0338, ICIS-06-1998-0955, (Integrated Compliance Information System) - ICIS-06-1999-0400, FORMAL ENFORCEMENT ACTION, ICIS-06-1997-0338, ICIS-06-1998-0955, COMPLIANCE ACTIVITY (Tracking inspections of insecticide, fungicide, and rodenticide, and toxic substances) CRITERIA AND HAZARDOUS AIR POLLUTANT INVENTORY (Inventory of air pollution sources) National Pollutant Discharge Elimination System NON-MAJOR (Tracking pollutant discharge elimination systems) - permit AIR MAJOR ("Best Available" air pollution technologies tracking) HAZARDOUS WASTE BIENNIAL REPORTER (Resource Conservation and Recovery Act (tracking hazardous waste)) Large Quantity Generators, more that 1000 kg of hazardous waste/month (Resource Conservation and Recovery Act (tracking hazardous waste)) - notification TRI REPORTER (Tracking of toxic chemicals releasing facilities) Business SIC classification: MEAT PACKING PLANTS; INDUSTRIAL INORGANIC CHEMICALS; PRIMARY SMELTING AND REFINING OF COPPER; SECONDARY SMELTING AND REFINING OF NONFERROUS METALS; ROLLING, DRAWING, AND EXTRUDING OF COPPERBusiness NAICS classification: ANIMAL (EXCEPT POULTRY) SLAUGHTERING.; PRIMARY SMELTING AND REFINING OF COPPER.Organizations: ASARCO LLC (CONTACT/OPERATOR)
, ASARCO LLC* (CONTACT/OWNER)
A-1 AUTO SALVAGE (4600 GLENN ST in AMARILLO, TX)
National Pollutant Discharge Elimination System NON-MAJOR (Tracking pollutant discharge elimination systems) - permit National Pollutant Discharge Elimination System NON-MAJOR (Tracking pollutant discharge elimination systems) - permit
AMARILLO CATTLE FEEDERS (1MI E INTX FM 1912 & STHWY 136 in AMARILLO, TX)
National Pollutant Discharge Elimination System NON-MAJOR (Tracking pollutant discharge elimination systems) - permit Business SIC classification: BEEF CATTLE FEEDLOTSOrganizations: STEVEN RAY DONNELL (CONTACT/OWNER)
Alternative names: STEVEN RAY DONNELL
AMARILLO MERCURY (2515 NORTH EASTERN ST, LAT 35.14'24" in AMARILLO, TX)
SUPERFUND (Superfund database)
Housing units lacking complete plumbing facilities: 7.3%
Housing units lacking complete kitchen facilities: 7.1%
49.3% Utility gas 45.4% Electricity 4.5% Bottled, tank, or LP gas 0.5% Fuel oil, kerosene, etc.
Population in 1990: 8,461. Population change in the 1990s: +3,415 (+40.4%).
Place of birth for U.S.-born residents:
This state: 7,609Northeast: 276Midwest: 731South: 743West: 1,143
49% of the 79108 zip code residents lived in the same house 5 years ago.
Out of people who lived in different houses, 39% lived in this county.
Out of people who lived in different counties, 50% lived in Texas.
93% of the 79108 zip code residents lived in the same house 1 year ago.
Out of people who lived in different houses, 34% moved from this county.
Out of people who lived in different houses, 47% moved from different county within same state.
Out of people who lived in different houses, 19% moved from different state.
Out of people who lived in different houses, 3% moved from abroad.
Private vs. public school enrollment:
Students in private schools in grades 1 to 8 (elementary and middle school): 55
Students in private schools in grades 9 to 12 (high school): 49
Students in private undergraduate colleges: 42
Occupation by median earnings in the past 12 months ($)
111,440 Computer and mathematical occupations 102,904 Life, physical, and social science occupations 101,172 Architecture and engineering occupations 75,120 Arts, design, entertainment, sports, and media occupations 72,359 Law enforcement workers including supervisors 67,935 Business and financial operations occupations
Companies with federal contracts located in this zip code:
HOWELL SAND COMPANY, INC. (2300 E HASTINGS AVE in AMARILLO, TX; small business)
$78,625 with Navy for Maintenance, Repair or Alteration of Real Property -- Unimproved Real Property (Land). Signed on 2000-09-28. Completion date: 2000-11-21.
Top industries in this zip code by the number of employees in 2005:
Construction: Highway, Street, and Bridge Construction (100-249 employees: 1 establishment, 50-99 employees: 1 establishment, 10-19 employees: 1 establishment, 5-9 employees: 1 establishment, 1-4 employees: 1 establishment)Other Services (except Public Administration): Religious Organizations (20-49: 1, 10-19: 1, 5-9: 3, 1-4: 3)Information: Television Broadcasting (50-99: 1)Wholesale Trade: Brick, Stone, and Related Construction Material Merchant Wholesalers (50-99: 1)Construction: Site Preparation Contractors (20-49: 2)Construction: Masonry Contractors (20-49: 1, 5-9: 1, 1-4: 1)Construction: Electrical Contractors (20-49: 1, 1-4: 3)
People in group quarters in 2010:
5,298 people in state prisons
People in group quarters in 2000:
525 people in local jails and other confinement facilities (including police lockups)
Fatal accident statistics in 2014:
Fatal accident count: 2Vehicles involved in fatal accidents: 2Fatal accidents caused by drunken drivers: 2Fatalities: 2Persons involved in fatal accidents: 2Pedestrians involved in fatal accidents: 0
Fatal accident statistics in 2013:
Fatal accident count: 3Vehicles involved in fatal accidents: 4Fatal accidents caused by drunken drivers: 0Fatalities: 3Persons involved in fatal accidents: 6Pedestrians involved in fatal accidents: 0
Home Mortgage Disclosure Act Aggregated Statistics For Year 2009(Based on 2 full and 12 partial tracts) A) FHA, FSA/RHS & VA B) Conventional C) Refinancings D) Home Improvement Loans F) Non-occupant Loans on G) Loans On Manufactured Number Average Value Number Average Value Number Average Value Number Average Value Number Average Value Number Average Value
LOANS ORIGINATED 92 $112,801 60 $119,726 258 $106,899 33 $21,106 31 $44,998 24 $76,178 APPLICATIONS APPROVED, NOT ACCEPTED 16 $86,341 20 $135,884 65 $107,336 9 $15,893 1 $29,310 13 $67,322 APPLICATIONS DENIED 28 $85,868 36 $94,950 101 $88,731 31 $27,321 12 $58,064 30 $56,241 APPLICATIONS WITHDRAWN 11 $106,782 4 $48,980 30 $131,492 10 $38,929 1 $74,190 7 $69,576 FILES CLOSED FOR INCOMPLETENESS 1 $92,040 6 $144,228 18 $68,150 1 $57,850 4 $61,185 5 $69,286
Aggregated Statistics For Year 2008(Based on 2 full and 12 partial tracts) A) FHA, FSA/RHS & VA B) Conventional C) Refinancings D) Home Improvement Loans F) Non-occupant Loans on G) Loans On Manufactured Number Average Value Number Average Value Number Average Value Number Average Value Number Average Value Number Average Value
LOANS ORIGINATED 80 $111,363 101 $107,932 156 $79,462 66 $27,204 37 $63,008 35 $78,039 APPLICATIONS APPROVED, NOT ACCEPTED 17 $94,740 18 $121,608 39 $100,034 6 $60,363 2 $132,665 13 $65,322 APPLICATIONS DENIED 21 $99,286 52 $90,957 96 $89,432 77 $28,409 11 $79,187 47 $55,403 APPLICATIONS WITHDRAWN 7 $73,107 7 $149,119 32 $71,496 0 $0 0 $0 0 $0 FILES CLOSED FOR INCOMPLETENESS 2 $87,290 0 $0 6 $102,900 6 $15,788 1 $38,570 6 $21,817
Aggregated Statistics For Year 2007(Based on 2 full and 12 partial tracts) A) FHA, FSA/RHS & VA B) Conventional C) Refinancings D) Home Improvement Loans F) Non-occupant Loans on G) Loans On Manufactured Number Average Value Number Average Value Number Average Value Number Average Value Number Average Value Number Average Value
LOANS ORIGINATED 57 $94,091 217 $95,493 163 $86,886 80 $24,107 42 $68,838 50 $62,373 APPLICATIONS APPROVED, NOT ACCEPTED 2 $157,985 53 $92,290 39 $76,876 16 $20,564 3 $59,300 17 $56,316 APPLICATIONS DENIED 16 $89,917 55 $70,911 206 $87,705 96 $24,967 14 $62,879 42 $62,790 APPLICATIONS WITHDRAWN 4 $87,698 14 $76,589 69 $89,646 10 $49,685 0 $0 20 $69,529 FILES CLOSED FOR INCOMPLETENESS 33 $73,794 7 $94,519 15 $105,785 3 $89,880 5 $55,906 0 $0
Aggregated Statistics For Year 2006(Based on 2 full and 12 partial tracts) A) FHA, FSA/RHS & VA B) Conventional C) Refinancings D) Home Improvement Loans F) Non-occupant Loans on G) Loans On Manufactured Number Average Value Number Average Value Number Average Value Number Average Value Number Average Value Number Average Value
LOANS ORIGINATED 97 $92,072 263 $86,909 179 $79,294 93 $26,649 40 $58,708 67 $71,224 APPLICATIONS APPROVED, NOT ACCEPTED 3 $107,020 78 $70,094 36 $72,699 6 $22,972 9 $31,378 42 $55,350 APPLICATIONS DENIED 9 $51,727 97 $63,926 195 $81,488 66 $34,614 9 $54,356 77 $56,963 APPLICATIONS WITHDRAWN 5 $76,822 24 $70,755 86 $90,854 25 $36,982 7 $52,696 5 $47,494 FILES CLOSED FOR INCOMPLETENESS 3 $119,227 11 $141,016 41 $107,140 2 $40,000 2 $137,000 0 $0
Aggregated Statistics For Year 2005(Based on 2 full and 12 partial tracts) A) FHA, FSA/RHS & VA B) Conventional C) Refinancings D) Home Improvement Loans F) Non-occupant Loans on G) Loans On Manufactured Number Average Value Number Average Value Number Average Value Number Average Value Number Average Value Number Average Value
LOANS ORIGINATED 92 $88,143 299 $75,015 222 $79,588 61 $64,473 46 $53,210 71 $65,940 APPLICATIONS APPROVED, NOT ACCEPTED 8 $73,504 46 $58,812 37 $81,927 19 $30,598 3 $55,193 33 $41,846 APPLICATIONS DENIED 13 $58,900 135 $60,383 210 $74,650 81 $21,096 34 $38,274 107 $43,383 APPLICATIONS WITHDRAWN 8 $97,800 33 $89,474 118 $98,157 42 $158,045 8 $93,705 9 $73,117 FILES CLOSED FOR INCOMPLETENESS 0 $0 8 $70,351 32 $90,334 0 $0 2 $64,205 2 $51,575
Aggregated Statistics For Year 2004(Based on 2 full and 12 partial tracts) A) FHA, FSA/RHS & VA B) Conventional C) Refinancings D) Home Improvement Loans F) Non-occupant Loans on G) Loans On Manufactured Number Average Value Number Average Value Number Average Value Number Average Value Number Average Value Number Average Value
LOANS ORIGINATED 87 $77,218 205 $79,563 297 $74,091 83 $19,792 37 $48,324 69 $63,423 APPLICATIONS APPROVED, NOT ACCEPTED 6 $84,568 49 $61,872 47 $80,149 11 $17,266 2 $54,650 41 $53,299 APPLICATIONS DENIED 15 $83,093 137 $52,352 266 $71,193 70 $24,777 29 $60,949 140 $46,407 APPLICATIONS WITHDRAWN 6 $98,090 20 $120,188 140 $73,484 14 $49,880 6 $54,050 7 $58,254 FILES CLOSED FOR INCOMPLETENESS 0 $0 4 $78,900 90 $80,459 0 $0 4 $49,395 2 $38,680
Aggregated Statistics For Year 2003(Based on 2 full and 12 partial tracts) A) FHA, FSA/RHS & VA B) Conventional C) Refinancings D) Home Improvement Loans F) Non-occupant Loans on Number Average Value Number Average Value Number Average Value Number Average Value Number Average Value
LOANS ORIGINATED 103 $84,856 175 $83,109 469 $76,674 78 $16,205 37 $55,336 APPLICATIONS APPROVED, NOT ACCEPTED 8 $64,285 27 $90,737 61 $67,188 15 $13,074 6 $38,125 APPLICATIONS DENIED 10 $70,351 79 $62,130 277 $66,042 57 $19,444 23 $43,916 APPLICATIONS WITHDRAWN 8 $81,388 20 $93,312 170 $78,126 5 $28,510 5 $51,846 FILES CLOSED FOR INCOMPLETENESS 1 $76,930 7 $93,387 26 $70,066 2 $22,960 0 $0
Aggregated Statistics For Year 2002(Based on 10 partial tracts) A) FHA, FSA/RHS & VA B) Conventional C) Refinancings D) Home Improvement Loans F) Non-occupant Loans on Number Average Value Number Average Value Number Average Value Number Average Value Number Average Value
LOANS ORIGINATED 53 $72,004 99 $83,884 186 $85,770 31 $9,873 23 $38,016 APPLICATIONS APPROVED, NOT ACCEPTED 4 $69,440 21 $69,538 31 $67,411 4 $20,060 6 $44,942 APPLICATIONS DENIED 9 $126,527 43 $72,519 63 $65,981 37 $11,549 3 $103,447 APPLICATIONS WITHDRAWN 1 $149,590 2 $88,135 43 $56,954 0 $0 3 $37,750 FILES CLOSED FOR INCOMPLETENESS 1 $24,680 8 $76,816 15 $78,053 0 $0 1 $225,260
Aggregated Statistics For Year 2001(Based on 10 partial tracts) A) FHA, FSA/RHS & VA B) Conventional C) Refinancings D) Home Improvement Loans F) Non-occupant Loans on Number Average Value Number Average Value Number Average Value Number Average Value Number Average Value
LOANS ORIGINATED 44 $62,384 115 $76,631 165 $78,739 45 $13,007 25 $60,658 APPLICATIONS APPROVED, NOT ACCEPTED 2 $9,455 48 $54,793 25 $61,121 4 $11,148 3 $38,423 APPLICATIONS DENIED 5 $38,120 131 $40,592 91 $52,959 43 $8,741 10 $27,220 APPLICATIONS WITHDRAWN 1 $22,370 17 $91,904 39 $59,817 0 $0 5 $43,828 FILES CLOSED FOR INCOMPLETENESS 2 $78,085 2 $207,620 14 $55,812 0 $0 2 $201,280
Aggregated Statistics For Year 2000(Based on 10 partial tracts) A) FHA, FSA/RHS & VA B) Conventional C) Refinancings D) Home Improvement Loans F) Non-occupant Loans on Number Average Value Number Average Value Number Average Value Number Average Value Number Average Value
LOANS ORIGINATED 43 $52,014 143 $66,702 70 $70,959 41 $6,854 24 $39,651 APPLICATIONS APPROVED, NOT ACCEPTED 3 $96,780 68 $55,160 9 $41,493 13 $16,418 5 $27,164 APPLICATIONS DENIED 11 $50,385 135 $45,649 59 $57,550 31 $10,259 9 $35,606 APPLICATIONS WITHDRAWN 8 $50,861 14 $87,249 24 $59,922 6 $10,967 2 $50,715 FILES CLOSED FOR INCOMPLETENESS 1 $79,840 8 $56,109 6 $75,088 0 $0 1 $39,430
Aggregated Statistics For Year 1999(Based on 3 full and 6 partial tracts) A) FHA, FSA/RHS & VA B) Conventional C) Refinancings D) Home Improvement Loans E) Loans on Dwellings For 5+ Families F) Non-occupant Loans on Number Average Value Number Average Value Number Average Value Number Average Value Number Average Value Number Average Value
LOANS ORIGINATED 50 $59,607 100 $55,457 96 $59,806 30 $11,059 0 $0 8 $29,918 APPLICATIONS APPROVED, NOT ACCEPTED 3 $55,583 49 $42,712 31 $55,163 8 $10,750 0 $0 4 $33,125 APPLICATIONS DENIED 15 $55,059 173 $45,313 53 $43,679 27 $12,647 1 $8,000 9 $33,738 APPLICATIONS WITHDRAWN 4 $64,672 11 $68,838 30 $52,517 3 $32,120 0 $0 1 $29,600 FILES CLOSED FOR INCOMPLETENESS 3 $60,100 4 $71,270 14 $72,509 0 $0 0 $0 2 $37,895
Private Mortgage Insurance Companies Aggregated Statistics For Year 2009(Based on 2 full and 10 partial tracts) A) Conventional B) Refinancings Number Average Value Number Average Value
LOANS ORIGINATED 8 $96,530 17 $111,425 APPLICATIONS APPROVED, NOT ACCEPTED 5 $146,400 11 $157,530 APPLICATIONS DENIED 0 $0 6 $112,712 APPLICATIONS WITHDRAWN 0 $0 4 $181,000 FILES CLOSED FOR INCOMPLETENESS 0 $0 0 $0
Aggregated Statistics For Year 2008(Based on 2 full and 12 partial tracts) A) Conventional B) Refinancings C) Non-occupant Loans on D) Loans On Manufactured Number Average Value Number Average Value Number Average Value Number Average Value
LOANS ORIGINATED 41 $105,845 7 $111,476 7 $90,687 2 $58,350 APPLICATIONS APPROVED, NOT ACCEPTED 21 $103,311 3 $102,120 0 $0 2 $85,130 APPLICATIONS DENIED 12 $61,352 0 $0 3 $87,793 6 $43,697 APPLICATIONS WITHDRAWN 6 $43,697 0 $0 0 $0 2 $52,005 FILES CLOSED FOR INCOMPLETENESS 0 $0 0 $0 0 $0 0 $0
Aggregated Statistics For Year 2007(Based on 2 full and 12 partial tracts) A) Conventional B) Refinancings C) Non-occupant Loans on D) Loans On Manufactured Number Average Value Number Average Value Number Average Value Number Average Value
LOANS ORIGINATED 107 $98,828 11 $124,213 3 $44,653 6 $95,137 APPLICATIONS APPROVED, NOT ACCEPTED 11 $102,185 0 $0 1 $41,660 0 $0 APPLICATIONS DENIED 0 $0 0 $0 0 $0 0 $0 APPLICATIONS WITHDRAWN 6 $110,187 0 $0 0 $0 0 $0 FILES CLOSED FOR INCOMPLETENESS 0 $0 0 $0 0 $0 0 $0
Aggregated Statistics For Year 2006(Based on 2 full and 12 partial tracts) A) Conventional B) Refinancings C) Non-occupant Loans on D) Loans On Manufactured Number Average Value Number Average Value Number Average Value Number Average Value
LOANS ORIGINATED 72 $93,971 3 $146,017 8 $55,694 5 $75,990 APPLICATIONS APPROVED, NOT ACCEPTED 3 $103,313 0 $0 0 $0 0 $0 APPLICATIONS DENIED 2 $61,090 0 $0 1 $72,810 0 $0 APPLICATIONS WITHDRAWN 2 $74,380 2 $48,995 0 $0 0 $0 FILES CLOSED FOR INCOMPLETENESS 0 $0 0 $0 0 $0 0 $0
Aggregated Statistics For Year 2005(Based on 2 full and 12 partial tracts) A) Conventional B) Refinancings C) Non-occupant Loans on D) Loans On Manufactured Number Average Value Number Average Value Number Average Value Number Average Value
LOANS ORIGINATED 86 $93,918 9 $156,299 14 $62,004 4 $69,582 APPLICATIONS APPROVED, NOT ACCEPTED 0 $0 6 $125,485 0 $0 6 $125,485 APPLICATIONS DENIED 1 $76,930 0 $0 1 $76,930 0 $0 APPLICATIONS WITHDRAWN 2 $63,000 0 $0 2 $63,000 0 $0 FILES CLOSED FOR INCOMPLETENESS 0 $0 0 $0 0 $0 0 $0
Aggregated Statistics For Year 2004(Based on 2 full and 12 partial tracts) A) Conventional B) Refinancings C) Non-occupant Loans on D) Loans On Manufactured Number Average Value Number Average Value Number Average Value Number Average Value
LOANS ORIGINATED 72 $80,387 20 $95,128 17 $72,808 5 $70,044 APPLICATIONS APPROVED, NOT ACCEPTED 3 $140,077 1 $331,480 0 $0 0 $0 APPLICATIONS DENIED 0 $0 2 $96,155 0 $0 0 $0 APPLICATIONS WITHDRAWN 3 $90,783 0 $0 0 $0 0 $0 FILES CLOSED FOR INCOMPLETENESS 0 $0 0 $0 0 $0 0 $0
Aggregated Statistics For Year 2003(Based on 2 full and 12 partial tracts) A) Conventional B) Refinancings C) Non-occupant Loans on Number Average Value Number Average Value Number Average Value
LOANS ORIGINATED 73 $81,995 45 $102,077 7 $57,237 APPLICATIONS APPROVED, NOT ACCEPTED 4 $84,520 8 $64,869 3 $23,567 APPLICATIONS DENIED 0 $0 1 $139,970 0 $0 APPLICATIONS WITHDRAWN 0 $0 2 $107,335 0 $0 FILES CLOSED FOR INCOMPLETENESS 0 $0 0 $0 0 $0
Aggregated Statistics For Year 2002(Based on 10 partial tracts) A) Conventional B) Refinancings C) Non-occupant Loans on Number Average Value Number Average Value Number Average Value
LOANS ORIGINATED 36 $88,492 15 $93,257 4 $35,532 APPLICATIONS APPROVED, NOT ACCEPTED 2 $105,955 1 $138,220 0 $0 APPLICATIONS DENIED 0 $0 0 $0 0 $0 APPLICATIONS WITHDRAWN 0 $0 2 $154,320 0 $0 FILES CLOSED FOR INCOMPLETENESS 0 $0 2 $139,530 1 $84,420
Aggregated Statistics For Year 2001(Based on 10 partial tracts) A) Conventional B) Refinancings C) Non-occupant Loans on Number Average Value Number Average Value Number Average Value
LOANS ORIGINATED 32 $86,964 8 $107,714 2 $63,560 APPLICATIONS APPROVED, NOT ACCEPTED 3 $57,137 3 $121,047 2 $51,340 APPLICATIONS DENIED 0 $0 1 $110,530 0 $0 APPLICATIONS WITHDRAWN 0 $0 0 $0 0 $0 FILES CLOSED FOR INCOMPLETENESS 1 $115,010 0 $0 0 $0
Aggregated Statistics For Year 2000(Based on 8 partial tracts) A) Conventional B) Refinancings C) Non-occupant Loans on Number Average Value Number Average Value Number Average Value
LOANS ORIGINATED 19 $82,777 5 $79,168 2 $24,930 APPLICATIONS APPROVED, NOT ACCEPTED 2 $81,565 1 $234,500 0 $0 APPLICATIONS DENIED 1 $30,860 0 $0 0 $0 APPLICATIONS WITHDRAWN 0 $0 0 $0 0 $0 FILES CLOSED FOR INCOMPLETENESS 0 $0 0 $0 0 $0
Aggregated Statistics For Year 1999(Based on 3 full and 4 partial tracts) A) Conventional B) Refinancings Number Average Value Number Average Value
LOANS ORIGINATED 22 $76,237 3 $104,877 APPLICATIONS APPROVED, NOT ACCEPTED 2 $63,710 2 $48,920 APPLICATIONS DENIED 1 $76,970 0 $0 APPLICATIONS WITHDRAWN 0 $0 0 $0 FILES CLOSED FOR INCOMPLETENESS 0 $0 1 $106,520
2002 - 2018 National Fire Incident Reporting System (NFIRS) incidents See full 2006 National Fire Incident Reporting System statistics for zip code 79108, Texas
Most common first names in zip code 79108 among deceased individuals Name Count Lived (average)
James 54 70.8 years John 49 73.5 years Mary 37 77.9 years William 30 72.7 years Robert 26 69.8 years Charles 22 66.7 years Helen 18 76.3 years Ruby 17 81.6 years Donald 14 65.4 years Margaret 14 72.7 years
Most common last names in zip code 79108 among deceased individuals Last name Count Lived (average)
Brown 20 73.3 years Smith 17 72.6 years Johnson 17 69.8 years Moore 15 76.8 years Miller 14 69.0 years Phillips 14 76.6 years Harris 13 74.3 years Wright 13 74.0 years White 13 71.6 years Davis 12 74.1 years
Businesses in zip code 79108

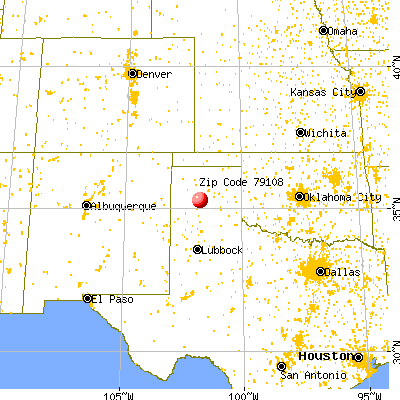


 Nearest zip codes: 79111, 79107, 79104, 79103, 79101, 79118.


 Based on the data from the years 2002 - 2018 the average number of fire incidents per year is 290. The highest number of reported fire incidents - 603 took place in 2006, and the least - 122 in 2012. The data has a decreasing trend.
 When looking into fire subcategories, the most reports belonged to: Outside Fires (65.2%), and Structure Fires (21.6%).