Estimated zip code population in 2022: 27,511 Zip code population in 2010: 26,122 Zip code population in 2000: 22,622
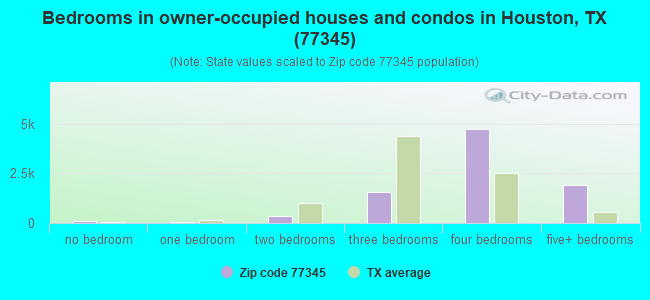
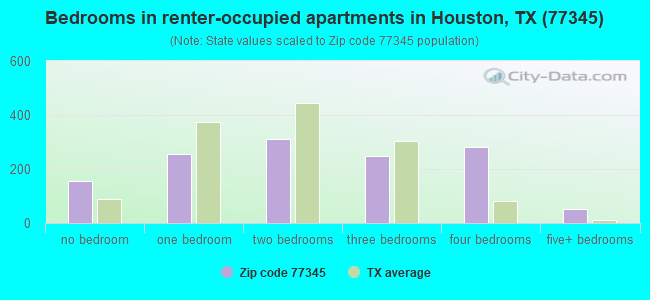
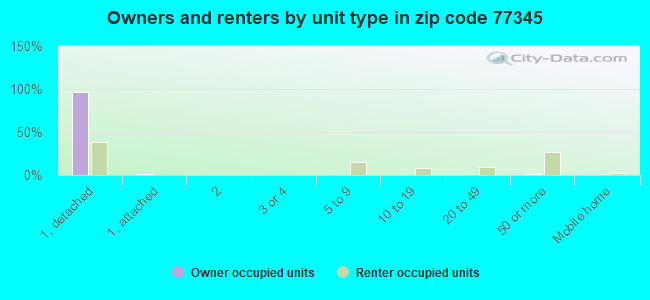
Houses and condos: 10,260 Renter-occupied apartments: 1,276
% of renters here:
13%
State:
38%
March 2022 cost of living index in zip code 77345: 97.2 (near average, U.S. average is 100)
Land area: 8.5 sq. mi. Water area: 2.2 sq. mi.
Population density: 3,253 people per square mile
(average).
OSM Map
General Map
Google Map
MSN Map
OSM Map
General Map
Google Map
MSN Map
OSM Map
General Map
Google Map
MSN Map
OSM Map
General Map
Google Map
MSN Map
Please wait while loading the map...
Real estate property taxes paid for housing units in 2022:
This zip code:
1.7% ($6,946)
Texas:
1.5% ($4,050)
Median real estate property taxes paid for housing units with mortgages in 2022: $7,787 (1.8%) Median real estate property taxes paid for housing units with no mortgage in 2022: $5,879 (1.5%)
Estimated median house/condo value in 2022: $409,397
77345:
$409,397
Texas:
$275,400
According to our research of Texas and other state lists, there were 9 registered sex offenders living in 77345 zip code as of June 01, 2024. The ratio of all residents to sex offenders in zip code 77345 is 3,372 to 1. The ratio of registered sex offenders to all residents in this zip code is much lower than the state average.
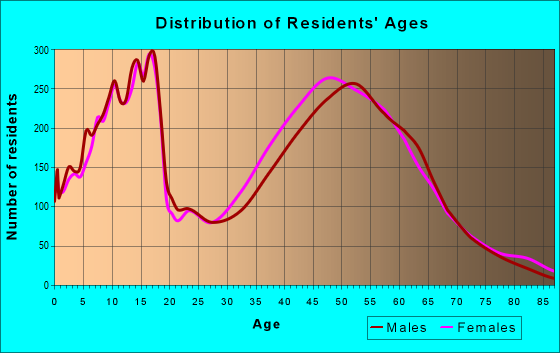
Median resident age:
This zip code:
42.2 years
Texas median age:
35.6 years
Average household size:
This zip code:
2.8 people
Texas:
2.6 people
Averages for the 2020 tax year for zip code 77345, filed in 2021:
Average Adjusted Gross Income (AGI) in 2020: $145,244 (Individual Income Tax Returns)
Here:
$145,244
State:
$77,054
Salary/wage: $118,561 (reported on 81.8% of returns)
Here:
$118,561
State:
$62,766
(% of AGI for various income ranges: 1022.6% for AGIs below $25k, 3297.1% for AGIs $25k-50k, 5948.3% for AGIs $50k-75k, 9105.6% for AGIs $75k-100k, 17175.2% for AGIs $100k-200k, 72258.8% for AGIs over 200k)
Taxable interest for individuals: $2,991 (reported on 42.3% of returns)
This zip code:
$2,991
Texas:
$2,665
(% of AGI for various income ranges: 23.0% for AGIs below $25k, 35.0% for AGIs $25k-50k, 72.1% for AGIs $50k-75k, 103.8% for AGIs $75k-100k, 135.0% for AGIs $100k-200k, 1138.8% for AGIs over 200k)
Ordinary dividends: $11,402 (reported on 39.3% of returns)
Here:
$11,402
State:
$10,044
(% of AGI for various income ranges: 44.7% for AGIs below $25k, 123.8% for AGIs $25k-50k, 236.6% for AGIs $50k-75k, 341.5% for AGIs $75k-100k, 593.6% for AGIs $100k-200k, 3892.6% for AGIs over 200k)
Net capital gain/loss in AGI: +$26,393 (reported on 35.8% of returns)
Here:
+$26,393
State:
+$39,590
(% of AGI for various income ranges: 30.7% for AGIs below $25k, 67.1% for AGIs $25k-50k, 151.2% for AGIs $50k-75k, 329.7% for AGIs $75k-100k, 451.1% for AGIs $100k-200k, 10910.8% for AGIs over 200k)
Profit/loss from business: +$22,019 (reported on 19.2% of returns)
Here:
+$22,019
State:
+$10,888
(% of AGI for various income ranges: 100.8% for AGIs below $25k, 112.2% for AGIs $25k-50k, 184.6% for AGIs $50k-75k, 311.7% for AGIs $75k-100k, 626.6% for AGIs $100k-200k, 3472.0% for AGIs over 200k)
Taxable individual retirement arrangement distribution: $50,705 (reported on 14.7% of returns)
77345:
$50,705
Texas:
$24,740
(% of AGI for various income ranges: 57.7% for AGIs below $25k, 223.1% for AGIs $25k-50k, 424.6% for AGIs $50k-75k, 710.0% for AGIs $75k-100k, 1672.6% for AGIs $100k-200k, 4916.1% for AGIs over 200k)
Self-employed (Keogh) retirement plans: $31,618 (reported on 1.4% of returns)
77345:
$31,618
Texas:
$29,298
(% of AGI for various income ranges: 45.2% for AGIs $100k-200k, 500.9% for AGIs over 200k)
Total itemized deductions: $43,441 (reported on 14.7% of returns)
Here:
$43,441
State:
$40,428
(% of AGI for various income ranges: 70.4% for AGIs below $25k, 167.9% for AGIs $25k-50k, 470.1% for AGIs $50k-75k, 526.5% for AGIs $75k-100k, 954.4% for AGIs $100k-200k, 5173.0% for AGIs over 200k)
Charity contributions: $21,586 (reported on 13.0% of returns)
Here:
$21,586
State:
$18,201
(% of AGI for various income ranges: 5.4% for AGIs below $25k, 36.4% for AGIs $25k-50k, 96.3% for AGIs $50k-75k, 131.7% for AGIs $75k-100k, 314.2% for AGIs $100k-200k, 2777.7% for AGIs over 200k)
Taxes paid: $8,508 (reported on 14.5% of returns)
77345:
$8,508
State:
$7,821
(% of AGI for various income ranges: 14.9% for AGIs below $25k, 33.8% for AGIs $25k-50k, 104.9% for AGIs $50k-75k, 118.3% for AGIs $75k-100k, 219.9% for AGIs $100k-200k, 887.2% for AGIs over 200k)
Earned income credit: $1,979 (reported on 6.1% of returns)
Here:
$1,979
State:
$2,584
(% of AGI for various income ranges: 48.3% for AGIs below $25k, 51.4% for AGIs $25k-50k, 1.1% for AGIs $50k-75k)
Percentage of individuals using paid preparers for their 2020 taxes: 91.6%
Here:
92%
State:
92%
(% for various income ranges: 89.9% for AGIs below $25k, 91.9% for AGIs $25k-50k, 94.3% for AGIs $50k-75k, 90.3% for AGIs $75k-100k, 92.1% for AGIs $100k-200k, 91.9% for AGIs over 200k)
Averages for the 2012 tax year for zip code 77345, filed in 2013:
Average Adjusted Gross Income (AGI) in 2012: $148,509 (Individual Income Tax Returns)
Here:
$148,509
State:
$65,384
Salary/wage: $124,583 (reported on 86.2% of returns)
Here:
$124,583
State:
$52,524
(% of AGI for various income ranges: 78.4% for AGIs below $25k, 77.5% for AGIs $25k-50k, 71.5% for AGIs $50k-75k, 72.2% for AGIs $75k-100k, 79.5% for AGIs $100k-200k, 68.9% for AGIs over 200k)
Taxable interest for individuals: $1,949 (reported on 48.2% of returns)
This zip code:
$1,949
Texas:
$2,372
(% of AGI for various income ranges: 1.6% for AGIs below $25k, 1.1% for AGIs $25k-50k, 1.3% for AGIs $50k-75k, 0.8% for AGIs $75k-100k, 0.5% for AGIs $100k-200k, 0.6% for AGIs over 200k)
Ordinary dividends: $10,158 (reported on 38.6% of returns)
Here:
$10,158
State:
$9,721
(% of AGI for various income ranges: 3.2% for AGIs below $25k, 2.2% for AGIs $25k-50k, 1.9% for AGIs $50k-75k, 1.8% for AGIs $75k-100k, 1.6% for AGIs $100k-200k, 3.2% for AGIs over 200k)
Net capital gain/loss in AGI: +$22,620 (reported on 33.0% of returns)
Here:
+$22,620
State:
+$35,319
(% of AGI for various income ranges: 1.5% for AGIs below $25k, 0.5% for AGIs $25k-50k, 0.7% for AGIs $50k-75k, 0.5% for AGIs $75k-100k, 0.9% for AGIs $100k-200k, 7.8% for AGIs over 200k)
Profit/loss from business: +$32,000 (reported on 17.2% of returns)
Here:
+$32,000
State:
+$13,732
(% of AGI for various income ranges: 6.5% for AGIs below $25k, 3.8% for AGIs $25k-50k, 4.7% for AGIs $50k-75k, 3.7% for AGIs $75k-100k, 3.5% for AGIs $100k-200k, 3.7% for AGIs over 200k)
Taxable individual retirement arrangement distribution: $38,450 (reported on 13.7% of returns)
77345:
$38,450
Texas:
$19,511
(% of AGI for various income ranges: 3.5% for AGIs below $25k, 4.0% for AGIs $25k-50k, 4.9% for AGIs $50k-75k, 6.1% for AGIs $75k-100k, 5.0% for AGIs $100k-200k, 2.6% for AGIs over 200k)
Self-employment retirement plans: $25,676 (reported on 1.7% of returns)
77345:
$25,676
Texas:
$23,938
(% of AGI for various income ranges: 0.5% for AGIs $25k-50k, 0.2% for AGIs $100k-200k, 0.4% for AGIs over 200k)
Total itemized deductions: $28,723 (12% of AGI, reported on 53.4% of returns)
Here:
$28,723
State:
$24,724
Here:
12.5% of AGI
State:
15.9% of AGI
(% of AGI for various income ranges: 14.2% for AGIs below $25k, 14.3% for AGIs $25k-50k, 15.2% for AGIs $50k-75k, 14.4% for AGIs $75k-100k, 12.6% for AGIs $100k-200k, 8.4% for AGIs over 200k)
Charity contributions: $8,699 (reported on 47.5% of returns)
Here:
$8,699
State:
$6,808
(% of AGI for various income ranges: 1.0% for AGIs below $25k, 1.6% for AGIs $25k-50k, 2.0% for AGIs $50k-75k, 2.1% for AGIs $75k-100k, 2.3% for AGIs $100k-200k, 3.2% for AGIs over 200k)
Taxes paid: $9,560 (reported on 53.0% of returns)
77345:
$9,560
State:
$6,921
(% of AGI for various income ranges: 2.7% for AGIs below $25k, 3.7% for AGIs $25k-50k, 4.4% for AGIs $50k-75k, 4.5% for AGIs $75k-100k, 4.6% for AGIs $100k-200k, 2.8% for AGIs over 200k)
Earned income credit: $1,786 (reported on 4.8% of returns)
Here:
$1,786
State:
$2,570
(% of AGI for various income ranges: 2.9% for AGIs below $25k, 0.6% for AGIs $25k-50k)
Percentage of individuals using paid preparers for their 2012 taxes: 41.2%
Here:
41%
State:
51%
(% for various income ranges: 31.0% for AGIs below $25k, 39.6% for AGIs $25k-50k, 44.1% for AGIs $50k-75k, 43.0% for AGIs $75k-100k, 40.7% for AGIs $100k-200k, 53.6% for AGIs over 200k)
Averages for the 2004 tax year for zip code 77345, filed in 2005:
Average Adjusted Gross Income (AGI) in 2004: $111,183 (Individual Income Tax Returns)
Here:
$111,183
State:
$47,881
Salary/wage: $99,231 (reported on 86.5% of returns)
Here:
$99,231
State:
$41,947
(% of AGI for various income ranges: 207.4% for AGIs below $10k, 73.0% for AGIs $10k-25k, 73.5% for AGIs $25k-50k, 78.1% for AGIs $50k-75k, 81.6% for AGIs $75k-100k, 76.4% for AGIs over 100k)
Taxable interest for individuals: $1,943 (reported on 63.5% of returns)
This zip code:
$1,943
Texas:
$2,255
(% of AGI for various income ranges: 21.6% for AGIs below $10k, 3.8% for AGIs $10k-25k, 2.8% for AGIs $25k-50k, 1.8% for AGIs $50k-75k, 1.3% for AGIs $75k-100k, 0.8% for AGIs over 100k)
Taxable dividends: $5,499 (reported on 47.6% of returns)
Here:
$5,499
State:
$4,261
(% of AGI for various income ranges: 17.5% for AGIs below $10k, 4.2% for AGIs $10k-25k, 2.5% for AGIs $25k-50k, 1.9% for AGIs $50k-75k, 1.4% for AGIs $75k-100k, 2.4% for AGIs over 100k)
Net capital gain/loss: +$10,122 (reported on 39.6% of returns)
Here:
+$10,122
State:
+$16,110
(% of AGI for various income ranges: -14.1% for AGIs below $10k, 0.7% for AGIs $10k-25k, 1.3% for AGIs $25k-50k, 0.9% for AGIs $50k-75k, 0.8% for AGIs $75k-100k, 4.3% for AGIs over 100k)
Profit/loss from business: +$23,251 (reported on 17.2% of returns)
Here:
+$23,251
State:
+$11,013
(% of AGI for various income ranges: -9.0% for AGIs below $10k, 4.3% for AGIs $10k-25k, 5.1% for AGIs $25k-50k, 5.8% for AGIs $50k-75k, 3.2% for AGIs $75k-100k, 3.5% for AGIs over 100k)
IRA payment deduction: $3,500 (reported on 3.6% of returns)
77345:
$3,500
Texas:
$3,120
(% of AGI for various income ranges: 1.0% for AGIs below $10k, 0.2% for AGIs $10k-25k, 0.3% for AGIs $25k-50k, 0.4% for AGIs $50k-75k, 0.2% for AGIs $75k-100k, 0.1% for AGIs over 100k)
Self-employed pension: $20,299 (reported on 2.1% of returns)
Here:
$20,299
Texas:
$16,401
(% of AGI for various income ranges: 0.2% for AGIs $25k-50k, 0.2% for AGIs $50k-75k, 0.3% for AGIs $75k-100k, 0.4% for AGIs over 100k)
Total itemized deductions: $22,830 (15% of AGI, reported on 58.9% of returns)
Here:
$22,830
State:
$19,631
Here:
14.7% of AGI
State:
18.9% of AGI
(% of AGI for various income ranges: 29.8% for AGIs below $10k, 23.6% for AGIs $10k-25k, 19.3% for AGIs $25k-50k, 20.8% for AGIs $50k-75k, 17.8% for AGIs $75k-100k, 10.3% for AGIs over 100k)
Charity contributions deductions: $5,515 (3% of AGI, reported on 54.2% of returns)
Here:
$5,515
State:
$4,753
Here:
3.4% of AGI
State:
4.2% of AGI
(% of AGI for various income ranges: 1.5% for AGIs below $10k, 1.4% for AGIs $10k-25k, 2.3% for AGIs $25k-50k, 2.9% for AGIs $50k-75k, 2.8% for AGIs $75k-100k, 2.7% for AGIs over 100k)
Total tax: $24,756 (reported on 82.6% of returns)
77345:
$24,756
State:
$9,058
(% of AGI for various income ranges: 4.8% for AGIs below $10k, 4.8% for AGIs $10k-25k, 7.4% for AGIs $25k-50k, 8.6% for AGIs $50k-75k, 9.9% for AGIs $75k-100k, 20.8% for AGIs over 100k)
Earned income credit: $1,475 (reported on 3.0% of returns)
Here:
$1,475
State:
$2,024
Percentage of individuals using paid preparers for their 2004 taxes: 40.2%
Here:
40%
State:
57%
(% for various income ranges: 28.1% for AGIs below $10k, 40.6% for AGIs $10k-25k, 48.2% for AGIs $25k-50k, 45.8% for AGIs $50k-75k, 41.6% for AGIs $75k-100k, 42.5% for AGIs over 100k)
Likely homosexual households (counted as self-reported same-sex unmarried-partner households)
Lesbian couples: 0.0% of all households
Gay men: 0.1% of all households
Household received Food Stamps/SNAP in the past 12 months: 132 Household did not receive Food Stamps/SNAP in the past 12 months: 9,664
Women who had a birth in the past 12 months: 279 (282 now married, 1 unmarried) Women who did not have a birth in the past 12 months: 5,758 (3,285 now married, 2,449 unmarried)
Housing units in zip code 77345 with a mortgage: 5,243 (474 second mortgage, 322 both second mortgage and home equity loan) Houses without a mortgage: 34
Median monthly owner costs for units with a mortgage: $2,721 Median monthly owner costs for units without a mortgage: $1,041
Residents with income below the poverty level in 2022:
This zip code:
2.5%
Whole state:
14.0%
Residents with income below 50% of the poverty level in 2022:
This zip code:
1.5%
Whole state:
7.4%
Median number of rooms in houses and condos:
Here:
10.0
State:
6.3
Median number of rooms in apartments:
Here:
4.3
State:
4.0
Notable locations in this zip code not listed on our city pages
Notable locations in zip code 77345: Houston Fire Department Station 103 (A), Houston Fire Department / Emergency Medical Services Station 102 (B), Lake Houston YMCA (C). Display/hide their locations on the map
Churches in zip code 77345 include: Kingwood Assembly of God Church (A), Strawbridge United Methodist Church (B), Chapel in the Forest Church (C), Woodridge Baptist Church of Kingwood (D). Display/hide their locations on the map
Streams, rivers, and creeks: White Oak Creek (A), West Fork San Jacinto River (B), East Fork San Jacinto River (C), Caney Creek (D), Bens Branch (E). Display/hide their locations on the map
In group quarters: 17 (-1 institutionalized population)
Size of family households: 3,401 2-persons, 1,461 3-persons, 1,720 4-persons, 822 5-persons, 427 6-persons, 147 7-or-more-persons
Size of nonfamily households: 1,758 1-person, 40 2-persons
6,807 married couples with children.
400 single-parent households (134 men, 266 women).
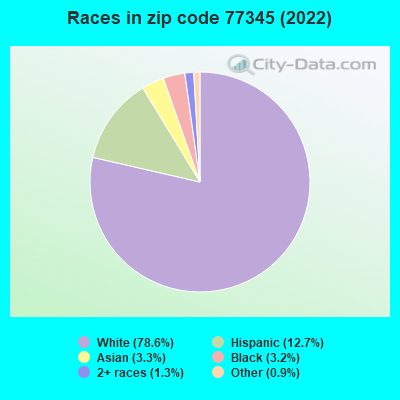
88.1% of residents of 77345 zip code speak English at home.
6.6% of residents speak Spanish at home (76% very well, 16% well, 6% not well, 2% not at all).
2.7% of residents speak other Indo-European language at home (89% very well, 8% well, 4% not well).
2.3% of residents speak Asian or Pacific Island language at home (79% very well, 19% well, 2% not well).
0.6% of residents speak other language at home (95% very well, 5% well).
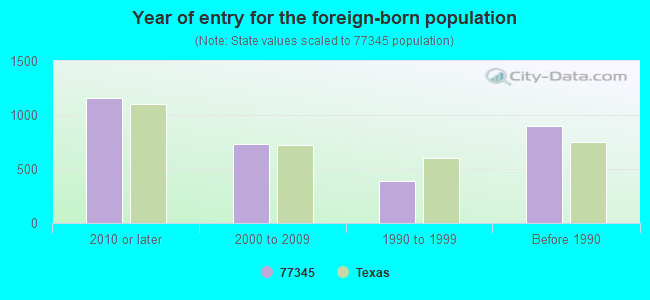
Foreign born population: 2,535 (9.2%) (54.2% of them are naturalized citizens)
Housing units lacking complete plumbing facilities: 1.0% Housing units lacking complete kitchen facilities: 2.7%
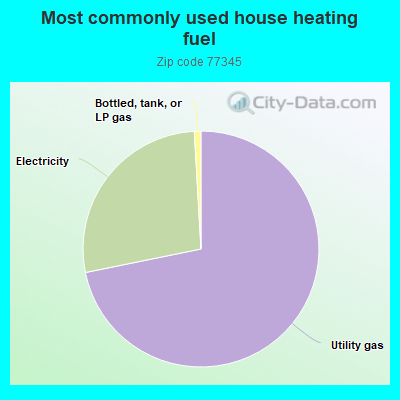
71.8%Utility gas
27.3%Electricity
0.9%Bottled, tank, or LP gas
Population in 1990: 13,004. Population change in the 1990s: +9,618 (+74.0%).
Place of birth for U.S.-born residents:
This state: 12,673
Northeast: 1,965
Midwest: 2,993
South: 4,482
West: 2,360
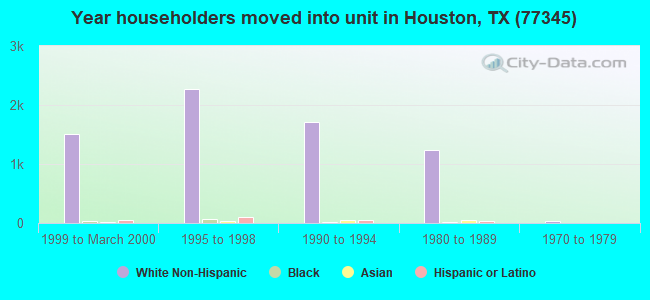
50% of the 77345 zip code residents lived in the same house 5 years ago. Out of people who lived in different houses, 47% lived in this county. Out of people who lived in different counties, 50% lived in Texas.
91% of the 77345 zip code residents lived in the same house 1 year ago. Out of people who lived in different houses, 51% moved from this county. Out of people who lived in different houses, 27% moved from different county within same state. Out of people who lived in different houses, 18% moved from different state. Out of people who lived in different houses, 6% moved from abroad.
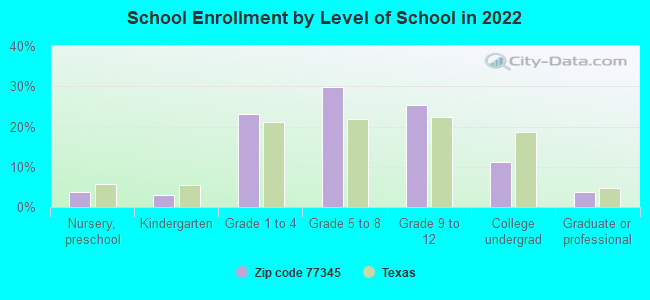
Private vs. public school enrollment:
Students in private schools in grades 1 to 8 (elementary and middle school): 321
Here:
7.0%
Texas:
8.8%
Students in private schools in grades 9 to 12 (high school): 219
Here:
10.0%
Texas:
8.0%
Students in private undergraduate colleges: 209
Here:
21.9%
Texas:
16.2%
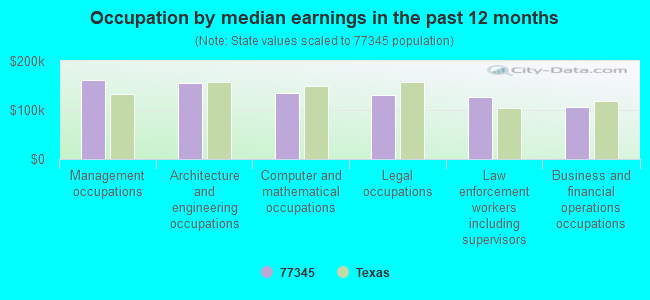
Occupation by median earnings in the past 12 months ($)
161,067Management occupations
155,589Architecture and engineering occupations
135,613Computer and mathematical occupations
131,051Legal occupations
127,246Law enforcement workers including supervisors
105,132Business and financial operations occupations
Companies with federal contracts located in this zip code:
WEST COAST CONTRACTING (4923 PINE PRAIRIE LN in KINGWOOD, TX; small business) : $290,043 in 6 contractsfrom 2003 to 2006
Contracts for Miscellaneous Power Transmission Equipment, Vehicular Brake, Steering, Axle, Wheel, and Track Components, Guns, through 30 mm by Army, Defense Logistics Agency Signed by year:2000: $0; 2001: $0; 2002: $0; 2003: $88,750; 2004: $73,041; 2005: $128,752; 2006: -$500.
Biggest contracts:
$88,750 with Army for Miscellaneous Power Transmission Equipment. Taking place in NV. Signed on 2003-06-12. Completion date: 2003-05-21.
$78,764 with Army for Vehicular Brake, Steering, Axle, Wheel, and Track Components. Signed on 2005-06-30. Completion date: 2005-11-30.
$49,988 with Defense Logistics Agency for Guns, through 30 mm. Signed on 2005-09-08. Completion date: 2005-12-08.
$39,771, same as above.Signed on 2004-07-23. Completion date: 2004-09-12.
MASS SPEC RESOURCES (5827 BEACON FALLS DRIVE in KINGWOOD, TX; small business) : $22,800 in 3 contractsfrom 2003 to 2004
$10,650 with Army for Maintenance, Repair and Rebuilding of Equipment -- Instruments and Laboratory Equipment. Signed on 2003-09-24. Completion date: 2003-10-23.
$7,200 with Army for Laboratory Equipment and Supplies. Signed on 2004-07-31. Completion date: 2004-08-31.
$4,950 with Army for Maintenance, Repair and Rebuilding of Equipment -- Pumps and Compressors. Signed on 2004-09-12. Completion date: 2004-10-18.
ROBERT M GRAZIANO (3622 VALLEY CHASE DR in KINGWOOD, TX; small business)
$11,000 with U.S. Army Corps of Engineers - civil program financing only for Other Professional Services. Taking place in MS. Signed on 2002-04-25. Completion date: 2002-06-30.
UNIVERSITY OF TEXAS AT HOUSTON (1719 CHCESTNUT GROVE LANE in KINGWOOD, TX, )
$6,300 with Centers for Disease Control and Prevention for Other Professional Services. Signed on 2006-03-29. Completion date: 2006-04-07.
Top industries in this zip code by the number of employees in 2005:
Other Services (except Public Administration): Religious Organizations (50-99 employees: 2 establishments, 10-19 employees: 1 establishment, 1-4 employees: 5 establishments)
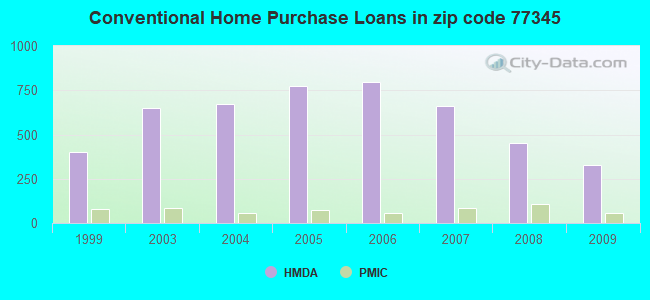
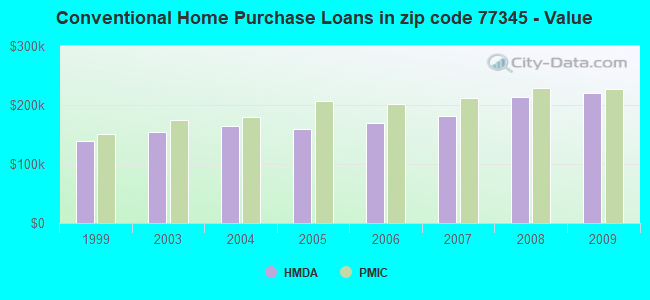
Detailed PMIC statistics for the following Tracts:2509.00
, 2515.00
2004 - 2018 National Fire Incident Reporting System (NFIRS) incidents
Based on the data from the years 2004 - 2018 the average number of fires per year is 26. The highest number of reported fires - 83 took place in 2011, and the least - 0 in 2006. The data has an increasing trend.
When looking into fire subcategories, the most incidents belonged to: Outside Fires (57.7%), and Structure Fires (28.4%).
Fire incident types reported to NFIRS in Zip Code 77345
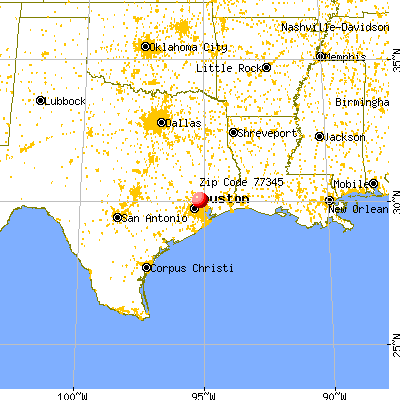


 Nearest zip codes: 77336, 77346, 77339, 77357, 77338, 77044.


 : $290,043 in 6 contracts from 2003 to 2006


 Based on the data from the years 2004 - 2018 the average number of fires per year is 26. The highest number of reported fires - 83 took place in 2011, and the least - 0 in 2006. The data has an increasing trend.
 When looking into fire subcategories, the most incidents belonged to: Outside Fires (57.7%), and Structure Fires (28.4%).