Estimated zip code population in 2022: 82,254 Zip code population in 2010: 61,361 Zip code population in 2000: 32,675
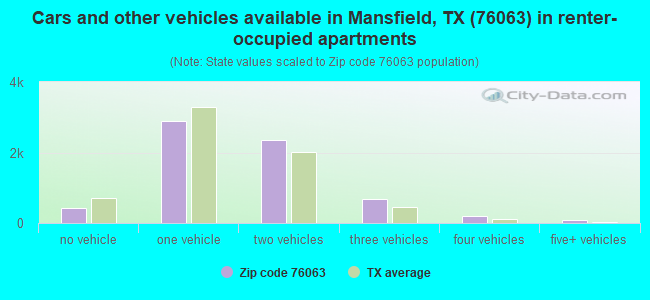
Houses and condos: 28,096 Renter-occupied apartments: 6,656
% of renters here:
24%
State:
38%
March 2022 cost of living index in zip code 76063: 96.3 (near average, U.S. average is 100)
Land area: 51.8 sq. mi. Water area: 0.2 sq. mi.
Population density: 1,586 people per square mile
(low).
OSM Map
General Map
Google Map
MSN Map
OSM Map
General Map
Google Map
MSN Map
OSM Map
General Map
Google Map
MSN Map
OSM Map
General Map
Google Map
MSN Map
Please wait while loading the map...
Real estate property taxes paid for housing units in 2022:
This zip code:
1.8% ($7,268)
Texas:
1.5% ($4,050)
Median real estate property taxes paid for housing units with mortgages in 2022: $7,881 (1.9%) Median real estate property taxes paid for housing units with no mortgage in 2022: $5,907 (1.6%)
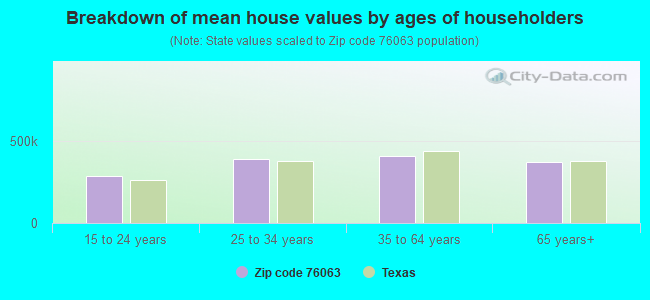
Estimated median house/condo value in 2022: $406,041
76063:
$406,041
Texas:
$275,400
According to our research of Texas and other state lists, there were 69 registered sex offenders living in 76063 zip code as of June 06, 2024. The ratio of all residents to sex offenders in zip code 76063 is 996 to 1. The ratio of registered sex offenders to all residents in this zip code is lower than the state average.
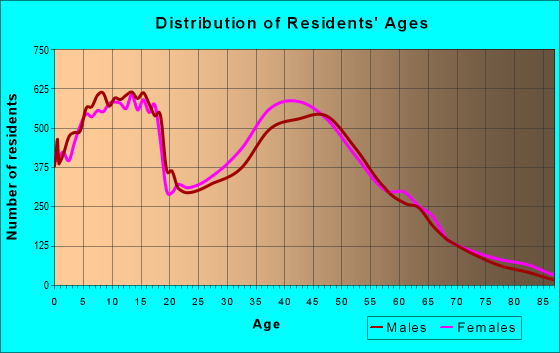
Median resident age:
This zip code:
38.2 years
Texas median age:
35.6 years
Average household size:
This zip code:
3.0 people
Texas:
2.6 people
Averages for the 2020 tax year for zip code 76063, filed in 2021:
Average Adjusted Gross Income (AGI) in 2020: $87,730 (Individual Income Tax Returns)
Here:
$87,730
State:
$77,054
Salary/wage: $75,287 (reported on 85.7% of returns)
Here:
$75,287
State:
$62,766
(% of AGI for various income ranges: 1186.8% for AGIs below $25k, 3677.5% for AGIs $25k-50k, 6753.9% for AGIs $50k-75k, 9764.7% for AGIs $75k-100k, 18901.1% for AGIs $100k-200k, 63577.2% for AGIs over 200k)
Taxable interest for individuals: $1,853 (reported on 24.7% of returns)
This zip code:
$1,853
Texas:
$2,665
(% of AGI for various income ranges: 8.8% for AGIs below $25k, 14.7% for AGIs $25k-50k, 29.7% for AGIs $50k-75k, 40.4% for AGIs $75k-100k, 66.7% for AGIs $100k-200k, 928.8% for AGIs over 200k)
Ordinary dividends: $6,306 (reported on 17.3% of returns)
Here:
$6,306
State:
$10,044
(% of AGI for various income ranges: 14.5% for AGIs below $25k, 26.4% for AGIs $25k-50k, 55.1% for AGIs $50k-75k, 103.8% for AGIs $75k-100k, 198.0% for AGIs $100k-200k, 2186.1% for AGIs over 200k)
Net capital gain/loss in AGI: +$22,186 (reported on 17.1% of returns)
Here:
+$22,186
State:
+$39,590
(% of AGI for various income ranges: 6.7% for AGIs below $25k, 22.2% for AGIs $25k-50k, 61.6% for AGIs $50k-75k, 111.2% for AGIs $75k-100k, 348.4% for AGIs $100k-200k, 10767.6% for AGIs over 200k)
Profit/loss from business: +$9,780 (reported on 22.3% of returns)
Here:
+$9,780
State:
+$10,888
(% of AGI for various income ranges: 71.9% for AGIs below $25k, 74.2% for AGIs $25k-50k, 147.8% for AGIs $50k-75k, 265.5% for AGIs $75k-100k, 545.3% for AGIs $100k-200k, 3012.0% for AGIs over 200k)
Taxable individual retirement arrangement distribution: $22,112 (reported on 7.4% of returns)
76063:
$22,112
Texas:
$24,740
(% of AGI for various income ranges: 35.1% for AGIs below $25k, 67.0% for AGIs $25k-50k, 166.0% for AGIs $50k-75k, 288.2% for AGIs $75k-100k, 540.7% for AGIs $100k-200k, 1416.9% for AGIs over 200k)
Self-employed (Keogh) retirement plans: $20,327 (reported on 0.4% of returns)
76063:
$20,327
Texas:
$29,298
(% of AGI for various income ranges: 18.0% for AGIs $100k-200k, 212.2% for AGIs over 200k)
Total itemized deductions: $35,628 (reported on 13.0% of returns)
Here:
$35,628
State:
$40,428
(% of AGI for various income ranges: 46.2% for AGIs below $25k, 155.6% for AGIs $25k-50k, 437.7% for AGIs $50k-75k, 687.5% for AGIs $75k-100k, 1312.7% for AGIs $100k-200k, 5847.8% for AGIs over 200k)
Charity contributions: $14,509 (reported on 11.2% of returns)
Here:
$14,509
State:
$18,201
(% of AGI for various income ranges: 3.7% for AGIs below $25k, 29.2% for AGIs $25k-50k, 96.5% for AGIs $50k-75k, 174.6% for AGIs $75k-100k, 447.8% for AGIs $100k-200k, 2662.8% for AGIs over 200k)
Taxes paid: $8,310 (reported on 12.9% of returns)
76063:
$8,310
State:
$7,821
(% of AGI for various income ranges: 8.5% for AGIs below $25k, 37.2% for AGIs $25k-50k, 119.3% for AGIs $50k-75k, 188.5% for AGIs $75k-100k, 340.3% for AGIs $100k-200k, 1066.3% for AGIs over 200k)
Earned income credit: $2,387 (reported on 13.0% of returns)
Here:
$2,387
State:
$2,584
(% of AGI for various income ranges: 90.2% for AGIs below $25k, 71.4% for AGIs $25k-50k, 1.2% for AGIs $50k-75k)
Percentage of individuals using paid preparers for their 2020 taxes: 93.0%
Here:
93%
State:
92%
(% for various income ranges: 92.7% for AGIs below $25k, 93.7% for AGIs $25k-50k, 92.7% for AGIs $50k-75k, 92.5% for AGIs $75k-100k, 93.3% for AGIs $100k-200k, 93.0% for AGIs over 200k)
Averages for the 2012 tax year for zip code 76063, filed in 2013:
Average Adjusted Gross Income (AGI) in 2012: $76,930 (Individual Income Tax Returns)
Here:
$76,930
State:
$65,384
Salary/wage: $67,979 (reported on 88.2% of returns)
Here:
$67,979
State:
$52,524
(% of AGI for various income ranges: 81.3% for AGIs below $25k, 85.0% for AGIs $25k-50k, 82.4% for AGIs $50k-75k, 83.4% for AGIs $75k-100k, 84.2% for AGIs $100k-200k, 63.2% for AGIs over 200k)
Taxable interest for individuals: $1,350 (reported on 28.9% of returns)
This zip code:
$1,350
Texas:
$2,372
(% of AGI for various income ranges: 0.7% for AGIs below $25k, 0.4% for AGIs $25k-50k, 0.4% for AGIs $50k-75k, 0.4% for AGIs $75k-100k, 0.3% for AGIs $100k-200k, 0.8% for AGIs over 200k)
Ordinary dividends: $5,024 (reported on 17.2% of returns)
Here:
$5,024
State:
$9,721
(% of AGI for various income ranges: 1.1% for AGIs below $25k, 0.7% for AGIs $25k-50k, 0.6% for AGIs $50k-75k, 0.6% for AGIs $75k-100k, 0.6% for AGIs $100k-200k, 2.3% for AGIs over 200k)
Net capital gain/loss in AGI: +$13,881 (reported on 14.6% of returns)
Here:
+$13,881
State:
+$35,319
(% of AGI for various income ranges: 0.1% for AGIs below $25k, 0.3% for AGIs $25k-50k, 0.2% for AGIs $50k-75k, 0.2% for AGIs $75k-100k, 0.5% for AGIs $100k-200k, 8.5% for AGIs over 200k)
Profit/loss from business: +$12,693 (reported on 19.8% of returns)
Here:
+$12,693
State:
+$13,732
(% of AGI for various income ranges: 7.3% for AGIs below $25k, 3.0% for AGIs $25k-50k, 3.2% for AGIs $50k-75k, 3.1% for AGIs $75k-100k, 2.7% for AGIs $100k-200k, 3.6% for AGIs over 200k)
Taxable individual retirement arrangement distribution: $19,400 (reported on 8.0% of returns)
76063:
$19,400
Texas:
$19,511
(% of AGI for various income ranges: 2.1% for AGIs below $25k, 1.8% for AGIs $25k-50k, 2.3% for AGIs $50k-75k, 2.0% for AGIs $75k-100k, 2.3% for AGIs $100k-200k, 1.7% for AGIs over 200k)
Self-employment retirement plans: $18,133 (reported on 0.4% of returns)
76063:
$18,133
Texas:
$23,938
(% of AGI for various income ranges: 0.1% for AGIs $50k-75k, 0.2% for AGIs over 200k)
Total itemized deductions: $23,329 (18% of AGI, reported on 41.9% of returns)
Here:
$23,329
State:
$24,724
Here:
18.0% of AGI
State:
15.9% of AGI
(% of AGI for various income ranges: 10.2% for AGIs below $25k, 12.8% for AGIs $25k-50k, 14.5% for AGIs $50k-75k, 15.0% for AGIs $75k-100k, 14.3% for AGIs $100k-200k, 9.5% for AGIs over 200k)
Charity contributions: $5,637 (reported on 34.8% of returns)
Here:
$5,637
State:
$6,808
(% of AGI for various income ranges: 1.0% for AGIs below $25k, 1.7% for AGIs $25k-50k, 2.4% for AGIs $50k-75k, 2.5% for AGIs $75k-100k, 3.0% for AGIs $100k-200k, 2.7% for AGIs over 200k)
Taxes paid: $7,343 (reported on 41.3% of returns)
76063:
$7,343
State:
$6,921
(% of AGI for various income ranges: 2.8% for AGIs below $25k, 3.2% for AGIs $25k-50k, 4.1% for AGIs $50k-75k, 4.7% for AGIs $75k-100k, 4.7% for AGIs $100k-200k, 3.0% for AGIs over 200k)
Earned income credit: $2,323 (reported on 13.8% of returns)
Here:
$2,323
State:
$2,570
(% of AGI for various income ranges: 6.5% for AGIs below $25k, 1.2% for AGIs $25k-50k)
Percentage of individuals using paid preparers for their 2012 taxes: 45.5%
Here:
46%
State:
51%
(% for various income ranges: 40.7% for AGIs below $25k, 45.1% for AGIs $25k-50k, 46.2% for AGIs $50k-75k, 46.2% for AGIs $75k-100k, 46.8% for AGIs $100k-200k, 68.0% for AGIs over 200k)
Averages for the 2004 tax year for zip code 76063, filed in 2005:
Average Adjusted Gross Income (AGI) in 2004: $67,584 (Individual Income Tax Returns)
Here:
$67,584
State:
$47,881
Salary/wage: $60,607 (reported on 90.1% of returns)
Here:
$60,607
State:
$41,947
(% of AGI for various income ranges: 156.6% for AGIs below $10k, 84.0% for AGIs $10k-25k, 86.5% for AGIs $25k-50k, 87.8% for AGIs $50k-75k, 89.2% for AGIs $75k-100k, 73.9% for AGIs over 100k)
Taxable interest for individuals: $1,416 (reported on 40.8% of returns)
This zip code:
$1,416
Texas:
$2,255
(% of AGI for various income ranges: 5.2% for AGIs below $10k, 1.3% for AGIs $10k-25k, 0.8% for AGIs $25k-50k, 0.6% for AGIs $50k-75k, 0.5% for AGIs $75k-100k, 1.0% for AGIs over 100k)
Taxable dividends: $3,088 (reported on 21.4% of returns)
Here:
$3,088
State:
$4,261
(% of AGI for various income ranges: 5.1% for AGIs below $10k, 0.7% for AGIs $10k-25k, 0.6% for AGIs $25k-50k, 0.4% for AGIs $50k-75k, 0.4% for AGIs $75k-100k, 1.4% for AGIs over 100k)
Net capital gain/loss: +$18,229 (reported on 19.2% of returns)
Here:
+$18,229
State:
+$16,110
(% of AGI for various income ranges: -2.0% for AGIs below $10k, 0.2% for AGIs $10k-25k, 0.3% for AGIs $25k-50k, 0.4% for AGIs $50k-75k, 0.7% for AGIs $75k-100k, 9.4% for AGIs over 100k)
Profit/loss from business: +$12,156 (reported on 19.5% of returns)
Here:
+$12,156
State:
+$11,013
(% of AGI for various income ranges: 14.1% for AGIs below $10k, 4.5% for AGIs $10k-25k, 3.5% for AGIs $25k-50k, 3.2% for AGIs $50k-75k, 2.6% for AGIs $75k-100k, 3.7% for AGIs over 100k)
IRA payment deduction: $3,201 (reported on 2.4% of returns)
76063:
$3,201
Texas:
$3,120
(% of AGI for various income ranges: 0.2% for AGIs $10k-25k, 0.2% for AGIs $25k-50k, 0.1% for AGIs $50k-75k, 0.1% for AGIs $75k-100k, 0.1% for AGIs over 100k)
Self-employed pension: $12,731 (reported on 0.8% of returns)
Here:
$12,731
Texas:
$16,401
(% of AGI for various income ranges: 0.1% for AGIs $25k-50k, 0.1% for AGIs $50k-75k, 0.1% for AGIs $75k-100k, 0.2% for AGIs over 100k)
Total itemized deductions: $20,755 (20% of AGI, reported on 49.5% of returns)
Here:
$20,755
State:
$19,631
Here:
20.4% of AGI
State:
18.9% of AGI
(% of AGI for various income ranges: 18.0% for AGIs below $10k, 11.3% for AGIs $10k-25k, 16.0% for AGIs $25k-50k, 18.7% for AGIs $50k-75k, 18.6% for AGIs $75k-100k, 13.2% for AGIs over 100k)
Charity contributions deductions: $4,681 (4% of AGI, reported on 42.6% of returns)
Here:
$4,681
State:
$4,753
Here:
4.4% of AGI
State:
4.2% of AGI
(% of AGI for various income ranges: 0.8% for AGIs below $10k, 1.3% for AGIs $10k-25k, 2.3% for AGIs $25k-50k, 2.7% for AGIs $50k-75k, 2.7% for AGIs $75k-100k, 3.4% for AGIs over 100k)
Total tax: $11,249 (reported on 79.1% of returns)
76063:
$11,249
State:
$9,058
(% of AGI for various income ranges: 4.8% for AGIs below $10k, 4.2% for AGIs $10k-25k, 6.0% for AGIs $25k-50k, 7.9% for AGIs $50k-75k, 9.5% for AGIs $75k-100k, 18.1% for AGIs over 100k)
Earned income credit: $1,802 (reported on 11.3% of returns)
Here:
$1,802
State:
$2,024
Percentage of individuals using paid preparers for their 2004 taxes: 50.3%
Here:
50%
State:
57%
(% for various income ranges: 39.5% for AGIs below $10k, 54.7% for AGIs $10k-25k, 54.6% for AGIs $25k-50k, 51.1% for AGIs $50k-75k, 45.2% for AGIs $75k-100k, 53.8% for AGIs over 100k)
Likely homosexual households (counted as self-reported same-sex unmarried-partner households)
Lesbian couples: 0.0% of all households
Gay men: 0.0% of all households
Household received Food Stamps/SNAP in the past 12 months: 1,498 Household did not receive Food Stamps/SNAP in the past 12 months: 25,702
Women who had a birth in the past 12 months: 532 (528 now married, 12 unmarried) Women who did not have a birth in the past 12 months: 19,967 (9,160 now married, 10,795 unmarried)
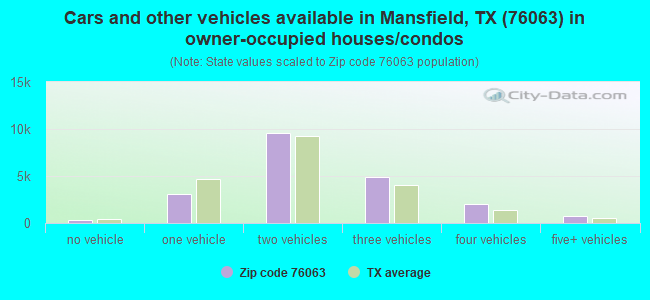
Housing units in zip code 76063 with a mortgage: 14,439 (887 second mortgage, 143 home equity loan, 662 both second mortgage and home equity loan) Houses without a mortgage: 115
Median monthly owner costs for units with a mortgage: $2,458 Median monthly owner costs for units without a mortgage: $945
Residents with income below the poverty level in 2022:
This zip code:
6.7%
Whole state:
14.0%
Residents with income below 50% of the poverty level in 2022:
This zip code:
3.3%
Whole state:
7.4%
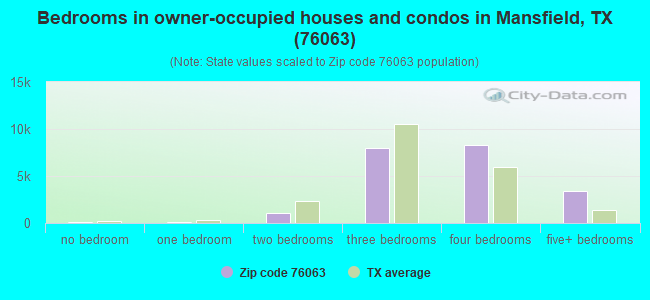
Median number of rooms in houses and condos:
Here:
7.5
State:
6.3
Median number of rooms in apartments:
Here:
4.1
State:
4.0
Notable locations in this zip code not listed on our city pages
Notable locations in zip code 76063: Mansfield Fire Department Station 1 (A), Mansfield Fire Department Station 2 (B), Trans - Care Medical Transport (C). Display/hide their locations on the map
Churches in zip code 76063 include: Powerhouse Church (A), Mansfield Community Church (B), New Zion Missionary Baptist Church (C), Walnut Ridge Baptist Church (D), North Side Church of Christ (E), Church of Christ Mansfield (F), Walnut Creek Church of God (G), Sweethome Church of God in Christ (H), Saint Gregorys Episcopal Church (I). Display/hide their locations on the map
Cemeteries: Skyvue Memorial Gardens (1), Calvary Cemetery (2), Grimsley Cemetery (3), Cope Cemetery (4), Hudson Cemetery (5). Display/hide their locations on the map
Parks in zip code 76063 include: McKnight Park (1), Loyd Park (2), Mansfield City Park (3), Webb Park (4), R L Anderson Stadium (5), Britton Park (6). Display/hide their locations on the map
15,066 married couples with children.
5,008 single-parent households (1,213 men, 3,795 women).
81.5% of residents of 76063 zip code speak English at home.
10.3% of residents speak Spanish at home (71% very well, 18% well, 7% not well, 3% not at all).
2.6% of residents speak other Indo-European language at home (64% very well, 27% well, 9% not well).
2.9% of residents speak Asian or Pacific Island language at home (54% very well, 33% well, 14% not well).
2.8% of residents speak other language at home (72% very well, 11% well, 16% not well, 1% not at all).
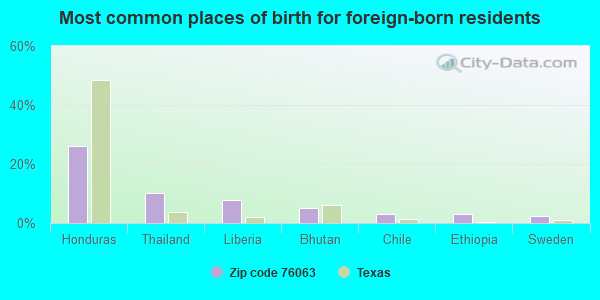
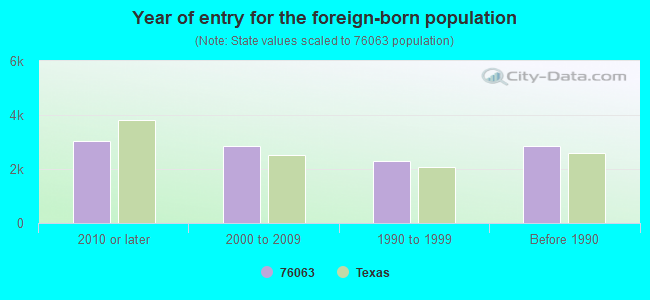
Foreign born population: 9,824 (11.9%) (60.6% of them are naturalized citizens)
Facilities with environmental interests located in this zip code:
ADUCO INTERNATIONAL INC (1500 E DALLAS STREET in MANSFIELD, TX)
(Resource Conservation and Recovery Act (tracking hazardous waste))
AMERICAN CARTON COMPANY (1301A E DALLAS ST in MANSFIELD, TX)
(Resource Conservation and Recovery Act (tracking hazardous waste)) Business NAICS classification: FOLDING PAPERBOARD BOX MANUFACTURING. Organizations: SHELBYDONALD (CONTACT/OPERATOR)
AMERICHEM INC MTX (1300 FT. WORTH ST. in MANSFIELD, TX)
CRITERIA AND HAZARDOUS AIR POLLUTANT INVENTORY (Inventory of air pollution sources) Conditionally Exempt Small Quantity Generators, less than 100 kg/month of hazardous waste (Resource Conservation and Recovery Act (tracking hazardous waste)) TRI REPORTER (Tracking of toxic chemicals releasing facilities) Business SIC classification: CUSTOM COMPOUNDING OF PURCHASED PLASTICS RESINS Business NAICS classification: CUSTOM COMPOUNDING OF PURCHASED RESINS.; ALL OTHER PLASTICS PRODUCT MANUFACTURING. Alternative names: AMERICHEM INC., TEXAS DIV OF AMERICHEM INC
ARMAN MANUFACTURING COMPANY (106 INDUSTRIAL BLVD in MANSFIELD, TX)
(Resource Conservation and Recovery Act (tracking hazardous waste))
AMERICAN CARTON COMPANY (607 S WISTERIA ST in MANSFIELD, TX)
Small Quantity Generators, between 100 kg and 1000 kg of hazardous waste/month (Resource Conservation and Recovery Act (tracking hazardous waste)) - notification Business NAICS classification: FOLDING PAPERBOARD BOX MANUFACTURING. Organizations: HARRISJOE (CONTACT/OPERATOR)
Alternative names: UNIMAST INC
Housing units lacking complete plumbing facilities: 0.3% Housing units lacking complete kitchen facilities: 2.6%
56.7%Electricity
40.3%Utility gas
2.3%Bottled, tank, or LP gas
0.6%No fuel used
Population in 1990: 17,381. Population change in the 1990s: +15,294 (+88.0%).
Place of birth for U.S.-born residents:
This state: 43,687
Northeast: 4,343
Midwest: 7,328
South: 9,956
West: 5,883
45% of the 76063 zip code residents lived in the same house 5 years ago. Out of people who lived in different houses, 56% lived in this county. Out of people who lived in different counties, 50% lived in Texas.
89% of the 76063 zip code residents lived in the same house 1 year ago. Out of people who lived in different houses, 54% moved from this county. Out of people who lived in different houses, 22% moved from different county within same state. Out of people who lived in different houses, 17% moved from different state. Out of people who lived in different houses, 8% moved from abroad.
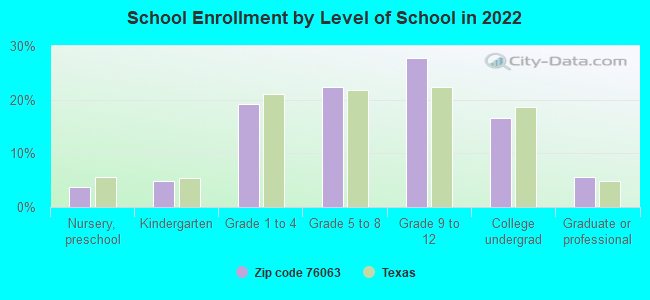
Private vs. public school enrollment:
Students in private schools in grades 1 to 8 (elementary and middle school): 803
Here:
7.8%
Texas:
8.8%
Students in private schools in grades 9 to 12 (high school): 331
Here:
4.8%
Texas:
8.0%
Students in private undergraduate colleges: 905
Here:
21.8%
Texas:
16.2%
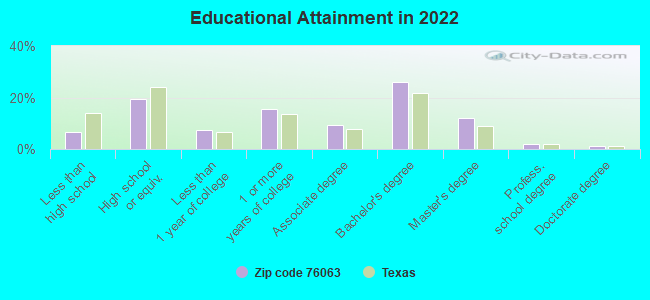
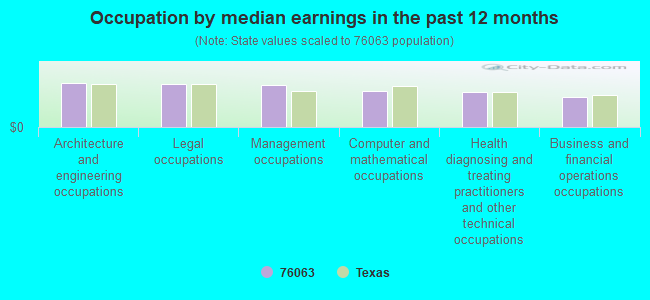
Occupation by median earnings in the past 12 months ($)
106,652Architecture and engineering occupations
104,945Legal occupations
101,877Management occupations
86,736Computer and mathematical occupations
84,550Health diagnosing and treating practitioners and other technical occupations
72,583Business and financial operations occupations
Companies with biggest federal contracts located in this zip code (MANSFIELD, TX):
RODCO-BRANDT (600 S 6TH AVE; small business) 70 employees, $9515292 revenue. Veteran Owned Business: $89,589,255 in 2172 contractsfrom 1999 to 2006
Contracts for Household Furniture, Cabinets, Lockers, Bins, and Shelving, Office Furniture, Household Furnishings, and moreby Army, Air Force, Federal Supply Service, Navy, and others Signed by year:2000: $10,869,381; 2001: $9,180,002; 2002: $12,047,913; 2003: $8,999,535; 2004: $17,582,125; 2005: $18,770,027; 2006: $12,112,132.
Biggest contracts:
$2,154,765 with Army for Household Furniture. Signed on 2005-01-13. Completion date: 2005-02-15.
$1,466,948 with Army for Cabinets, Lockers, Bins, and Shelving. Taking place in WA. Signed on 2004-09-30. Completion date: 2005-01-31.
$1,171,845 with Air Force for Household Furniture. Taking place in AL. Signed on 2003-09-30. Completion date: 2003-01-15.
$1,127,062 with Army for Cabinets, Lockers, Bins, and Shelving. Taking place in VA. Signed on 2001-08-14. Completion date: 2002-06-30.
RELIANCE COATED FABRICS, INC (950 SOUTH 6TH AVENUE; small business) : $48,914,054 in 38 contractsfrom 1999 to 2005
Contracts for Storage Tanks by Army, Air Force Signed by year:2000: $244,604; 2001: $29,405,409; 2002: $3,152,535; 2003: $11,216,867; 2004: $3,312,580; 2005: $1,273,359; 2006: $0.
Biggest contracts:
$8,423,094 with Army for Storage Tanks. Signed on 2001-11-09. Completion date: 2002-04-03.
$5,185,289, same as above.Signed on 2001-09-26. Completion date: 2005-01-30.
$4,936,000, same as above.Signed on 2001-10-15. Completion date: 2002-02-19.
$3,657,500, same as above.Signed on 2003-08-26. Completion date: 2004-08-19.
RELIANCE AEROPRODUCTS INT L IN (950 SOUTH 6TH AVENUE; small business) : $31,607,692 in 433 contractsfrom 1999 to 2006
Contracts for Hose, Pipe, Tube, Lubrication, and Railing Fittings, Storage Tanks, Maintenance, Repair and Rebuilding of Equipment -- Aircraft and Airframe Structural Components, Airframe Structural Components, and moreby Navy, Defense Logistics Agency, Army, Air Force, and others Signed by year:2000: $6,051,002; 2001: $6,653,327; 2002: $5,984,390; 2003: $3,965,940; 2004: $2,468,573; 2005: $5,370,447; 2006: $1,077,862.
Biggest contracts:
$3,325,560 with Navy for Hose, Pipe, Tube, Lubrication, and Railing Fittings. Signed on 2001-02-02. Completion date: 2002-09-30.
$2,984,688 with Defense Logistics Agency for Storage Tanks. Signed on 2005-07-28. Completion date: 2005-10-26.
$1,973,232, same as above.Signed on 2003-12-19. Completion date: 2004-02-27.
$1,955,033 with Navy for Storage Tanks. Signed on 2004-03-11. Completion date: 2003-09-30.
KENT ASSOCIATES INC (550 EASY DR; small business) : $7,423,425 in 371 contractsfrom 1999 to 2006
Contracts for Airframe Structural Components, Hardware, Commercial, Gas Turbines and Jet Engines, Aircraft; Prime Moving, and Components, Engine Fuel System Components, Aircraft and Missile Prime Movers, and moreby Defense Logistics Agency, Air Force, Army Signed by year:2000: $827,234; 2001: $1,102,800; 2002: $1,337,571; 2003: $107,061; 2004: $875,617; 2005: $2,153,145; 2006: $630,747.
Biggest contracts:
$453,390 with Defense Logistics Agency for Airframe Structural Components. Signed on 2002-07-12. Completion date: 2003-01-18.
$347,580, same as above.Signed on 1999-11-24. Completion date: 2000-06-21.
$327,515 with Air Force for Airframe Structural Components. Signed on 2005-07-05. Completion date: 2007-02-16.
$275,475 with Defense Logistics Agency for Airframe Structural Components. Signed on 2001-11-09. Completion date: 2002-12-30.
RHIMCO INDUSTRIES INC (4150 BRITTON ROAD; small business) : $4,272,793 in 165 contractsfrom 1999 to 2006
Contracts for Electrical Hardware and Supplies, Indoor and Outdoor Electric Lighting Fixtures, Electric Portable and Hand Lighting Equipment, Miscellaneous Electric Power and Distribution Equipment, and moreby Defense Logistics Agency, Army, Bureau of Prisoners/Federal Prison System, Navy, and others Signed by year:2000: $235,000; 2001: $336,000; 2002: $361,069; 2003: $258,433; 2004: $547,945; 2005: $273,163; 2006: $2,239,183.
Biggest contracts:
$158,833 with Defense Logistics Agency for Electrical Hardware and Supplies. Signed on 2006-02-07. Completion date: 2006-06-07.
$158,832, same as above.Signed on 2006-02-06. Completion date: 2006-06-03.
$100,000 with Army for Indoor and Outdoor Electric Lighting Fixtures. Signed on 2006-02-02. Completion date: 2006-04-28.
$100,000, same as above.Signed on 2006-02-14. Completion date: 2006-02-08.
DIAL SUPPLY & MFG INC (1315 FM 1187 #106; small business) : $3,429,905 in 318 contractsfrom 2001 to 2006
Contracts for Coil, Flat, Leaf, and Wire Springs, Fastening Device, Miscellaneous Power Transmission Equipment, Hardware, Commercial, and moreby Defense Logistics Agency, Bureau of Prisoners/Federal Prison System, Navy Signed by year:2000: $0; 2001: $75,500; 2002: $116,775; 2003: $92,540; 2004: $926,170; 2005: $1,649,398; 2006: $569,522.
Biggest contracts:
$97,375 with Defense Logistics Agency for Coil, Flat, Leaf, and Wire Springs. Signed on 2004-08-16. Completion date: 2005-02-09.
$81,000 with Defense Logistics Agency for Fastening Device. Signed on 2002-01-28. Completion date: 2002-06-14.
$76,316 with Defense Logistics Agency for Miscellaneous Power Transmission Equipment. Signed on 2006-01-11. Completion date: 2006-09-28.
$73,652 with Defense Logistics Agency for Coil, Flat, Leaf, and Wire Springs. Signed on 2005-06-28. Completion date: 2006-02-13.
ORBITAL PARTS, INC (615 S 4TH AVE; small business) : $1,957,086 in 135 contractsfrom 2000 to 2006
Contracts for Gas Turbines and Jet Engines, Aircraft; Prime Moving, and Components, Miscellaneous Items, Airframe Structural Components, Circuit Breakers, and moreby Defense Logistics Agency, Navy, Air Force, Army, and others Signed by year:2000: $222,473; 2001: $39,532; 2002: $99,940; 2003: $296,650; 2004: $524,357; 2005: $447,913; 2006: $326,221.
Biggest contracts:
$166,257 with Defense Logistics Agency for Gas Turbines and Jet Engines, Aircraft; Prime Moving, and Components. Signed on 2004-01-23. Completion date: 2004-02-22.
$119,700 with Navy for Miscellaneous Items. Taking place in MI. Signed on 2003-02-21. Completion date: 2003-05-21.
$99,585 with Defense Logistics Agency for Airframe Structural Components. Signed on 2000-08-17. Completion date: 2000-09-16.
$75,000 with Air Force for Airframe Structural Components. Signed on 2003-08-01. Completion date: 2003-08-29.
BENSON, TRACI (1315 FM1187 #108; small business) : $534,051 in 67 contractsfrom 2004 to 2006
Contracts for Packing and Gasket Materials, Hardware, Commercial, Screws, Bushings, Rings, Shims, and Spacers, and moreby Defense Logistics Agency Signed by year:2000: $0; 2001: $0; 2002: $0; 2003: $0; 2004: $29,361; 2005: $455,398; 2006: $49,292.
Biggest contracts:
$27,738 with Defense Logistics Agency for Packing and Gasket Materials. Signed on 2005-03-31. Completion date: 2005-10-07.
$26,775 with Defense Logistics Agency for Hardware, Commercial. Signed on 2005-01-01. Completion date: 2005-07-10.
$25,404 with Defense Logistics Agency for Packing and Gasket Materials. Signed on 2005-03-02. Completion date: 2005-09-08.
$24,609 with Defense Logistics Agency for Screws. Signed on 2005-10-07. Completion date: 2006-05-15.
L TECHNOLOGIES CORPORATION (1640 NEWCASTLE DR; small business) : $523,772 in 29 contractsfrom 2003 to 2006
Contracts for Miscellaneous Fire Control Equipment, Electric Vehicular Lights and Fixtures, Indoor and Outdoor Electric Lighting Fixtures, Electric Portable and Hand Lighting Equipment, and moreby Defense Logistics Agency, Army Signed by year:2000: $0; 2001: $0; 2002: $0; 2003: $82,239; 2004: $116,221; 2005: $276,358; 2006: $48,954.
Biggest contracts:
$99,989 with Defense Logistics Agency for Miscellaneous Fire Control Equipment. Signed on 2004-02-02. Completion date: 2004-03-20.
$87,600 with Defense Logistics Agency for Electric Vehicular Lights and Fixtures. Signed on 2005-06-11. Completion date: 2005-10-11.
$68,923, same as above.Signed on 2005-02-06. Completion date: 2005-05-07.
$47,150, same as above.Signed on 2003-10-15. Completion date: 2003-11-19.
CHEMGUARD INC (204 S 6TH AVE; small business) : $116,028 in 10 contractsfrom 2002 to 2006
Contracts for Fire Fighting Equipment, Safety and Rescue Equipment, Chain and Wire Rope, Hazardous Material Spill Containment and Clean-up Equipment and Material by Air Force, Navy, Army Signed by year:2000: $0; 2001: $0; 2002: $3,584; 2003: $52,056; 2004: $9,221; 2005: $29,983; 2006: $21,184.
Biggest contracts:
$43,150 with Air Force for Fire Fighting Equipment. Signed on 2003-03-10. Completion date: 2003-03-31.
$21,184 with Navy for Fire Fighting Equipment. Signed on 2006-06-22. Completion date: 2006-07-27.
$13,299, same as above.Signed on 2005-08-03. Completion date: 2005-08-12.
$8,705, same as above.Signed on 2005-08-04. Completion date: 2005-08-12.
Top industries in this zip code by the number of employees in 2005:
2002 - 2018 National Fire Incident Reporting System (NFIRS) incidents
According to the data from the years 2002 - 2018 the average number of fire incidents per year is 189. The highest number of reported fires - 297 took place in 2011, and the least - 146 in 2003. The data has a rising trend.
When looking into fire subcategories, the most incidents belonged to: Outside Fires (48.4%), and Structure Fires (29.8%).
Fire incident types reported to NFIRS in Zip Code 76063


 Nearest zip codes: 76001, 76002, 76061, 76017, 76060, 76018.
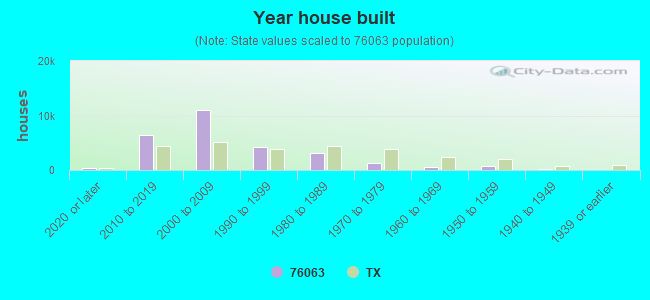


 According to the data from the years 2002 - 2018 the average number of fire incidents per year is 189. The highest number of reported fires - 297 took place in 2011, and the least - 146 in 2003. The data has a rising trend.
 When looking into fire subcategories, the most incidents belonged to: Outside Fires (48.4%), and Structure Fires (29.8%).