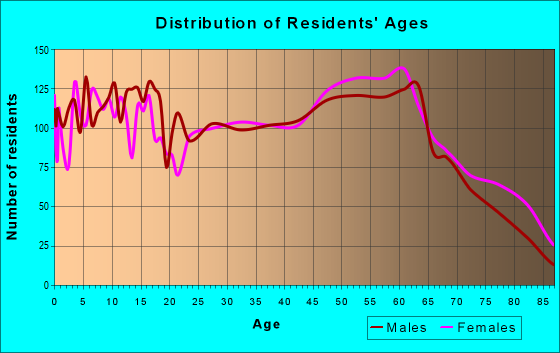
Estimated zip code population in 2022: 17,084 Zip code population in 2010: 17,097 Zip code population in 2000: 16,722
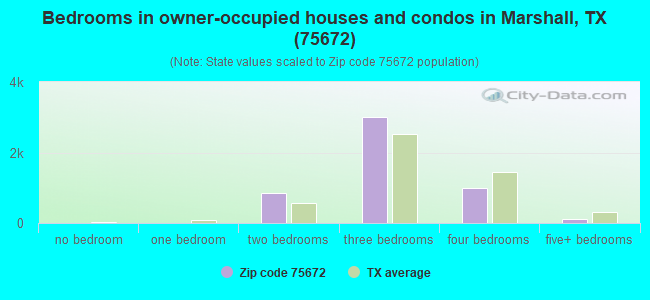
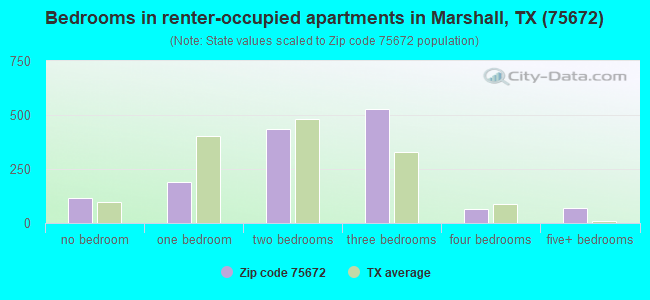
Houses and condos: 7,488 Renter-occupied apartments: 1,411
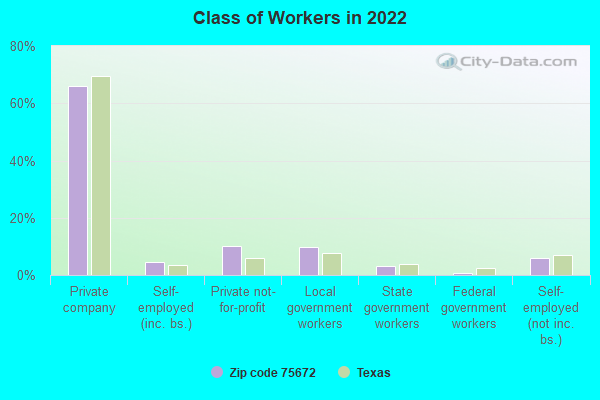
% of renters here:
22%
State:
38%
March 2022 cost of living index in zip code 75672: 78.7 (low, U.S. average is 100)
Land area: 237.3 sq. mi. Water area: 0.7 sq. mi.
Population density: 72 people per square mile
(very low).
OSM Map
General Map
Google Map
MSN Map
OSM Map
General Map
Google Map
MSN Map
OSM Map
General Map
Google Map
MSN Map
OSM Map
General Map
Google Map
MSN Map
Please wait while loading the map...
Real estate property taxes paid for housing units in 2022:
This zip code:
1.0% ($1,961)
Texas:
1.5% ($4,050)
Median real estate property taxes paid for housing units with mortgages in 2022: $2,313 (1.0%) Median real estate property taxes paid for housing units with no mortgage in 2022: $1,627 (0.9%)
Averages for the 2020 tax year for zip code 75672, filed in 2021:
Average Adjusted Gross Income (AGI) in 2020: $58,775 (Individual Income Tax Returns)
Here:
$58,775
State:
$77,054
Salary/wage: $49,718 (reported on 81.3% of returns)
Here:
$49,718
State:
$62,766
(% of AGI for various income ranges: 1256.1% for AGIs below $25k, 3646.9% for AGIs $25k-50k, 6409.1% for AGIs $50k-75k, 9188.4% for AGIs $75k-100k, 15709.2% for AGIs $100k-200k, 65063.3% for AGIs over 200k)
Taxable interest for individuals: $1,832 (reported on 28.1% of returns)
This zip code:
$1,832
Texas:
$2,665
(% of AGI for various income ranges: 12.3% for AGIs below $25k, 23.5% for AGIs $25k-50k, 56.7% for AGIs $50k-75k, 46.6% for AGIs $75k-100k, 145.5% for AGIs $100k-200k, 2905.0% for AGIs over 200k)
Ordinary dividends: $8,940 (reported on 14.7% of returns)
Here:
$8,940
State:
$10,044
(% of AGI for various income ranges: 24.3% for AGIs below $25k, 35.6% for AGIs $25k-50k, 142.8% for AGIs $50k-75k, 153.2% for AGIs $75k-100k, 385.7% for AGIs $100k-200k, 7896.7% for AGIs over 200k)
Net capital gain/loss in AGI: +$15,263 (reported on 13.9% of returns)
Here:
+$15,263
State:
+$39,590
(% of AGI for various income ranges: 5.4% for AGIs below $25k, 24.2% for AGIs $25k-50k, 89.7% for AGIs $50k-75k, 152.2% for AGIs $75k-100k, 425.8% for AGIs $100k-200k, 18981.7% for AGIs over 200k)
Profit/loss from business: +$6,399 (reported on 19.6% of returns)
Here:
+$6,399
State:
+$10,888
(% of AGI for various income ranges: 56.3% for AGIs below $25k, 71.0% for AGIs $25k-50k, 80.3% for AGIs $50k-75k, 190.4% for AGIs $75k-100k, 451.5% for AGIs $100k-200k, 5185.0% for AGIs over 200k)
Taxable individual retirement arrangement distribution: $18,352 (reported on 9.1% of returns)
75672:
$18,352
Texas:
$24,740
(% of AGI for various income ranges: 41.4% for AGIs below $25k, 79.7% for AGIs $25k-50k, 240.4% for AGIs $50k-75k, 415.6% for AGIs $75k-100k, 897.2% for AGIs $100k-200k, 2688.3% for AGIs over 200k)
Total itemized deductions: $34,974 (reported on 5.2% of returns)
Here:
$34,974
State:
$40,428
(% of AGI for various income ranges: 43.8% for AGIs below $25k, 93.9% for AGIs $25k-50k, 297.4% for AGIs $50k-75k, 422.6% for AGIs $75k-100k, 634.2% for AGIs $100k-200k, 5443.3% for AGIs over 200k)
Charity contributions: $14,636 (reported on 3.8% of returns)
Here:
$14,636
State:
$18,201
(% of AGI for various income ranges: 17.4% for AGIs $25k-50k, 61.9% for AGIs $50k-75k, 116.8% for AGIs $75k-100k, 239.4% for AGIs $100k-200k, 2506.7% for AGIs over 200k)
Taxes paid: $5,467 (reported on 4.9% of returns)
75672:
$5,467
State:
$7,821
(% of AGI for various income ranges: 3.5% for AGIs below $25k, 11.6% for AGIs $25k-50k, 31.7% for AGIs $50k-75k, 70.6% for AGIs $75k-100k, 113.2% for AGIs $100k-200k, 883.3% for AGIs over 200k)
Earned income credit: $2,515 (reported on 19.5% of returns)
Here:
$2,515
State:
$2,584
(% of AGI for various income ranges: 124.5% for AGIs below $25k, 80.4% for AGIs $25k-50k, 2.1% for AGIs $50k-75k)
Percentage of individuals using paid preparers for their 2020 taxes: 93.5%
Here:
93%
State:
92%
(% for various income ranges: 92.3% for AGIs below $25k, 94.2% for AGIs $25k-50k, 93.4% for AGIs $50k-75k, 94.2% for AGIs $75k-100k, 94.3% for AGIs $100k-200k, 95.5% for AGIs over 200k)
Averages for the 2012 tax year for zip code 75672, filed in 2013:
Average Adjusted Gross Income (AGI) in 2012: $55,145 (Individual Income Tax Returns)
Here:
$55,145
State:
$65,384
Salary/wage: $46,515 (reported on 83.2% of returns)
Here:
$46,515
State:
$52,524
(% of AGI for various income ranges: 77.9% for AGIs below $25k, 77.6% for AGIs $25k-50k, 75.0% for AGIs $50k-75k, 77.1% for AGIs $75k-100k, 73.2% for AGIs $100k-200k, 46.1% for AGIs over 200k)
Taxable interest for individuals: $1,892 (reported on 31.0% of returns)
This zip code:
$1,892
Texas:
$2,372
(% of AGI for various income ranges: 1.2% for AGIs below $25k, 0.7% for AGIs $25k-50k, 0.8% for AGIs $50k-75k, 0.8% for AGIs $75k-100k, 0.8% for AGIs $100k-200k, 2.0% for AGIs over 200k)
Ordinary dividends: $6,194 (reported on 17.3% of returns)
Here:
$6,194
State:
$9,721
(% of AGI for various income ranges: 1.5% for AGIs below $25k, 1.0% for AGIs $25k-50k, 1.4% for AGIs $50k-75k, 1.3% for AGIs $75k-100k, 1.7% for AGIs $100k-200k, 4.3% for AGIs over 200k)
Net capital gain/loss in AGI: +$13,498 (reported on 13.8% of returns)
Here:
+$13,498
State:
+$35,319
(% of AGI for various income ranges: 0.1% for AGIs $25k-50k, 0.5% for AGIs $50k-75k, 0.6% for AGIs $75k-100k, 1.2% for AGIs $100k-200k, 15.4% for AGIs over 200k)
Profit/loss from business: +$10,139 (reported on 17.6% of returns)
Here:
+$10,139
State:
+$13,732
(% of AGI for various income ranges: 4.2% for AGIs below $25k, 2.5% for AGIs $25k-50k, 2.1% for AGIs $50k-75k, 2.3% for AGIs $75k-100k, 4.0% for AGIs $100k-200k, 4.3% for AGIs over 200k)
Taxable individual retirement arrangement distribution: $14,830 (reported on 10.2% of returns)
75672:
$14,830
Texas:
$19,511
(% of AGI for various income ranges: 2.4% for AGIs below $25k, 2.4% for AGIs $25k-50k, 3.0% for AGIs $50k-75k, 3.1% for AGIs $75k-100k, 2.9% for AGIs $100k-200k, 2.6% for AGIs over 200k)
Self-employment retirement plans: $15,333 (reported on 0.4% of returns)
75672:
$15,333
Texas:
$23,938
Total itemized deductions: $22,008 (20% of AGI, reported on 22.4% of returns)
Here:
$22,008
State:
$24,724
Here:
20.4% of AGI
State:
15.9% of AGI
(% of AGI for various income ranges: 6.3% for AGIs below $25k, 8.5% for AGIs $25k-50k, 9.5% for AGIs $50k-75k, 9.2% for AGIs $75k-100k, 9.5% for AGIs $100k-200k, 9.1% for AGIs over 200k)
Charity contributions: $6,950 (reported on 17.6% of returns)
Here:
$6,950
State:
$6,808
(% of AGI for various income ranges: 0.8% for AGIs below $25k, 1.6% for AGIs $25k-50k, 2.2% for AGIs $50k-75k, 2.0% for AGIs $75k-100k, 2.6% for AGIs $100k-200k, 3.1% for AGIs over 200k)
Taxes paid: $4,021 (reported on 22.0% of returns)
75672:
$4,021
State:
$6,921
(% of AGI for various income ranges: 0.8% for AGIs below $25k, 1.3% for AGIs $25k-50k, 1.5% for AGIs $50k-75k, 1.6% for AGIs $75k-100k, 2.0% for AGIs $100k-200k, 1.8% for AGIs over 200k)
Earned income credit: $2,409 (reported on 20.4% of returns)
Here:
$2,409
State:
$2,570
(% of AGI for various income ranges: 8.0% for AGIs below $25k, 1.1% for AGIs $25k-50k)
Percentage of individuals using paid preparers for their 2012 taxes: 63.4%
Here:
63%
State:
51%
(% for various income ranges: 60.8% for AGIs below $25k, 62.1% for AGIs $25k-50k, 65.7% for AGIs $50k-75k, 62.7% for AGIs $75k-100k, 67.6% for AGIs $100k-200k, 88.2% for AGIs over 200k)
Averages for the 2004 tax year for zip code 75672, filed in 2005:
Average Adjusted Gross Income (AGI) in 2004: $43,392 (Individual Income Tax Returns)
Here:
$43,392
State:
$47,881
Salary/wage: $36,710 (reported on 83.9% of returns)
Here:
$36,710
State:
$41,947
(% of AGI for various income ranges: 183.4% for AGIs below $10k, 76.4% for AGIs $10k-25k, 81.8% for AGIs $25k-50k, 77.1% for AGIs $50k-75k, 76.1% for AGIs $75k-100k, 52.4% for AGIs over 100k)
Taxable interest for individuals: $2,047 (reported on 37.3% of returns)
This zip code:
$2,047
Texas:
$2,255
(% of AGI for various income ranges: 7.2% for AGIs below $10k, 2.5% for AGIs $10k-25k, 1.6% for AGIs $25k-50k, 1.7% for AGIs $50k-75k, 1.8% for AGIs $75k-100k, 1.4% for AGIs over 100k)
Taxable dividends: $3,125 (reported on 20.4% of returns)
Here:
$3,125
State:
$4,261
(% of AGI for various income ranges: 4.1% for AGIs below $10k, 1.1% for AGIs $10k-25k, 0.9% for AGIs $25k-50k, 1.0% for AGIs $50k-75k, 1.2% for AGIs $75k-100k, 2.2% for AGIs over 100k)
Net capital gain/loss: +$9,579 (reported on 17.1% of returns)
Here:
+$9,579
State:
+$16,110
(% of AGI for various income ranges: -2.0% for AGIs below $10k, 0.3% for AGIs $10k-25k, 0.4% for AGIs $25k-50k, 1.0% for AGIs $50k-75k, 1.7% for AGIs $75k-100k, 9.8% for AGIs over 100k)
Profit/loss from business: +$11,975 (reported on 16.9% of returns)
Here:
+$11,975
State:
+$11,013
(% of AGI for various income ranges: 5.0% for AGIs below $10k, 4.5% for AGIs $10k-25k, 2.9% for AGIs $25k-50k, 2.9% for AGIs $50k-75k, 3.4% for AGIs $75k-100k, 7.4% for AGIs over 100k)
IRA payment deduction: $3,379 (reported on 2.3% of returns)
75672:
$3,379
Texas:
$3,120
(% of AGI for various income ranges: 0.2% for AGIs $10k-25k, 0.2% for AGIs $25k-50k, 0.2% for AGIs $50k-75k, 0.2% for AGIs $75k-100k, 0.1% for AGIs over 100k)
Self-employed pension: $16,209 (reported on 0.7% of returns)
Here:
$16,209
Texas:
$16,401
Total itemized deductions: $16,680 (19% of AGI, reported on 20.2% of returns)
Here:
$16,680
State:
$19,631
Here:
18.7% of AGI
State:
18.9% of AGI
(% of AGI for various income ranges: 11.1% for AGIs below $10k, 5.9% for AGIs $10k-25k, 7.9% for AGIs $25k-50k, 8.3% for AGIs $50k-75k, 9.7% for AGIs $75k-100k, 7.0% for AGIs over 100k)
Charity contributions deductions: $5,045 (5% of AGI, reported on 17.2% of returns)
Here:
$5,045
State:
$4,753
Here:
5.4% of AGI
State:
4.2% of AGI
(% of AGI for various income ranges: 0.9% for AGIs below $10k, 1.0% for AGIs $10k-25k, 1.5% for AGIs $25k-50k, 2.0% for AGIs $50k-75k, 2.6% for AGIs $75k-100k, 2.3% for AGIs over 100k)
Total tax: $7,340 (reported on 70.8% of returns)
75672:
$7,340
State:
$9,058
(% of AGI for various income ranges: 4.2% for AGIs below $10k, 3.4% for AGIs $10k-25k, 6.1% for AGIs $25k-50k, 8.9% for AGIs $50k-75k, 11.3% for AGIs $75k-100k, 20.7% for AGIs over 100k)
Earned income credit: $1,784 (reported on 20.3% of returns)
Here:
$1,784
State:
$2,024
Percentage of individuals using paid preparers for their 2004 taxes: 63.7%
Here:
64%
State:
57%
(% for various income ranges: 54.6% for AGIs below $10k, 66.7% for AGIs $10k-25k, 63.4% for AGIs $25k-50k, 64.8% for AGIs $50k-75k, 66.7% for AGIs $75k-100k, 74.0% for AGIs over 100k)
Household received Food Stamps/SNAP in the past 12 months: 786 Household did not receive Food Stamps/SNAP in the past 12 months: 5,631
Women who had a birth in the past 12 months: 133 (35 now married, 94 unmarried) Women who did not have a birth in the past 12 months: 3,591 (1,438 now married, 2,157 unmarried)
Housing units in zip code 75672 with a mortgage: 2,105 (25 second mortgage, 24 both second mortgage and home equity loan) Houses without a mortgage: 25
Median monthly owner costs for units with a mortgage: $1,413 Median monthly owner costs for units without a mortgage: $530
Residents with income below the poverty level in 2022:
This zip code:
13.6%
Whole state:
14.0%
Residents with income below 50% of the poverty level in 2022:
This zip code:
7.4%
Whole state:
7.4%
Median number of rooms in houses and condos:
Here:
6.1
State:
6.3
Median number of rooms in apartments:
Here:
4.7
State:
4.0
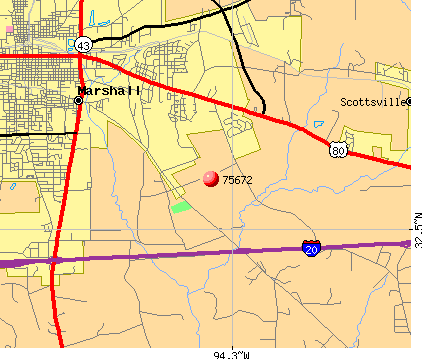
Notable locations in this zip code not listed on our city pages
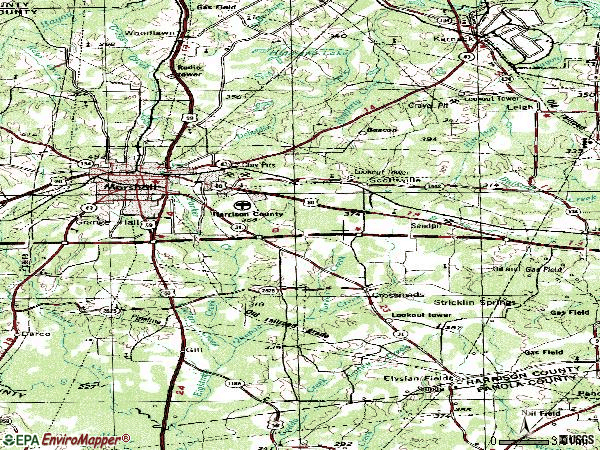
Notable locations in zip code 75672: Boards Ferry (A), Harrison County Historial Museum (B), Scottsville Volunteer Fire Department (C), Harrison County Emergency Services District 4 Station 1 (D), Blocker Crossroads Volunteer Fire Department (E), Marshall Fire Department Station 2 (F), Marshall Fire Department Station 4 (G), Shadowwood Volunteer Fire Department (H), Texas Forest Service Marshall Office (I). Display/hide their locations on the map
Churches in zip code 75672 include: Port Caddo Church (A), Shady Grove Church (B), Saint Paul Church (C), Paradise Church (D), Union Church (E), Mount Olive Number 2 Church (F), Mount Olive Number 1 Church (G), Starlight Church (H), Sunset Church (I). Display/hide their locations on the map
Cemeteries: Algoma Cemetery (1), Minneweather Cemetery (2), Wiley College Cemetery (3), Mount Prospect Cemetery (4), Scott Cemetery (5), Long Ridge Cemetery (6), Woodley Cemetery (7). Display/hide their locations on the map
Lakes and reservoirs: Long Slough (A), Round Lake (B), Highland Lake (C), Fern Lake (D), Bonita Lake (E), Marshall Lakeside Country Club Lake (F), C Ranch Lake (G), Lake Shadowood Reservoir (H). Display/hide their locations on the map
Streams, rivers, and creeks: Turkey Creek (A), Starkey Creek (B), Quapaw Creek (C), Potters Creek (D), Parker Creek (E), Taylor Branch (F), Eightmile Creek (G), Colliers Creek (H), Roseborough Creek (I). Display/hide their locations on the map
In group quarters: 277 (-1 institutionalized population)
Size of family households: 2,337 2-persons, 787 3-persons, 940 4-persons, 277 5-persons, 88 6-persons, 111 7-or-more-persons
Size of nonfamily households: 1,686 1-person, 193 2-persons, 2 3-persons
2,264 married couples with children.
1,023 single-parent households (233 men, 790 women).
89.0% of residents of 75672 zip code speak English at home.
9.6% of residents speak Spanish at home (68% very well, 14% well, 15% not well, 3% not at all).
0.4% of residents speak other Indo-European language at home (74% very well, 26% not well).
0.4% of residents speak Asian or Pacific Island language at home (63% very well, 15% well, 15% not well, 7% not at all).
0.5% of residents speak other language at home (100% very well).
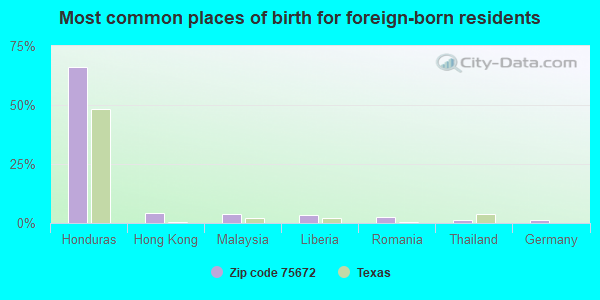
Foreign born population: 955 (5.6%) (56.0% of them are naturalized citizens)
This zip code:
5.6%
Whole state:
17.2%
66%Honduras
4%Hong Kong
4%Malaysia
3%Liberia
2%Romania
1%Thailand
1%Germany
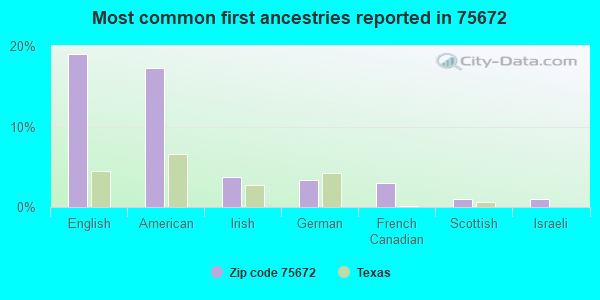
19%English
17%American
4%Irish
3%German
3%French Canadian
1%Scottish
1%Israeli
Year of entry for the foreign-born population
3232010 or later
4062000 to 2009
2311990 to 1999
221Before 1990
Housing units lacking complete plumbing facilities: 2.8% Housing units lacking complete kitchen facilities: 3.6%
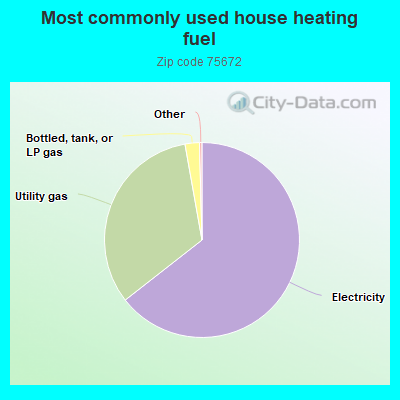
64.5%Electricity
32.8%Utility gas
2.4%Bottled, tank, or LP gas
Place of birth for U.S.-born residents:
This state: 10,626
Northeast: 313
Midwest: 766
South: 3,132
West: 1,028
65% of the 75672 zip code residents lived in the same house 5 years ago. Out of people who lived in different houses, 59% lived in this county. Out of people who lived in different counties, 50% lived in Texas.
91% of the 75672 zip code residents lived in the same house 1 year ago. Out of people who lived in different houses, 32% moved from this county. Out of people who lived in different houses, 52% moved from different county within same state. Out of people who lived in different houses, 18% moved from different state. Out of people who lived in different houses, 2% moved from abroad.
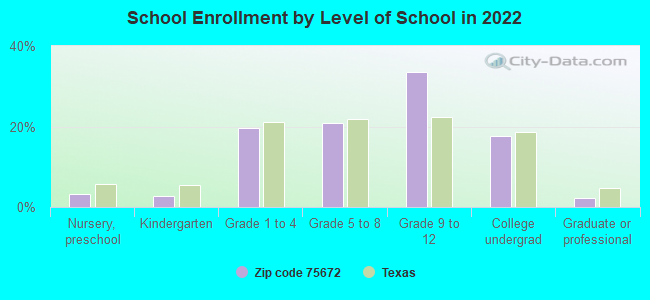
Private vs. public school enrollment:
Students in private schools in grades 1 to 8 (elementary and middle school): 286
Here:
18.3%
Texas:
8.8%
Students in private schools in grades 9 to 12 (high school): 38
Here:
3.0%
Texas:
8.0%
Students in private undergraduate colleges: 255
Here:
38.2%
Texas:
16.2%
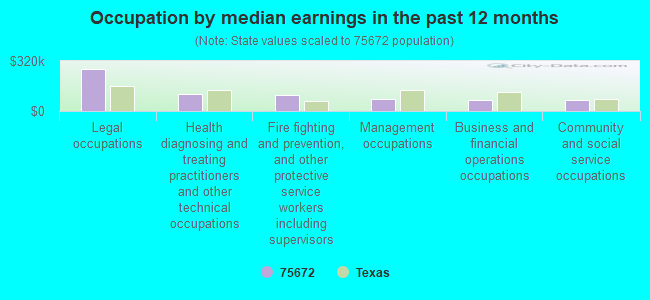
Occupation by median earnings in the past 12 months ($)
269,524Legal occupations
110,427Health diagnosing and treating practitioners and other technical occupations
100,855Fire fighting and prevention, and other protective service workers including supervisors
76,177Management occupations
72,449Business and financial operations occupations
70,360Community and social service occupations
Companies with federal contracts located in this zip code:
TECHNICAL CONSULTANTS, INC (107 ASHWOOD TERRACE in MARSHALL, TX; small business) : $1,242,725 in 7 contractsfrom 2002 to 2005
Contracts for Pyrotechnics, Technology Studies, Technical Assistance, Equipment and Materials Testing -- Weapons, and moreby Navy, Army, Air Force Signed by year:2000: $0; 2001: $0; 2002: $2,780; 2003: $252,107; 2004: -$5,606; 2005: $993,444; 2006: $0.
Biggest contracts:
$993,444 with Navy for Pyrotechnics. Taking place in LA. Signed on 2005-03-01. Completion date: 2006-02-28.
$125,000 with Army for Technology Studies. Signed on 2003-07-03. Completion date: 2004-05-20.
$89,300 with Army for Technical Assistance. Taking place in AR. Signed on 2003-05-21. Completion date: 2002-12-12.
$22,207 with Air Force for Equipment and Materials Testing -- Weapons. Signed on 2003-04-08. Completion date: 2003-07-17.
SCOTT'S MECHANICAL SERVICE, IN (6723 US HIGHWAY 59 S in MARSHALL, TX; small business) : $20,750 in 3 contractsfrom 2005 to 2006
$9,890 with Army for Hazardous Substance Removal, Cleanup, and Disposal Services and Operational Support. Signed on 2006-02-28. Completion date: 2006-03-17.
$7,190, same as above.Signed on 2006-03-28. Completion date: 2006-03-17.
$3,670 with Army for Other Environmental Services, Studies, and Analytical Support. Signed on 2005-09-27. Completion date: 2005-09-30.
GRAVES, BONNIE (3510 POPLAR ST in MARSHALL, TX; small business)
$6,310 with Army for Recreation Site Maintenance Services (non-construction). Signed on 2006-03-29. Completion date: 2006-04-01.
Top industries in this zip code by the number of employees in 2005:
2002 - 2018 National Fire Incident Reporting System (NFIRS) incidents
Based on the data from the years 2002 - 2018 the average number of fires per year is 31. The highest number of reported fires - 73 took place in 2005, and the least - 2 in 2010. The data has a declining trend.
When looking into fire subcategories, the most incidents belonged to: Outside Fires (61.7%), and Mobile Property/Vehicle Fires (18.1%).
Fire incident types reported to NFIRS in Zip Code 75672
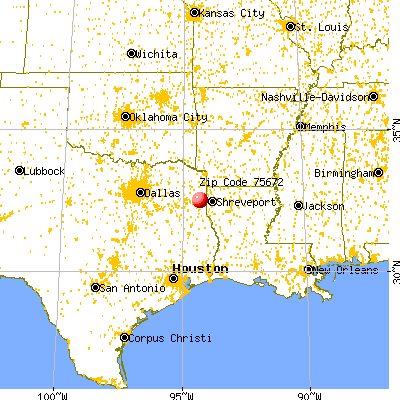


 Nearest zip codes: 75642, 75670, 75692, 75661, 75639, 75650.
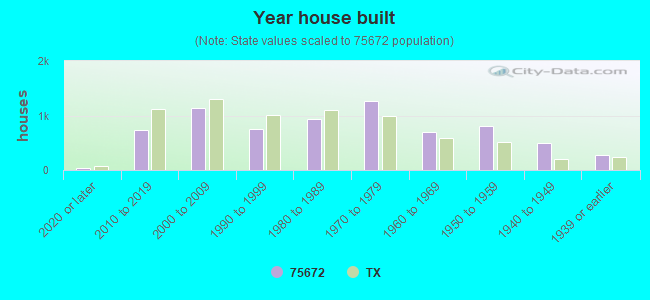


 : $1,242,725 in 7 contracts from 2002 to 2005

 Based on the data from the years 2002 - 2018 the average number of fires per year is 31. The highest number of reported fires - 73 took place in 2005, and the least - 2 in 2010. The data has a declining trend.
 When looking into fire subcategories, the most incidents belonged to: Outside Fires (61.7%), and Mobile Property/Vehicle Fires (18.1%).