Estimated zip code population in 2022: 6,016 Zip code population in 2010: 4,606 Zip code population in 2000: 3,440
Houses and condos: 2,152 Renter-occupied apartments: 416
% of renters here:
21%
State:
38%
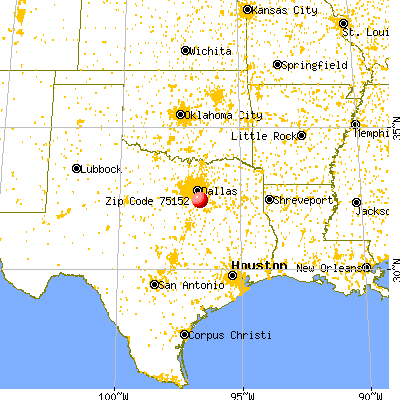
March 2022 cost of living index in zip code 75152: 85.1 (less than average, U.S. average is 100)
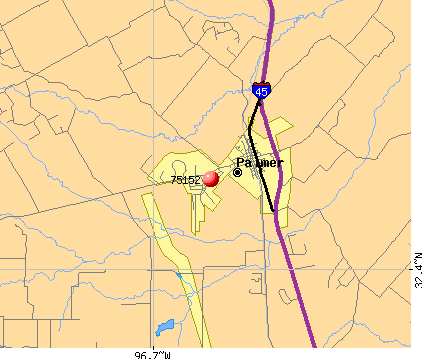
Land area: 40.7 sq. mi. Water area: 0.3 sq. mi.
Population density: 148 people per square mile
(very low).
OSM Map
General Map
Google Map
MSN Map
OSM Map
General Map
Google Map
MSN Map
OSM Map
General Map
Google Map
MSN Map
OSM Map
General Map
Google Map
MSN Map
Please wait while loading the map...
Real estate property taxes paid for housing units in 2022:
This zip code:
1.5% ($2,693)
Texas:
1.5% ($4,050)
Median real estate property taxes paid for housing units with mortgages in 2022: $3,139 (1.7%) Median real estate property taxes paid for housing units with no mortgage in 2022: $1,400 (0.8%)
Estimated median house/condo value in 2022: $181,556
75152:
$181,556
Texas:
$275,400
According to our research of Texas and other state lists, there were 13 registered sex offenders living in 75152 zip code as of June 08, 2024. The ratio of all residents to sex offenders in zip code 75152 is 412 to 1. The ratio of registered sex offenders to all residents in this zip code is near the state average.
Median resident age:
This zip code:
35.6 years
Texas median age:
35.6 years
Average household size:
This zip code:
3.0 people
Texas:
2.6 people
Averages for the 2020 tax year for zip code 75152, filed in 2021:
Average Adjusted Gross Income (AGI) in 2020: $58,601 (Individual Income Tax Returns)
Here:
$58,601
State:
$77,054
Salary/wage: $53,406 (reported on 85.5% of returns)
Here:
$53,406
State:
$62,766
(% of AGI for various income ranges: 1222.0% for AGIs below $25k, 3828.9% for AGIs $25k-50k, 6699.7% for AGIs $50k-75k, 9423.9% for AGIs $75k-100k, 17163.3% for AGIs $100k-200k, 59195.0% for AGIs over 200k)
Taxable interest for individuals: $917 (reported on 20.8% of returns)
This zip code:
$917
Texas:
$2,665
(% of AGI for various income ranges: 7.4% for AGIs below $25k, 11.3% for AGIs $25k-50k, 24.9% for AGIs $50k-75k, 14.4% for AGIs $75k-100k, 64.3% for AGIs $100k-200k, 660.0% for AGIs over 200k)
Ordinary dividends: $3,374 (reported on 9.0% of returns)
Here:
$3,374
State:
$10,044
(% of AGI for various income ranges: 13.1% for AGIs below $25k, 10.9% for AGIs $25k-50k, 16.9% for AGIs $50k-75k, 24.4% for AGIs $75k-100k, 108.6% for AGIs $100k-200k, 1530.0% for AGIs over 200k)
Net capital gain/loss in AGI: +$14,181 (reported on 10.2% of returns)
Here:
+$14,181
State:
+$39,590
(% of AGI for various income ranges: 22.0% for AGIs $25k-50k, 61.7% for AGIs $50k-75k, 71.1% for AGIs $75k-100k, 196.2% for AGIs $100k-200k, 14115.0% for AGIs over 200k)
Profit/loss from business: +$9,962 (reported on 22.0% of returns)
Here:
+$9,962
State:
+$10,888
(% of AGI for various income ranges: 214.6% for AGIs below $25k, 106.9% for AGIs $25k-50k, 261.1% for AGIs $50k-75k, 130.0% for AGIs $75k-100k, 1211.9% for AGIs $100k-200k)
Taxable individual retirement arrangement distribution: $21,938 (reported on 6.3% of returns)
75152:
$21,938
Texas:
$24,740
(% of AGI for various income ranges: 23.6% for AGIs below $25k, 65.6% for AGIs $25k-50k, 90.6% for AGIs $50k-75k, 280.6% for AGIs $75k-100k, 1042.9% for AGIs $100k-200k)
Total itemized deductions: $31,038 (reported on 5.1% of returns)
Here:
$31,038
State:
$40,428
(% of AGI for various income ranges: 82.3% for AGIs below $25k, 348.3% for AGIs $50k-75k, 553.3% for AGIs $100k-200k, 5760.0% for AGIs over 200k)
Charity contributions: $12,809 (reported on 4.3% of returns)
Here:
$12,809
State:
$18,201
(% of AGI for various income ranges: 130.6% for AGIs $50k-75k, 183.3% for AGIs $100k-200k, 2835.0% for AGIs over 200k)
Taxes paid: $6,154 (reported on 5.1% of returns)
75152:
$6,154
State:
$7,821
(% of AGI for various income ranges: 19.2% for AGIs below $25k, 71.4% for AGIs $50k-75k, 102.9% for AGIs $100k-200k, 1085.0% for AGIs over 200k)
Earned income credit: $2,531 (reported on 20.0% of returns)
Here:
$2,531
State:
$2,584
(% of AGI for various income ranges: 133.4% for AGIs below $25k, 88.3% for AGIs $25k-50k)
Percentage of individuals using paid preparers for their 2020 taxes: 92.5%
Here:
93%
State:
92%
(% for various income ranges: 90.1% for AGIs below $25k, 92.4% for AGIs $25k-50k, 93.3% for AGIs $50k-75k, 95.7% for AGIs $75k-100k, 93.9% for AGIs $100k-200k, 100.0% for AGIs over 200k)
Averages for the 2012 tax year for zip code 75152, filed in 2013:
Average Adjusted Gross Income (AGI) in 2012: $49,909 (Individual Income Tax Returns)
Here:
$49,909
State:
$65,384
Salary/wage: $46,371 (reported on 86.4% of returns)
Here:
$46,371
State:
$52,524
(% of AGI for various income ranges: 76.5% for AGIs below $25k, 86.0% for AGIs $25k-50k, 82.0% for AGIs $50k-75k, 85.9% for AGIs $75k-100k, 81.5% for AGIs $100k-200k, 59.4% for AGIs over 200k)
Taxable interest for individuals: $750 (reported on 22.3% of returns)
This zip code:
$750
Texas:
$2,372
(% of AGI for various income ranges: 0.6% for AGIs below $25k, 0.3% for AGIs $25k-50k, 0.2% for AGIs $50k-75k, 0.2% for AGIs $75k-100k, 0.3% for AGIs $100k-200k, 0.6% for AGIs over 200k)
Ordinary dividends: $2,362 (reported on 10.2% of returns)
Here:
$2,362
State:
$9,721
(% of AGI for various income ranges: 1.0% for AGIs below $25k, 0.3% for AGIs $25k-50k, 0.6% for AGIs $50k-75k, 0.9% for AGIs $100k-200k)
Net capital gain/loss in AGI: +$18,379 (reported on 6.8% of returns)
Here:
+$18,379
State:
+$35,319
(% of AGI for various income ranges: 10.1% for AGIs $100k-200k)
Profit/loss from business: +$11,675 (reported on 19.4% of returns)
Here:
+$11,675
State:
+$13,732
(% of AGI for various income ranges: 11.2% for AGIs below $25k, 5.2% for AGIs $25k-50k, 3.4% for AGIs $50k-75k, 3.4% for AGIs $75k-100k, 4.9% for AGIs $100k-200k)
Taxable individual retirement arrangement distribution: $16,183 (reported on 5.8% of returns)
75152:
$16,183
Texas:
$19,511
(% of AGI for various income ranges: 2.2% for AGIs below $25k, 1.6% for AGIs $25k-50k, 3.2% for AGIs $50k-75k, 1.9% for AGIs $75k-100k, 2.0% for AGIs $100k-200k)
Total itemized deductions: $20,516 (21% of AGI, reported on 21.4% of returns)
Here:
$20,516
State:
$24,724
Here:
21.4% of AGI
State:
15.9% of AGI
(% of AGI for various income ranges: 6.0% for AGIs below $25k, 7.7% for AGIs $25k-50k, 8.6% for AGIs $50k-75k, 8.8% for AGIs $75k-100k, 10.6% for AGIs $100k-200k, 9.4% for AGIs over 200k)
Charity contributions: $5,264 (reported on 16.0% of returns)
Here:
$5,264
State:
$6,808
(% of AGI for various income ranges: 0.7% for AGIs below $25k, 1.0% for AGIs $25k-50k, 1.2% for AGIs $50k-75k, 1.7% for AGIs $75k-100k, 2.6% for AGIs $100k-200k, 2.5% for AGIs over 200k)
Taxes paid: $4,445 (reported on 21.4% of returns)
75152:
$4,445
State:
$6,921
(% of AGI for various income ranges: 0.9% for AGIs below $25k, 1.9% for AGIs $25k-50k, 1.7% for AGIs $50k-75k, 1.9% for AGIs $75k-100k, 2.4% for AGIs $100k-200k, 1.9% for AGIs over 200k)
Earned income credit: $2,564 (reported on 22.8% of returns)
Here:
$2,564
State:
$2,570
(% of AGI for various income ranges: 8.3% for AGIs below $25k, 1.8% for AGIs $25k-50k)
Percentage of individuals using paid preparers for their 2012 taxes: 52.9%
Here:
53%
State:
51%
(% for various income ranges: 48.7% for AGIs below $25k, 56.4% for AGIs $25k-50k, 51.7% for AGIs $50k-75k, 57.1% for AGIs $75k-100k, 55.0% for AGIs $100k-200k, 66.7% for AGIs over 200k)
Averages for the 2004 tax year for zip code 75152, filed in 2005:
Average Adjusted Gross Income (AGI) in 2004: $42,555 (Individual Income Tax Returns)
Here:
$42,555
State:
$47,881
Salary/wage: $41,033 (reported on 87.9% of returns)
Here:
$41,033
State:
$41,947
(% of AGI for various income ranges: 116.4% for AGIs below $10k, 79.3% for AGIs $10k-25k, 89.1% for AGIs $25k-50k, 89.6% for AGIs $50k-75k, 89.8% for AGIs $75k-100k, 73.2% for AGIs over 100k)
Taxable interest for individuals: $1,551 (reported on 28.3% of returns)
This zip code:
$1,551
Texas:
$2,255
(% of AGI for various income ranges: 5.3% for AGIs below $10k, 1.6% for AGIs $10k-25k, 0.6% for AGIs $25k-50k, 0.6% for AGIs $50k-75k, 1.0% for AGIs $75k-100k, 1.4% for AGIs over 100k)
Taxable dividends: $1,705 (reported on 12.4% of returns)
Here:
$1,705
State:
$4,261
(% of AGI for various income ranges: 2.6% for AGIs below $10k, 0.6% for AGIs $10k-25k, 0.1% for AGIs $25k-50k, 0.1% for AGIs $50k-75k, 0.2% for AGIs $75k-100k, 1.2% for AGIs over 100k)
Net capital gain/loss: +$3,934 (reported on 11.1% of returns)
Here:
+$3,934
State:
+$16,110
(% of AGI for various income ranges: -1.0% for AGIs below $10k, 0.0% for AGIs $10k-25k, 0.2% for AGIs $25k-50k, 0.6% for AGIs $50k-75k, 0.1% for AGIs $75k-100k, 3.2% for AGIs over 100k)
Profit/loss from business: +$6,889 (reported on 19.2% of returns)
Here:
+$6,889
State:
+$11,013
(% of AGI for various income ranges: -4.3% for AGIs below $10k, 7.9% for AGIs $10k-25k, 3.9% for AGIs $25k-50k, 1.4% for AGIs $50k-75k, -0.3% for AGIs $75k-100k, 4.9% for AGIs over 100k)
IRA payment deduction: $3,208 (reported on 1.3% of returns)
75152:
$3,208
Texas:
$3,120
Total itemized deductions: $16,642 (22% of AGI, reported on 25.6% of returns)
Here:
$16,642
State:
$19,631
Here:
22.1% of AGI
State:
18.9% of AGI
(% of AGI for various income ranges: 15.6% for AGIs below $10k, 7.8% for AGIs $10k-25k, 7.7% for AGIs $25k-50k, 10.9% for AGIs $50k-75k, 10.7% for AGIs $75k-100k, 11.2% for AGIs over 100k)
Charity contributions deductions: $3,980 (5% of AGI, reported on 19.6% of returns)
Here:
$3,980
State:
$4,753
Here:
4.9% of AGI
State:
4.2% of AGI
(% of AGI for various income ranges: 1.2% for AGIs $10k-25k, 1.3% for AGIs $25k-50k, 1.8% for AGIs $50k-75k, 1.5% for AGIs $75k-100k, 2.8% for AGIs over 100k)
Total tax: $5,743 (reported on 72.0% of returns)
75152:
$5,743
State:
$9,058
(% of AGI for various income ranges: 3.8% for AGIs below $10k, 4.0% for AGIs $10k-25k, 5.7% for AGIs $25k-50k, 7.9% for AGIs $50k-75k, 10.8% for AGIs $75k-100k, 16.7% for AGIs over 100k)
Earned income credit: $1,947 (reported on 19.0% of returns)
Here:
$1,947
State:
$2,024
Percentage of individuals using paid preparers for their 2004 taxes: 57.0%
Here:
57%
State:
57%
(% for various income ranges: 45.5% for AGIs below $10k, 63.7% for AGIs $10k-25k, 58.9% for AGIs $25k-50k, 56.0% for AGIs $50k-75k, 57.4% for AGIs $75k-100k, 60.2% for AGIs over 100k)
Household received Food Stamps/SNAP in the past 12 months: 198 Household did not receive Food Stamps/SNAP in the past 12 months: 1,822
Women who had a birth in the past 12 months: 42 (43 now married, 0 unmarried) Women who did not have a birth in the past 12 months: 1,473 (877 now married, 588 unmarried)
Housing units in zip code 75152 with a mortgage: 1,008 (12 second mortgage, 13 both second mortgage and home equity loan) Median monthly owner costs for units with a mortgage: $1,357 Median monthly owner costs for units without a mortgage: $478
Residents with income below the poverty level in 2022:
This zip code:
10.0%
Whole state:
14.0%
Residents with income below 50% of the poverty level in 2022:
This zip code:
4.8%
Whole state:
7.4%
Median number of rooms in houses and condos:
Here:
6.0
State:
6.3
Median number of rooms in apartments:
Here:
5.1
State:
4.0
Notable locations in this zip code not listed on our city pages
1,023 married couples with children.
371 single-parent households (157 men, 214 women).
78.8% of residents of 75152 zip code speak English at home.
19.8% of residents speak Spanish at home (76% very well, 12% well, 9% not well, 4% not at all).
0.8% of residents speak other language at home (54% very well, 46% not well).
Foreign born population: 382 (6.4%) (45.8% of them are naturalized citizens)
This zip code:
6.4%
Whole state:
17.2%
83%Honduras
6%Kuwait
3%Malaysia
2%France
8%German
8%Irish
7%English
5%American
3%Arab
2%Czechoslovakian
1%Swedish
Year of entry for the foreign-born population
322010 or later
922000 to 2009
881990 to 1999
171Before 1990
Housing units lacking complete plumbing facilities: 1.9% Housing units lacking complete kitchen facilities: 1.7%
81.3%Electricity
10.7%Bottled, tank, or LP gas
7.1%Utility gas
Population in 1990: 2,605. Population change in the 1990s: +835 (+32.1%).
Place of birth for U.S.-born residents:
This state: 4,372
Northeast: 115
Midwest: 374
South: 362
West: 356
55% of the 75152 zip code residents lived in the same house 5 years ago. Out of people who lived in different houses, 51% lived in this county. Out of people who lived in different counties, 50% lived in Texas.
92% of the 75152 zip code residents lived in the same house 1 year ago. Out of people who lived in different houses, 44% moved from this county. Out of people who lived in different houses, 30% moved from different county within same state. Out of people who lived in different houses, 26% moved from different state. Out of people who lived in different houses, 1% moved from abroad.
Private vs. public school enrollment:
Students in private schools in grades 1 to 8 (elementary and middle school):
Here:
0.0%
Texas:
8.8%
Students in private schools in grades 9 to 12 (high school):
Here:
0.0%
Texas:
8.0%
Students in private undergraduate colleges:
Here:
0.0%
Texas:
16.2%
Occupation by median earnings in the past 12 months ($)
102,922Business and financial operations occupations
71,020Law enforcement workers including supervisors
66,078Health diagnosing and treating practitioners and other technical occupations
58,499Installation, maintenance, and repair occupations
56,122Management occupations
53,322Education, training, and library occupations
Top industries in this zip code by the number of employees in 2005:
Other Services (except Public Administration): Religious Organizations (20-49 employees: 1 establishment, 5-9 employees: 1 establishment)
Management of Companies and Enterprises: Corporate, Subsidiary, and Regional Managing Offices (20-49: 1)
Finance and Insurance: Commercial Banking (20-49: 1)
Professional, Scientific, and Technical Services: Surveying and Mapping (except Geophysical) Services (10-19: 1)
Other Services (except Public Administration): Automotive Body, Paint, and Interior Repair and Maintenance (10-19: 1)
Other Services (except Public Administration): General Automotive Repair (5-9: 1, 1-4: 1)
Home Mortgage Disclosure Act Aggregated Statistics For Year 2009 (Based on 4 partial tracts)
A) FHA, FSA/RHS & VA Home Purchase Loans
B) Conventional Home Purchase Loans
C) Refinancings
D) Home Improvement Loans
E) Loans on Dwellings For 5+ Families
F) Non-occupant Loans on < 5 Family Dwellings (A B C & D)
G) Loans On Manufactured Home Dwelling (A B C & D)
Number
Average Value
Number
Average Value
Number
Average Value
Number
Average Value
Number
Average Value
Number
Average Value
Number
Average Value
LOANS ORIGINATED
19
$108,444
16
$95,476
34
$140,584
9
$36,143
1
$497,170
7
$66,019
6
$46,165
APPLICATIONS APPROVED, NOT ACCEPTED
2
$86,630
4
$80,085
6
$111,182
1
$23,270
0
$0
0
$0
1
$69,110
APPLICATIONS DENIED
8
$105,860
12
$120,083
28
$127,129
7
$15,186
0
$0
0
$0
11
$58,700
APPLICATIONS WITHDRAWN
1
$100,550
7
$109,560
13
$118,085
2
$91,370
0
$0
1
$47,250
1
$74,750
FILES CLOSED FOR INCOMPLETENESS
0
$0
1
$56,420
2
$95,960
1
$109,310
0
$0
0
$0
0
$0
Aggregated Statistics For Year 2008 (Based on 4 partial tracts)
A) FHA, FSA/RHS & VA Home Purchase Loans
B) Conventional Home Purchase Loans
C) Refinancings
D) Home Improvement Loans
F) Non-occupant Loans on < 5 Family Dwellings (A B C & D)
G) Loans On Manufactured Home Dwelling (A B C & D)
Number
Average Value
Number
Average Value
Number
Average Value
Number
Average Value
Number
Average Value
Number
Average Value
LOANS ORIGINATED
17
$125,805
37
$110,376
36
$150,658
11
$24,658
11
$93,575
12
$62,285
APPLICATIONS APPROVED, NOT ACCEPTED
1
$52,890
6
$97,592
7
$88,654
5
$12,912
2
$63,755
2
$50,775
APPLICATIONS DENIED
3
$101,880
17
$93,126
38
$107,322
21
$31,172
6
$74,550
12
$49,906
APPLICATIONS WITHDRAWN
2
$174,910
8
$102,800
11
$148,925
3
$38,317
2
$53,565
2
$52,555
FILES CLOSED FOR INCOMPLETENESS
0
$0
2
$111,510
4
$136,000
1
$21,930
0
$0
0
$0
Aggregated Statistics For Year 2007 (Based on 4 partial tracts)
A) FHA, FSA/RHS & VA Home Purchase Loans
B) Conventional Home Purchase Loans
C) Refinancings
D) Home Improvement Loans
F) Non-occupant Loans on < 5 Family Dwellings (A B C & D)
G) Loans On Manufactured Home Dwelling (A B C & D)
Number
Average Value
Number
Average Value
Number
Average Value
Number
Average Value
Number
Average Value
Number
Average Value
LOANS ORIGINATED
15
$113,911
77
$102,967
38
$119,943
13
$65,456
12
$83,596
13
$67,470
APPLICATIONS APPROVED, NOT ACCEPTED
1
$91,680
21
$85,421
12
$102,251
6
$28,220
1
$78,280
9
$52,616
APPLICATIONS DENIED
8
$86,090
47
$95,458
61
$121,439
23
$30,926
9
$64,980
14
$61,996
APPLICATIONS WITHDRAWN
2
$114,595
7
$85,663
25
$117,017
5
$41,356
2
$29,265
2
$86,475
FILES CLOSED FOR INCOMPLETENESS
0
$0
7
$98,499
13
$157,922
0
$0
1
$33,850
0
$0
Aggregated Statistics For Year 2006 (Based on 4 partial tracts)
A) FHA, FSA/RHS & VA Home Purchase Loans
B) Conventional Home Purchase Loans
C) Refinancings
D) Home Improvement Loans
F) Non-occupant Loans on < 5 Family Dwellings (A B C & D)
G) Loans On Manufactured Home Dwelling (A B C & D)
Number
Average Value
Number
Average Value
Number
Average Value
Number
Average Value
Number
Average Value
Number
Average Value
LOANS ORIGINATED
17
$105,865
90
$95,875
34
$111,439
11
$33,055
13
$87,110
17
$82,498
APPLICATIONS APPROVED, NOT ACCEPTED
1
$55,010
20
$97,214
8
$137,150
1
$64,890
1
$106,490
4
$37,375
APPLICATIONS DENIED
2
$79,380
37
$86,003
48
$101,220
19
$24,021
4
$43,385
11
$73,001
APPLICATIONS WITHDRAWN
2
$102,200
19
$97,828
25
$102,082
4
$69,675
4
$87,092
3
$57,120
FILES CLOSED FOR INCOMPLETENESS
0
$0
1
$99,320
7
$129,601
0
$0
0
$0
0
$0
Aggregated Statistics For Year 2005 (Based on 4 partial tracts)
A) FHA, FSA/RHS & VA Home Purchase Loans
B) Conventional Home Purchase Loans
C) Refinancings
D) Home Improvement Loans
F) Non-occupant Loans on < 5 Family Dwellings (A B C & D)
G) Loans On Manufactured Home Dwelling (A B C & D)
Number
Average Value
Number
Average Value
Number
Average Value
Number
Average Value
Number
Average Value
Number
Average Value
LOANS ORIGINATED
17
$104,706
90
$99,005
59
$114,416
16
$70,052
19
$67,530
15
$80,423
APPLICATIONS APPROVED, NOT ACCEPTED
1
$95,130
19
$72,654
9
$81,647
5
$42,902
2
$53,310
11
$51,762
APPLICATIONS DENIED
2
$84,050
37
$70,149
69
$95,098
25
$37,763
4
$88,150
19
$53,705
APPLICATIONS WITHDRAWN
3
$113,080
8
$142,516
38
$120,925
5
$148,168
3
$73,810
1
$129,050
FILES CLOSED FOR INCOMPLETENESS
2
$116,360
5
$142,732
30
$126,309
0
$0
0
$0
1
$52,890
Aggregated Statistics For Year 2004 (Based on 4 partial tracts)
A) FHA, FSA/RHS & VA Home Purchase Loans
B) Conventional Home Purchase Loans
C) Refinancings
D) Home Improvement Loans
F) Non-occupant Loans on < 5 Family Dwellings (A B C & D)
G) Loans On Manufactured Home Dwelling (A B C & D)
Number
Average Value
Number
Average Value
Number
Average Value
Number
Average Value
Number
Average Value
Number
Average Value
LOANS ORIGINATED
20
$99,114
69
$91,637
88
$116,433
23
$24,417
16
$65,024
13
$86,968
APPLICATIONS APPROVED, NOT ACCEPTED
2
$90,630
17
$90,367
13
$72,622
2
$58,480
4
$93,792
8
$47,274
APPLICATIONS DENIED
5
$116,220
32
$90,486
83
$94,027
16
$25,911
5
$62,058
19
$72,186
APPLICATIONS WITHDRAWN
2
$129,280
11
$85,860
39
$111,285
5
$59,944
1
$109,310
3
$90,300
FILES CLOSED FOR INCOMPLETENESS
0
$0
3
$121,210
23
$120,236
0
$0
1
$157,260
0
$0
Aggregated Statistics For Year 2003 (Based on 4 partial tracts)
A) FHA, FSA/RHS & VA Home Purchase Loans
B) Conventional Home Purchase Loans
C) Refinancings
D) Home Improvement Loans
F) Non-occupant Loans on < 5 Family Dwellings (A B C & D)
Number
Average Value
Number
Average Value
Number
Average Value
Number
Average Value
Number
Average Value
LOANS ORIGINATED
21
$97,522
49
$91,821
130
$103,963
14
$29,849
18
$79,346
APPLICATIONS APPROVED, NOT ACCEPTED
2
$87,545
11
$79,885
27
$86,384
4
$32,088
1
$114,950
APPLICATIONS DENIED
9
$110,660
45
$65,439
109
$102,522
11
$17,436
9
$66,064
APPLICATIONS WITHDRAWN
1
$127,640
9
$112,618
50
$112,016
2
$12,340
2
$74,335
FILES CLOSED FOR INCOMPLETENESS
0
$0
3
$115,653
5
$77,136
1
$25,070
1
$75,460
Aggregated Statistics For Year 2002 (Based on 2 partial tracts)
A) FHA, FSA/RHS & VA Home Purchase Loans
B) Conventional Home Purchase Loans
C) Refinancings
D) Home Improvement Loans
Number
Average Value
Number
Average Value
Number
Average Value
Number
Average Value
LOANS ORIGINATED
2
$95,640
3
$70,880
7
$137,246
0
$0
APPLICATIONS APPROVED, NOT ACCEPTED
0
$0
0
$0
2
$71,160
0
$0
APPLICATIONS DENIED
0
$0
2
$49,800
4
$77,040
1
$12,720
APPLICATIONS WITHDRAWN
0
$0
1
$26,880
2
$124,920
0
$0
FILES CLOSED FOR INCOMPLETENESS
0
$0
0
$0
0
$0
0
$0
Aggregated Statistics For Year 2001 (Based on 2 partial tracts)
A) FHA, FSA/RHS & VA Home Purchase Loans
B) Conventional Home Purchase Loans
C) Refinancings
D) Home Improvement Loans
F) Non-occupant Loans on < 5 Family Dwellings (A B C & D)
Number
Average Value
Number
Average Value
Number
Average Value
Number
Average Value
Number
Average Value
LOANS ORIGINATED
1
$106,320
5
$75,792
6
$96,320
1
$14,160
1
$54,720
APPLICATIONS APPROVED, NOT ACCEPTED
0
$0
2
$94,080
2
$91,200
0
$0
0
$0
APPLICATIONS DENIED
0
$0
4
$50,940
2
$81,000
0
$0
0
$0
APPLICATIONS WITHDRAWN
0
$0
1
$26,160
1
$84,240
0
$0
0
$0
FILES CLOSED FOR INCOMPLETENESS
0
$0
0
$0
0
$0
0
$0
0
$0
Aggregated Statistics For Year 2000 (Based on 2 partial tracts)
B) Conventional Home Purchase Loans
C) Refinancings
D) Home Improvement Loans
F) Non-occupant Loans on < 5 Family Dwellings (A B C & D)
Number
Average Value
Number
Average Value
Number
Average Value
Number
Average Value
LOANS ORIGINATED
2
$105,720
1
$131,280
3
$12,160
1
$19,440
APPLICATIONS APPROVED, NOT ACCEPTED
1
$38,160
0
$0
1
$26,400
0
$0
APPLICATIONS DENIED
4
$39,900
0
$0
0
$0
0
$0
APPLICATIONS WITHDRAWN
0
$0
0
$0
0
$0
0
$0
FILES CLOSED FOR INCOMPLETENESS
0
$0
0
$0
0
$0
0
$0
Aggregated Statistics For Year 1999 (Based on 2 partial tracts)
A) FHA, FSA/RHS & VA Home Purchase Loans
B) Conventional Home Purchase Loans
C) Refinancings
D) Home Improvement Loans
F) Non-occupant Loans on < 5 Family Dwellings (A B C & D)
Detailed PMIC statistics for the following Tracts:0601.02
, 0613.00
2002 - 2018 National Fire Incident Reporting System (NFIRS) incidents
Based on the data from the years 2002 - 2018 the average number of fire incidents per year is 6. The highest number of reported fire incidents - 25 took place in 2005, and the least - 1 in 2002. The data has a constant trend.
When looking into fire subcategories, the most incidents belonged to: Structure Fires (45.8%), and Outside Fires (43.9%).
Fire incident types reported to NFIRS in Zip Code 75152


 Nearest zip codes: 75125, 75165, 75146, 75119, 75154, 75172.


 Based on the data from the years 2002 - 2018 the average number of fire incidents per year is 6. The highest number of reported fire incidents - 25 took place in 2005, and the least - 1 in 2002. The data has a constant trend.
 When looking into fire subcategories, the most incidents belonged to: Structure Fires (45.8%), and Outside Fires (43.9%).