Estimated zip code population in 2022: 10,574
Zip code population in 2010: 10,598
Zip code population in 2000: 12,079
Houses and condos: 4,865
Renter-occupied apartments: 1,534
% of renters here:
40%State:
35%
March 2022 cost of living index in zip code 74126: 85.2
(less than average, U.S. average is 100)
Land area: 24.0
sq. mi.
Water area: 0.1
sq. mi.
Population density: 441 people per square mile (low).
OSM Map
General Map
Google Map
MSN Map
OSM Map
General Map
Google Map
MSN Map
OSM Map
General Map
Google Map
MSN Map
OSM Map
General Map
Google Map
MSN Map
Please wait while loading the map...
Real estate property taxes paid for housing units in 2022:
This zip code:
0.8% ($510)Oklahoma:
0.8% ($1,501)
Median real estate property taxes paid for housing units with mortgages in 2022: $604 (0.8%)
Median real estate property taxes paid for housing units with no mortgage in 2022: $474 (0.7%)
Business Search - 14 Million verified businesses
Males: 4,824 Females: 5,751
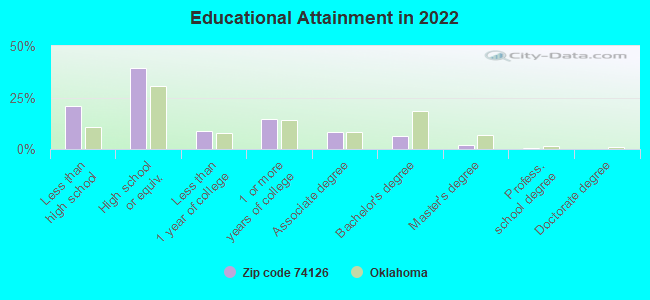
For population 25 years and over in 74126:
High school or higher: 77.7%Bachelor's degree or higher: 8.6%Graduate or professional degree: 2.4%Unemployed: 8.5%Mean travel time to work (commute): 24.2 minutes
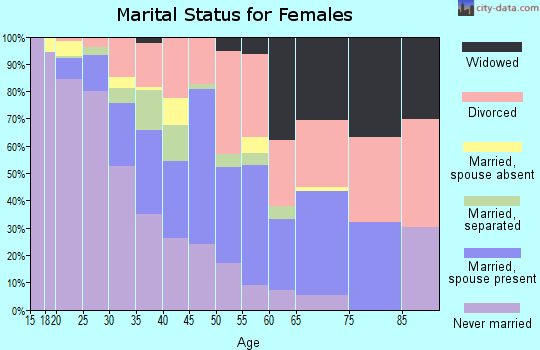
For population 15 years and over in 74126:
Never married: 40.1%Now married: 35.5%Separated: 4.7%Widowed: 6.4%Divorced: 13.3%
Zip code 74126 compared to state average:
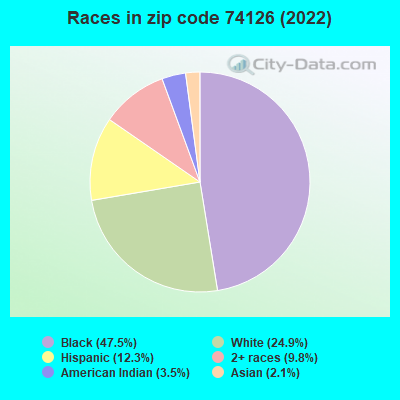
Median household income below state average. Median house value significantly below state average. Unemployed percentage above state average. Black race population percentage significantly above state average. Median age below state average. Length of stay since moving in significantly above state average. Number of college students below state average. Percentage of population with a bachelor's degree or higher significantly below state average. 5,021 47.5% Black 2,627 24.9% White 1,298 12.3% Hispanic or Latino 1,040 9.8% Two or more races 368 3.5% American Indian 217 2.1% Asian
Data:
Median household income ($)
Median household income (% change since 2000)
Household income diversity
Ratio of average income to average house value (%)
Ratio of average income to average rent
Median household income ($) - White
Median household income ($) - Black or African American
Median household income ($) - Asian
Median household income ($) - Hispanic or Latino
Median household income ($) - American Indian and Alaska Native
Median household income ($) - Multirace
Median household income ($) - Other Race
Median household income for houses/condos with a mortgage ($)
Median household income for apartments without a mortgage ($)
Races - White alone (%)
Races - White alone (% change since 2000)
Races - Black alone (%)
Races - Black alone (% change since 2000)
Races - American Indian alone (%)
Races - American Indian alone (% change since 2000)
Races - Asian alone (%)
Races - Asian alone (% change since 2000)
Races - Hispanic (%)
Races - Hispanic (% change since 2000)
Races - Native Hawaiian and Other Pacific Islander alone (%)
Races - Native Hawaiian and Other Pacific Islander alone (% change since 2000)
Races - Two or more races (%)
Races - Two or more races (% change since 2000)
Races - Other race alone (%)
Races - Other race alone (% change since 2000)
Racial diversity
Unemployment (%)
Unemployment (% change since 2000)
Unemployment (%) - White
Unemployment (%) - Black or African American
Unemployment (%) - Asian
Unemployment (%) - Hispanic or Latino
Unemployment (%) - American Indian and Alaska Native
Unemployment (%) - Multirace
Unemployment (%) - Other Race
Population density (people per square mile)
Population - Males (%)
Population - Females (%)
Population - Males (%) - White
Population - Males (%) - Black or African American
Population - Males (%) - Asian
Population - Males (%) - Hispanic or Latino
Population - Males (%) - American Indian and Alaska Native
Population - Males (%) - Multirace
Population - Males (%) - Other Race
Population - Females (%) - White
Population - Females (%) - Black or African American
Population - Females (%) - Asian
Population - Females (%) - Hispanic or Latino
Population - Females (%) - American Indian and Alaska Native
Population - Females (%) - Multirace
Population - Females (%) - Other Race
Coronavirus confirmed cases (Jun 07, 2024)
Deaths caused by coronavirus (Jun 07, 2024)
Coronavirus confirmed cases (per 100k population) (Jun 07, 2024)
Deaths caused by coronavirus (per 100k population) (Jun 07, 2024)
Daily increase in number of cases (Jun 07, 2024)
Weekly increase in number of cases (Jun 07, 2024)
Cases doubled (in days) (Jun 07, 2024)
Hospitalized patients (Apr 18, 2022)
Negative test results (Apr 18, 2022)
Total test results (Apr 18, 2022)
COVID Vaccine doses distributed (per 100k population) (Sep 19, 2023)
COVID Vaccine doses administered (per 100k population) (Sep 19, 2023)
COVID Vaccine doses distributed (Sep 19, 2023)
COVID Vaccine doses administered (Sep 19, 2023)
Likely homosexual households (%)
Likely homosexual households (% change since 2000)
Likely homosexual households - Lesbian couples (%)
Likely homosexual households - Lesbian couples (% change since 2000)
Likely homosexual households - Gay men (%)
Likely homosexual households - Gay men (% change since 2000)
Cost of living index
Median gross rent ($)
Median contract rent ($)
Median monthly housing costs ($)
Median house or condo value ($)
Median house or condo value ($ change since 2000)
Mean house or condo value by units in structure - 1, detached ($)
Mean house or condo value by units in structure - 1, attached ($)
Mean house or condo value by units in structure - 2 ($)
Mean house or condo value by units in structure by units in structure - 3 or 4 ($)
Mean house or condo value by units in structure - 5 or more ($)
Mean house or condo value by units in structure - Boat, RV, van, etc. ($)
Mean house or condo value by units in structure - Mobile home ($)
Median house or condo value ($) - White
Median house or condo value ($) - Black or African American
Median house or condo value ($) - Asian
Median house or condo value ($) - Hispanic or Latino
Median house or condo value ($) - American Indian and Alaska Native
Median house or condo value ($) - Multirace
Median house or condo value ($) - Other Race
Median resident age
Resident age diversity
Median resident age - Males
Median resident age - Females
Median resident age - White
Median resident age - Black or African American
Median resident age - Asian
Median resident age - Hispanic or Latino
Median resident age - American Indian and Alaska Native
Median resident age - Multirace
Median resident age - Other Race
Median resident age - Males - White
Median resident age - Males - Black or African American
Median resident age - Males - Asian
Median resident age - Males - Hispanic or Latino
Median resident age - Males - American Indian and Alaska Native
Median resident age - Males - Multirace
Median resident age - Males - Other Race
Median resident age - Females - White
Median resident age - Females - Black or African American
Median resident age - Females - Asian
Median resident age - Females - Hispanic or Latino
Median resident age - Females - American Indian and Alaska Native
Median resident age - Females - Multirace
Median resident age - Females - Other Race
Commute - mean travel time to work (minutes)
Travel time to work - Less than 5 minutes (%)
Travel time to work - Less than 5 minutes (% change since 2000)
Travel time to work - 5 to 9 minutes (%)
Travel time to work - 5 to 9 minutes (% change since 2000)
Travel time to work - 10 to 19 minutes (%)
Travel time to work - 10 to 19 minutes (% change since 2000)
Travel time to work - 20 to 29 minutes (%)
Travel time to work - 20 to 29 minutes (% change since 2000)
Travel time to work - 30 to 39 minutes (%)
Travel time to work - 30 to 39 minutes (% change since 2000)
Travel time to work - 40 to 59 minutes (%)
Travel time to work - 40 to 59 minutes (% change since 2000)
Travel time to work - 60 to 89 minutes (%)
Travel time to work - 60 to 89 minutes (% change since 2000)
Travel time to work - 90 or more minutes (%)
Travel time to work - 90 or more minutes (% change since 2000)
Marital status - Never married (%)
Marital status - Now married (%)
Marital status - Separated (%)
Marital status - Widowed (%)
Marital status - Divorced (%)
Median family income ($)
Median family income (% change since 2000)
Median non-family income ($)
Median non-family income (% change since 2000)
Median per capita income ($)
Median per capita income (% change since 2000)
Median family income ($) - White
Median family income ($) - Black or African American
Median family income ($) - Asian
Median family income ($) - Hispanic or Latino
Median family income ($) - American Indian and Alaska Native
Median family income ($) - Multirace
Median family income ($) - Other Race
Median year house/condo built
Median year apartment built
Year house built - Built 2005 or later (%)
Year house built - Built 2000 to 2004 (%)
Year house built - Built 1990 to 1999 (%)
Year house built - Built 1980 to 1989 (%)
Year house built - Built 1970 to 1979 (%)
Year house built - Built 1960 to 1969 (%)
Year house built - Built 1950 to 1959 (%)
Year house built - Built 1940 to 1949 (%)
Year house built - Built 1939 or earlier (%)
Average household size
Household density (households per square mile)
Average household size - White
Average household size - Black or African American
Average household size - Asian
Average household size - Hispanic or Latino
Average household size - American Indian and Alaska Native
Average household size - Multirace
Average household size - Other Race
Occupied housing units (%)
Vacant housing units (%)
Owner occupied housing units (%)
Renter occupied housing units (%)
Vacancy status - For rent (%)
Vacancy status - For sale only (%)
Vacancy status - Rented or sold, not occupied (%)
Vacancy status - For seasonal, recreational, or occasional use (%)
Vacancy status - For migrant workers (%)
Vacancy status - Other vacant (%)
Residents with income below the poverty level (%)
Residents with income below 50% of the poverty level (%)
Children below poverty level (%)
Poor families by family type - Married-couple family (%)
Poor families by family type - Male, no wife present (%)
Poor families by family type - Female, no husband present (%)
Poverty status for native-born residents (%)
Poverty status for foreign-born residents (%)
Poverty among high school graduates not in families (%)
Poverty among people who did not graduate high school not in families (%)
Residents with income below the poverty level (%) - White
Residents with income below the poverty level (%) - Black or African American
Residents with income below the poverty level (%) - Asian
Residents with income below the poverty level (%) - Hispanic or Latino
Residents with income below the poverty level (%) - American Indian and Alaska Native
Residents with income below the poverty level (%) - Multirace
Residents with income below the poverty level (%) - Other Race
Air pollution - Air Quality Index (AQI)
Air pollution - CO
Air pollution - NO2
Air pollution - SO2
Air pollution - Ozone
Air pollution - PM10
Air pollution - PM25
Air pollution - Pb
Crime - Murders per 100,000 population
Crime - Rapes per 100,000 population
Crime - Robberies per 100,000 population
Crime - Assaults per 100,000 population
Crime - Burglaries per 100,000 population
Crime - Thefts per 100,000 population
Crime - Auto thefts per 100,000 population
Crime - Arson per 100,000 population
Crime - City-data.com crime index
Crime - Violent crime index
Crime - Property crime index
Crime - Murders per 100,000 population (5 year average)
Crime - Rapes per 100,000 population (5 year average)
Crime - Robberies per 100,000 population (5 year average)
Crime - Assaults per 100,000 population (5 year average)
Crime - Burglaries per 100,000 population (5 year average)
Crime - Thefts per 100,000 population (5 year average)
Crime - Auto thefts per 100,000 population (5 year average)
Crime - Arson per 100,000 population (5 year average)
Crime - City-data.com crime index (5 year average)
Crime - Violent crime index (5 year average)
Crime - Property crime index (5 year average)
1996 Presidential Elections Results (%) - Democratic Party (Clinton)
1996 Presidential Elections Results (%) - Republican Party (Dole)
1996 Presidential Elections Results (%) - Other
2000 Presidential Elections Results (%) - Democratic Party (Gore)
2000 Presidential Elections Results (%) - Republican Party (Bush)
2000 Presidential Elections Results (%) - Other
2004 Presidential Elections Results (%) - Democratic Party (Kerry)
2004 Presidential Elections Results (%) - Republican Party (Bush)
2004 Presidential Elections Results (%) - Other
2008 Presidential Elections Results (%) - Democratic Party (Obama)
2008 Presidential Elections Results (%) - Republican Party (McCain)
2008 Presidential Elections Results (%) - Other
2012 Presidential Elections Results (%) - Democratic Party (Obama)
2012 Presidential Elections Results (%) - Republican Party (Romney)
2012 Presidential Elections Results (%) - Other
2016 Presidential Elections Results (%) - Democratic Party (Clinton)
2016 Presidential Elections Results (%) - Republican Party (Trump)
2016 Presidential Elections Results (%) - Other
2020 Presidential Elections Results (%) - Democratic Party (Biden)
2020 Presidential Elections Results (%) - Republican Party (Trump)
2020 Presidential Elections Results (%) - Other
Ancestries Reported - Arab (%)
Ancestries Reported - Czech (%)
Ancestries Reported - Danish (%)
Ancestries Reported - Dutch (%)
Ancestries Reported - English (%)
Ancestries Reported - French (%)
Ancestries Reported - French Canadian (%)
Ancestries Reported - German (%)
Ancestries Reported - Greek (%)
Ancestries Reported - Hungarian (%)
Ancestries Reported - Irish (%)
Ancestries Reported - Italian (%)
Ancestries Reported - Lithuanian (%)
Ancestries Reported - Norwegian (%)
Ancestries Reported - Polish (%)
Ancestries Reported - Portuguese (%)
Ancestries Reported - Russian (%)
Ancestries Reported - Scotch-Irish (%)
Ancestries Reported - Scottish (%)
Ancestries Reported - Slovak (%)
Ancestries Reported - Subsaharan African (%)
Ancestries Reported - Swedish (%)
Ancestries Reported - Swiss (%)
Ancestries Reported - Ukrainian (%)
Ancestries Reported - United States (%)
Ancestries Reported - Welsh (%)
Ancestries Reported - West Indian (%)
Ancestries Reported - Other (%)
Educational Attainment - No schooling completed (%)
Educational Attainment - Less than high school (%)
Educational Attainment - High school or equivalent (%)
Educational Attainment - Less than 1 year of college (%)
Educational Attainment - 1 or more years of college (%)
Educational Attainment - Associate degree (%)
Educational Attainment - Bachelor's degree (%)
Educational Attainment - Master's degree (%)
Educational Attainment - Professional school degree (%)
Educational Attainment - Doctorate degree (%)
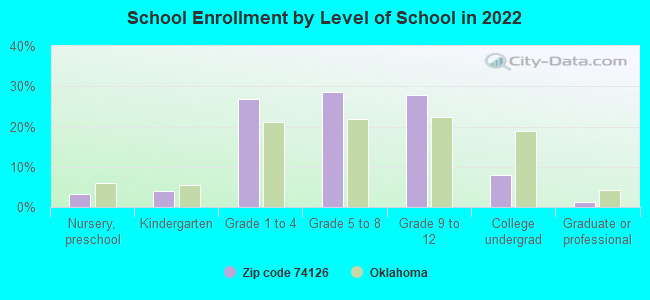
School Enrollment - Nursery, preschool (%)
School Enrollment - Kindergarten (%)
School Enrollment - Grade 1 to 4 (%)
School Enrollment - Grade 5 to 8 (%)
School Enrollment - Grade 9 to 12 (%)
School Enrollment - College undergrad (%)
School Enrollment - Graduate or professional (%)
School Enrollment - Not enrolled in school (%)
School enrollment - Public schools (%)
School enrollment - Private schools (%)
School enrollment - Not enrolled (%)
Median number of rooms in houses and condos
Median number of rooms in apartments
Housing units lacking complete plumbing facilities (%)
Housing units lacking complete kitchen facilities (%)
Density of houses
Urban houses (%)
Rural houses (%)
Households with people 60 years and over (%)
Households with people 65 years and over (%)
Households with people 75 years and over (%)
Households with one or more nonrelatives (%)
Households with no nonrelatives (%)
Population in households (%)
Family households (%)
Nonfamily households (%)
Population in families (%)
Family households with own children (%)
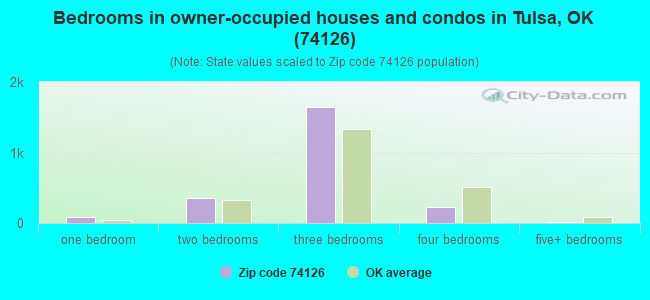
Median number of bedrooms in owner occupied houses
Mean number of bedrooms in owner occupied houses
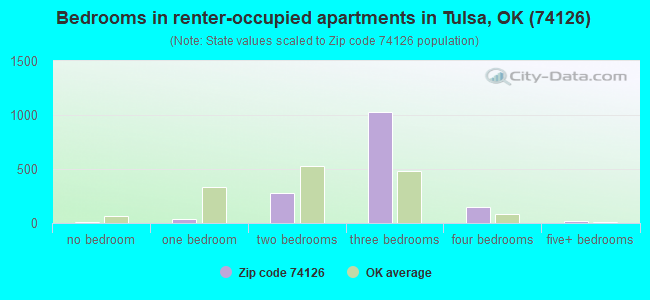
Median number of bedrooms in renter occupied houses
Mean number of bedrooms in renter occupied houses
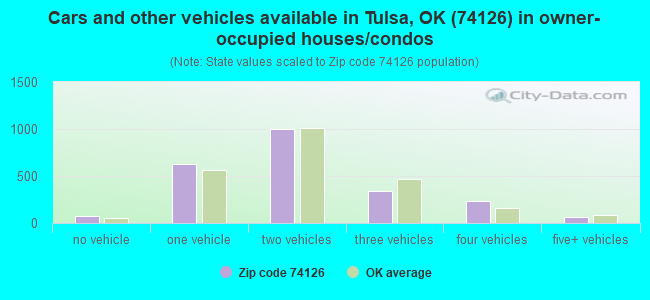
Median number of vehichles in owner occupied houses
Mean number of vehichles in owner occupied houses
Median number of vehichles in renter occupied houses
Mean number of vehichles in renter occupied houses
Mortgage status - with mortgage (%)
Mortgage status - with second mortgage (%)
Mortgage status - with home equity loan (%)
Mortgage status - with both second mortgage and home equity loan (%)
Mortgage status - without a mortgage (%)
Average family size
Average family size - White
Average family size - Black or African American
Average family size - Asian
Average family size - Hispanic or Latino
Average family size - American Indian and Alaska Native
Average family size - Multirace
Average family size - Other Race
Geographical mobility - Same house 1 year ago (%)
Geographical mobility - Moved within same county (%)
Geographical mobility - Moved from different county within same state (%)
Geographical mobility - Moved from different state (%)
Geographical mobility - Moved from abroad (%)
Place of birth - Born in state of residence (%)
Place of birth - Born in other state (%)
Place of birth - Native, outside of US (%)
Place of birth - Foreign born (%)
Housing units in structures - 1, detached (%)
Housing units in structures - 1, attached (%)
Housing units in structures - 2 (%)
Housing units in structures - 3 or 4 (%)
Housing units in structures - 5 to 9 (%)
Housing units in structures - 10 to 19 (%)
Housing units in structures - 20 to 49 (%)
Housing units in structures - 50 or more (%)
Housing units in structures - Mobile home (%)
Housing units in structures - Boat, RV, van, etc. (%)
House/condo owner moved in on average (years ago)
Renter moved in on average (years ago)
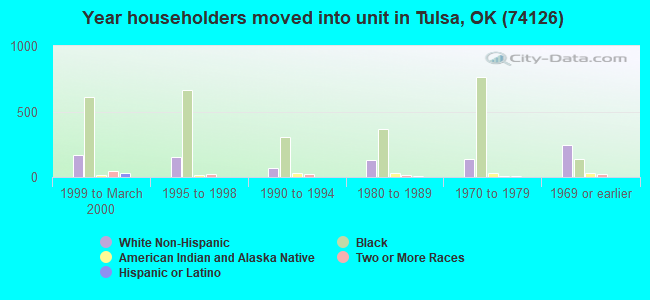
Year householder moved into unit - Moved in 1999 to March 2000 (%)
Year householder moved into unit - Moved in 1995 to 1998 (%)
Year householder moved into unit - Moved in 1990 to 1994 (%)
Year householder moved into unit - Moved in 1980 to 1989 (%)
Year householder moved into unit - Moved in 1970 to 1979 (%)
Year householder moved into unit - Moved in 1969 or earlier (%)
Means of transportation to work - Drove car alone (%)
Means of transportation to work - Carpooled (%)
Means of transportation to work - Public transportation (%)
Means of transportation to work - Bus or trolley bus (%)
Means of transportation to work - Streetcar or trolley car (%)
Means of transportation to work - Subway or elevated (%)
Means of transportation to work - Railroad (%)
Means of transportation to work - Ferryboat (%)
Means of transportation to work - Taxicab (%)
Means of transportation to work - Motorcycle (%)
Means of transportation to work - Bicycle (%)
Means of transportation to work - Walked (%)
Means of transportation to work - Other means (%)
Working at home (%)
Industry diversity
Most Common Industries - Agriculture, forestry, fishing and hunting, and mining (%)
Most Common Industries - Agriculture, forestry, fishing and hunting (%)
Most Common Industries - Mining, quarrying, and oil and gas extraction (%)
Most Common Industries - Construction (%)
Most Common Industries - Manufacturing (%)
Most Common Industries - Wholesale trade (%)
Most Common Industries - Retail trade (%)
Most Common Industries - Transportation and warehousing, and utilities (%)
Most Common Industries - Transportation and warehousing (%)
Most Common Industries - Utilities (%)
Most Common Industries - Information (%)
Most Common Industries - Finance and insurance, and real estate and rental and leasing (%)
Most Common Industries - Finance and insurance (%)
Most Common Industries - Real estate and rental and leasing (%)
Most Common Industries - Professional, scientific, and management, and administrative and waste management services (%)
Most Common Industries - Professional, scientific, and technical services (%)
Most Common Industries - Management of companies and enterprises (%)
Most Common Industries - Administrative and support and waste management services (%)
Most Common Industries - Educational services, and health care and social assistance (%)
Most Common Industries - Educational services (%)
Most Common Industries - Health care and social assistance (%)
Most Common Industries - Arts, entertainment, and recreation, and accommodation and food services (%)
Most Common Industries - Arts, entertainment, and recreation (%)
Most Common Industries - Accommodation and food services (%)
Most Common Industries - Other services, except public administration (%)
Most Common Industries - Public administration (%)
Occupation diversity
Most Common Occupations - Management, business, science, and arts occupations (%)
Most Common Occupations - Management, business, and financial occupations (%)
Most Common Occupations - Management occupations (%)
Most Common Occupations - Business and financial operations occupations (%)
Most Common Occupations - Computer, engineering, and science occupations (%)
Most Common Occupations - Computer and mathematical occupations (%)
Most Common Occupations - Architecture and engineering occupations (%)
Most Common Occupations - Life, physical, and social science occupations (%)
Most Common Occupations - Education, legal, community service, arts, and media occupations (%)
Most Common Occupations - Community and social service occupations (%)
Most Common Occupations - Legal occupations (%)
Most Common Occupations - Education, training, and library occupations (%)
Most Common Occupations - Arts, design, entertainment, sports, and media occupations (%)
Most Common Occupations - Healthcare practitioners and technical occupations (%)
Most Common Occupations - Health diagnosing and treating practitioners and other technical occupations (%)
Most Common Occupations - Health technologists and technicians (%)
Most Common Occupations - Service occupations (%)
Most Common Occupations - Healthcare support occupations (%)
Most Common Occupations - Protective service occupations (%)
Most Common Occupations - Fire fighting and prevention, and other protective service workers including supervisors (%)
Most Common Occupations - Law enforcement workers including supervisors (%)
Most Common Occupations - Food preparation and serving related occupations (%)
Most Common Occupations - Building and grounds cleaning and maintenance occupations (%)
Most Common Occupations - Personal care and service occupations (%)
Most Common Occupations - Sales and office occupations (%)
Most Common Occupations - Sales and related occupations (%)
Most Common Occupations - Office and administrative support occupations (%)
Most Common Occupations - Natural resources, construction, and maintenance occupations (%)
Most Common Occupations - Farming, fishing, and forestry occupations (%)
Most Common Occupations - Construction and extraction occupations (%)
Most Common Occupations - Installation, maintenance, and repair occupations (%)
Most Common Occupations - Production, transportation, and material moving occupations (%)
Most Common Occupations - Production occupations (%)
Most Common Occupations - Transportation occupations (%)
Most Common Occupations - Material moving occupations (%)
People in Group quarters - Institutionalized population (%)
People in Group quarters - Correctional institutions (%)
People in Group quarters - Federal prisons and detention centers (%)
People in Group quarters - Halfway houses (%)
People in Group quarters - Local jails and other confinement facilities (including police lockups) (%)
People in Group quarters - Military disciplinary barracks (%)
People in Group quarters - State prisons (%)
People in Group quarters - Other types of correctional institutions (%)
People in Group quarters - Nursing homes (%)
People in Group quarters - Hospitals/wards, hospices, and schools for the handicapped (%)
People in Group quarters - Hospitals/wards and hospices for chronically ill (%)
People in Group quarters - Hospices or homes for chronically ill (%)
People in Group quarters - Military hospitals or wards for chronically ill (%)
People in Group quarters - Other hospitals or wards for chronically ill (%)
People in Group quarters - Hospitals or wards for drug/alcohol abuse (%)
People in Group quarters - Mental (Psychiatric) hospitals or wards (%)
People in Group quarters - Schools, hospitals, or wards for the mentally retarded (%)
People in Group quarters - Schools, hospitals, or wards for the physically handicapped (%)
People in Group quarters - Institutions for the deaf (%)
People in Group quarters - Institutions for the blind (%)
People in Group quarters - Orthopedic wards and institutions for the physically handicapped (%)
People in Group quarters - Wards in general hospitals for patients who have no usual home elsewhere (%)
People in Group quarters - Wards in military hospitals for patients who have no usual home elsewhere (%)
People in Group quarters - Juvenile institutions (%)
People in Group quarters - Long-term care (%)
People in Group quarters - Homes for abused, dependent, and neglected children (%)
People in Group quarters - Residential treatment centers for emotionally disturbed children (%)
People in Group quarters - Training schools for juvenile delinquents (%)
People in Group quarters - Short-term care, detention or diagnostic centers for delinquent children (%)
People in Group quarters - Type of juvenile institution unknown (%)
People in Group quarters - Noninstitutionalized population (%)
People in Group quarters - College dormitories (includes college quarters off campus) (%)
People in Group quarters - Military quarters (%)
People in Group quarters - On base (%)
People in Group quarters - Barracks, unaccompanied personnel housing (UPH), (Enlisted/Officer), ;and similar group living quarters for military personnel (%)
People in Group quarters - Transient quarters for temporary residents (%)
People in Group quarters - Military ships (%)
People in Group quarters - Group homes (%)
People in Group quarters - Homes or halfway houses for drug/alcohol abuse (%)
People in Group quarters - Homes for the mentally ill (%)
People in Group quarters - Homes for the mentally retarded (%)
People in Group quarters - Homes for the physically handicapped (%)
People in Group quarters - Other group homes (%)
People in Group quarters - Religious group quarters (%)
People in Group quarters - Dormitories (%)
People in Group quarters - Agriculture workers' dormitories on farms (%)
People in Group quarters - Job Corps and vocational training facilities (%)
People in Group quarters - Other workers' dormitories (%)
People in Group quarters - Crews of maritime vessels (%)
People in Group quarters - Other nonhousehold living situations (%)
People in Group quarters - Other noninstitutional group quarters (%)
Residents speaking English at home (%)
Residents speaking English at home - Born in the United States (%)
Residents speaking English at home - Native, born elsewhere (%)
Residents speaking English at home - Foreign born (%)
Residents speaking Spanish at home (%)
Residents speaking Spanish at home - Born in the United States (%)
Residents speaking Spanish at home - Native, born elsewhere (%)
Residents speaking Spanish at home - Foreign born (%)
Residents speaking other language at home (%)
Residents speaking other language at home - Born in the United States (%)
Residents speaking other language at home - Native, born elsewhere (%)
Residents speaking other language at home - Foreign born (%)
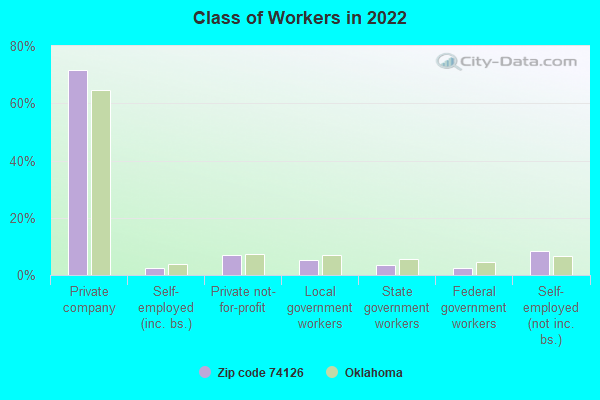
Class of Workers - Employee of private company (%)
Class of Workers - Self-employed in own incorporated business (%)
Class of Workers - Private not-for-profit wage and salary workers (%)
Class of Workers - Local government workers (%)
Class of Workers - State government workers (%)
Class of Workers - Federal government workers (%)
Class of Workers - Self-employed workers in own not incorporated business and Unpaid family workers (%)
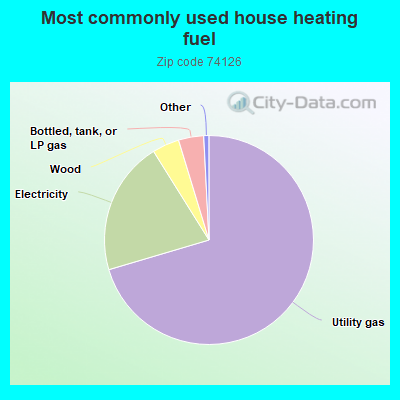
House heating fuel used in houses and condos - Utility gas (%)
House heating fuel used in houses and condos - Bottled, tank, or LP gas (%)
House heating fuel used in houses and condos - Electricity (%)
House heating fuel used in houses and condos - Fuel oil, kerosene, etc. (%)
House heating fuel used in houses and condos - Coal or coke (%)
House heating fuel used in houses and condos - Wood (%)
House heating fuel used in houses and condos - Solar energy (%)
House heating fuel used in houses and condos - Other fuel (%)
House heating fuel used in houses and condos - No fuel used (%)
House heating fuel used in apartments - Utility gas (%)
House heating fuel used in apartments - Bottled, tank, or LP gas (%)
House heating fuel used in apartments - Electricity (%)
House heating fuel used in apartments - Fuel oil, kerosene, etc. (%)
House heating fuel used in apartments - Coal or coke (%)
House heating fuel used in apartments - Wood (%)
House heating fuel used in apartments - Solar energy (%)
House heating fuel used in apartments - Other fuel (%)
House heating fuel used in apartments - No fuel used (%)
Armed forces status - In Armed Forces (%)
Armed forces status - Civilian (%)
Armed forces status - Civilian - Veteran (%)
Armed forces status - Civilian - Nonveteran (%)
Fatal accidents locations in years 2005-2021
Fatal accidents locations in 2005
Fatal accidents locations in 2006
Fatal accidents locations in 2007
Fatal accidents locations in 2008
Fatal accidents locations in 2009
Fatal accidents locations in 2010
Fatal accidents locations in 2011
Fatal accidents locations in 2012
Fatal accidents locations in 2013
Fatal accidents locations in 2014
Fatal accidents locations in 2015
Fatal accidents locations in 2016
Fatal accidents locations in 2017
Fatal accidents locations in 2018
Fatal accidents locations in 2019
Fatal accidents locations in 2020
Fatal accidents locations in 2021
Alcohol use - People drinking some alcohol every month (%)
Alcohol use - People not drinking at all (%)
Alcohol use - Average days/month drinking alcohol
Alcohol use - Average drinks/week
Alcohol use - Average days/year people drink much
Audiometry - Average condition of hearing (%)
Audiometry - People that can hear a whisper from across a quiet room (%)
Audiometry - People that can hear normal voice from across a quiet room (%)
Audiometry - Ears ringing, roaring, buzzing (%)
Audiometry - Had a job exposure to loud noise (%)
Audiometry - Had off-work exposure to loud noise (%)
Blood Pressure & Cholesterol - Has high blood pressure (%)
Blood Pressure & Cholesterol - Checking blood pressure at home (%)
Blood Pressure & Cholesterol - Frequently checking blood cholesterol (%)
Blood Pressure & Cholesterol - Has high cholesterol level (%)
Consumer Behavior - Money monthly spent on food at supermarket/grocery store
Consumer Behavior - Money monthly spent on food at other stores
Consumer Behavior - Money monthly spent on eating out
Consumer Behavior - Money monthly spent on carryout/delivered foods
Consumer Behavior - Income spent on food at supermarket/grocery store (%)
Consumer Behavior - Income spent on food at other stores (%)
Consumer Behavior - Income spent on eating out (%)
Consumer Behavior - Income spent on carryout/delivered foods (%)
Current Health Status - General health condition (%)
Current Health Status - Blood donors (%)
Current Health Status - Has blood ever tested for HIV virus (%)
Current Health Status - Left-handed people (%)
Dermatology - People using sunscreen (%)
Diabetes - Diabetics (%)
Diabetes - Had a blood test for high blood sugar (%)
Diabetes - People taking insulin (%)
Diet Behavior & Nutrition - Diet health (%)
Diet Behavior & Nutrition - Milk product consumption (# of products/month)
Diet Behavior & Nutrition - Meals not home prepared (#/week)
Diet Behavior & Nutrition - Meals from fast food or pizza place (#/week)
Diet Behavior & Nutrition - Ready-to-eat foods (#/month)
Diet Behavior & Nutrition - Frozen meals/pizza (#/month)
Drug Use - People that ever used marijuana or hashish (%)
Drug Use - Ever used hard drugs (%)
Drug Use - Ever used any form of cocaine (%)
Drug Use - Ever used heroin (%)
Drug Use - Ever used methamphetamine (%)
Health Insurance - People covered by health insurance (%)
Kidney Conditions-Urology - Avg. # of times urinating at night
Medical Conditions - People with asthma (%)
Medical Conditions - People with anemia (%)
Medical Conditions - People with psoriasis (%)
Medical Conditions - People with overweight (%)
Medical Conditions - Elderly people having difficulties in thinking or remembering (%)
Medical Conditions - People who ever received blood transfusion (%)
Medical Conditions - People having trouble seeing even with glass/contacts (%)
Medical Conditions - People with arthritis (%)
Medical Conditions - People with gout (%)
Medical Conditions - People with congestive heart failure (%)
Medical Conditions - People with coronary heart disease (%)
Medical Conditions - People with angina pectoris (%)
Medical Conditions - People who ever had heart attack (%)
Medical Conditions - People who ever had stroke (%)
Medical Conditions - People with emphysema (%)
Medical Conditions - People with thyroid problem (%)
Medical Conditions - People with chronic bronchitis (%)
Medical Conditions - People with any liver condition (%)
Medical Conditions - People who ever had cancer or malignancy (%)
Mental Health - People who have little interest in doing things (%)
Mental Health - People feeling down, depressed, or hopeless (%)
Mental Health - People who have trouble sleeping or sleeping too much (%)
Mental Health - People feeling tired or having little energy (%)
Mental Health - People with poor appetite or overeating (%)
Mental Health - People feeling bad about themself (%)
Mental Health - People who have trouble concentrating on things (%)
Mental Health - People moving or speaking slowly or too fast (%)
Mental Health - People having thoughts they would be better off dead (%)
Oral Health - Average years since last visit a dentist
Oral Health - People embarrassed because of mouth (%)
Oral Health - People with gum disease (%)
Oral Health - General health of teeth and gums (%)
Oral Health - Average days a week using dental floss/device
Oral Health - Average days a week using mouthwash for dental problem
Oral Health - Average number of teeth
Pesticide Use - Households using pesticides to control insects (%)
Pesticide Use - Households using pesticides to kill weeds (%)
Physical Activity - People doing vigorous-intensity work activities (%)
Physical Activity - People doing moderate-intensity work activities (%)
Physical Activity - People walking or bicycling (%)
Physical Activity - People doing vigorous-intensity recreational activities (%)
Physical Activity - People doing moderate-intensity recreational activities (%)
Physical Activity - Average hours a day doing sedentary activities
Physical Activity - Average hours a day watching TV or videos
Physical Activity - Average hours a day using computer
Physical Functioning - People having limitations keeping them from working (%)
Physical Functioning - People limited in amount of work they can do (%)
Physical Functioning - People that need special equipment to walk (%)
Physical Functioning - People experiencing confusion/memory problems (%)
Physical Functioning - People requiring special healthcare equipment (%)
Prescription Medications - Average number of prescription medicines taking
Preventive Aspirin Use - Adults 40+ taking low-dose aspirin (%)
Reproductive Health - Vaginal deliveries (%)
Reproductive Health - Cesarean deliveries (%)
Reproductive Health - Deliveries resulted in a live birth (%)
Reproductive Health - Pregnancies resulted in a delivery (%)
Reproductive Health - Women breastfeeding newborns (%)
Reproductive Health - Women that had a hysterectomy (%)
Reproductive Health - Women that had both ovaries removed (%)
Reproductive Health - Women that have ever taken birth control pills (%)
Reproductive Health - Women taking birth control pills (%)
Reproductive Health - Women that have ever used Depo-Provera or injectables (%)
Reproductive Health - Women that have ever used female hormones (%)
Sexual Behavior - People 18+ that ever had sex (vaginal, anal, or oral) (%)
Sexual Behavior - Males 18+ that ever had vaginal sex with a woman (%)
Sexual Behavior - Males 18+ that ever performed oral sex on a woman (%)
Sexual Behavior - Males 18+ that ever had anal sex with a woman (%)
Sexual Behavior - Males 18+ that ever had any sex with a man (%)
Sexual Behavior - Females 18+ that ever had vaginal sex with a man (%)
Sexual Behavior - Females 18+ that ever performed oral sex on a man (%)
Sexual Behavior - Females 18+ that ever had anal sex with a man (%)
Sexual Behavior - Females 18+ that ever had any kind of sex with a woman (%)
Sexual Behavior - Average age people first had sex
Sexual Behavior - Average number of female sex partners in lifetime (males 18+)
Sexual Behavior - Average number of female vaginal sex partners in lifetime (males 18+)
Sexual Behavior - Average age people first performed oral sex on a woman (18+)
Sexual Behavior - Average number of woman performed oral sex on in lifetime (18+)
Sexual Behavior - Average number of male sex partners in lifetime (males 18+)
Sexual Behavior - Average number of male anal sex partners in lifetime (males 18+)
Sexual Behavior - Average age people first performed oral sex on a man (18+)
Sexual Behavior - Average number of male oral sex partners in lifetime (18+)
Sexual Behavior - People using protection when performing oral sex (%)
Sexual Behavior - Average number of times people have vaginal or anal sex a year
Sexual Behavior - People having sex without condom (%)
Sexual Behavior - Average number of male sex partners in lifetime (females 18+)
Sexual Behavior - Average number of male vaginal sex partners in lifetime (females 18+)
Sexual Behavior - Average number of female sex partners in lifetime (females 18+)
Sexual Behavior - Circumcised males 18+ (%)
Sleep Disorders - Average hours sleeping at night
Sleep Disorders - People that has trouble sleeping (%)
Smoking-Cigarette Use - People smoking cigarettes (%)
Taste & Smell - People 40+ having problems with smell (%)
Taste & Smell - People 40+ having problems with taste (%)
Taste & Smell - People 40+ that ever had wisdom teeth removed (%)
Taste & Smell - People 40+ that ever had tonsils teeth removed (%)
Taste & Smell - People 40+ that ever had a loss of consciousness because of a head injury (%)
Taste & Smell - People 40+ that ever had a broken nose or other serious injury to face or skull (%)
Taste & Smell - People 40+ that ever had two or more sinus infections (%)
Weight - Average height (inches)
Weight - Average weight (pounds)
Weight - Average BMI
Weight - People that are obese (%)
Weight - People that ever were obese (%)
Weight - People trying to lose weight (%)
Urban population: 10,199
Rural population: 374
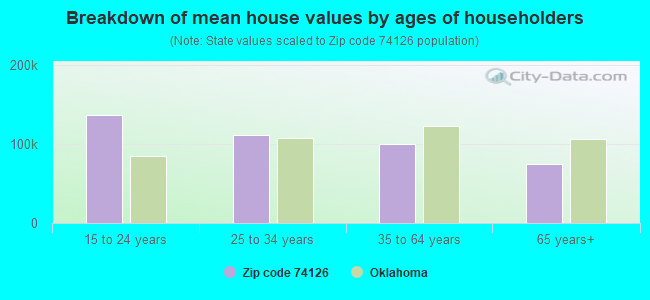
Estimated median house/condo value in 2022: $67,685
74126:
$67,685Oklahoma:
$191,700
Median resident age: This zip code:
33.0 yearsOklahoma median age:
37.1 years
Average household size: This zip code:
2.7 peopleOklahoma:
2.5 people
Averages for the 2020 tax year for zip code 74126, filed in 2021:
Average Adjusted Gross Income (AGI) in 2020: $27,570 (Individual Income Tax Returns) Here:
$27,570State:
$63,060
Salary/wage: $25,835 (reported on 84.6% of returns )Here:
$25,835State:
$52,427
(% of AGI for various income ranges: 1044.5% for AGIs below $25k , 3493.3% for AGIs $25k-50k , 6984.0% for AGIs $50k-75k , 10678.6% for AGIs $75k-100k , 19963.3% for AGIs $100k-200k ) Taxable interest for individuals: $215 (reported on 8.0% of returns )This zip code:
$215Oklahoma:
$1,603
(% of AGI for various income ranges: 0.9% for AGIs below $25k , 1.4% for AGIs $25k-50k , 8.0% for AGIs $50k-75k , 10.0% for AGIs $75k-100k , 40.0% for AGIs $100k-200k ) Ordinary dividends: $700 (reported on 1.7% of returns )(% of AGI for various income ranges: 2.0% for AGIs $25k-50k , 38.6% for AGIs $75k-100k ) Net capital gain/loss in AGI: +$1,171 (reported on 1.7% of returns )Here:
+$1,171State:
+$19,855
(% of AGI for various income ranges: 1.1% for AGIs below $25k , 24.4% for AGIs $50k-75k ) Profit/loss from business: +$6,763 (reported on 15.9% of returns )Here:
+$6,763State:
+$9,904
(% of AGI for various income ranges: 155.8% for AGIs below $25k , 91.6% for AGIs $25k-50k , 105.6% for AGIs $50k-75k , 198.6% for AGIs $75k-100k ) Taxable individual retirement arrangement distribution: $8,355 (reported on 2.7% of returns )74126:
$8,355Oklahoma:
$20,476
(% of AGI for various income ranges: 11.3% for AGIs below $25k , 21.4% for AGIs $25k-50k , 186.0% for AGIs $50k-75k ) Total itemized deductions: $34,150 (reported on 1.5% of returns )Here:
$34,150State:
$39,736
(% of AGI for various income ranges: 86.8% for AGIs $25k-50k , 434.4% for AGIs $50k-75k ) Charity contributions: $11,000 (reported on 1.0% of returns )Here:
$11,000State:
$17,288
(% of AGI for various income ranges: 176.0% for AGIs $50k-75k ) Taxes paid: $4,100 (reported on 1.2% of returns )(% of AGI for various income ranges: 2.6% for AGIs below $25k , 62.4% for AGIs $50k-75k ) Earned income credit: $2,939 (reported on 44.6% of returns )(% of AGI for various income ranges: 201.9% for AGIs below $25k , 137.1% for AGIs $25k-50k ) Percentage of individuals using paid preparers for their 2020 taxes: 93.9%(% for various income ranges: 94.6% for AGIs below $25k , 94.0% for AGIs $25k-50k , 88.9% for AGIs $50k-75k , 90.9% for AGIs $75k-100k , 100.0% for AGIs $100k-200k )
Averages for the 2012 tax year for zip code 74126, filed in 2013:
Average Adjusted Gross Income (AGI) in 2012: $25,193 (Individual Income Tax Returns) Here:
$25,193State:
$58,581
Salary/wage: $23,525 (reported on 88.9% of returns )Here:
$23,525State:
$45,973
(% of AGI for various income ranges: 80.8% for AGIs below $25k , 90.2% for AGIs $25k-50k , 78.9% for AGIs $50k-75k , 81.2% for AGIs $75k-100k , 66.2% for AGIs $100k-200k ) Taxable interest for individuals: $294 (reported on 9.0% of returns )This zip code:
$294Oklahoma:
$1,625
(% of AGI for various income ranges: 0.2% for AGIs below $25k , 0.2% for AGIs $100k-200k ) Ordinary dividends: $344 (reported on 2.4% of returns )(% of AGI for various income ranges: ) Net capital gain/loss in AGI: +$367 (reported on 1.6% of returns )Profit/loss from business: +$6,480 (reported on 13.0% of returns )Here:
+$6,480State:
+$11,913
(% of AGI for various income ranges: 10.2% for AGIs below $25k , 0.5% for AGIs $25k-50k ) Taxable individual retirement arrangement distribution: $10,658 (reported on 3.2% of returns )74126:
$10,658Oklahoma:
$15,242
(% of AGI for various income ranges: 0.7% for AGIs below $25k , 0.9% for AGIs $25k-50k , 5.2% for AGIs $50k-75k ) Total itemized deductions: $16,937 (30% of AGI, reported on 7.2% of returns )Here:
$16,937State:
$24,882
Here:
30.4% of AGIState:
18.8% of AGI
(% of AGI for various income ranges: 2.1% for AGIs below $25k , 3.9% for AGIs $25k-50k , 6.6% for AGIs $50k-75k , 8.3% for AGIs $75k-100k , 13.8% for AGIs $100k-200k ) Charity contributions: $4,696 (reported on 6.4% of returns )(% of AGI for various income ranges: 0.4% for AGIs below $25k , 0.9% for AGIs $25k-50k , 1.7% for AGIs $50k-75k , 2.3% for AGIs $75k-100k , 3.7% for AGIs $100k-200k ) Taxes paid: $3,048 (reported on 7.2% of returns )(% of AGI for various income ranges: 0.3% for AGIs below $25k , 0.5% for AGIs $25k-50k , 1.1% for AGIs $50k-75k , 1.8% for AGIs $75k-100k , 3.3% for AGIs $100k-200k ) Earned income credit: $2,754 (reported on 46.9% of returns )(% of AGI for various income ranges: 13.5% for AGIs below $25k , 2.2% for AGIs $25k-50k ) Percentage of individuals using paid preparers for their 2012 taxes: 46.4%(% for various income ranges: 44.9% for AGIs below $25k , 46.6% for AGIs $25k-50k , 52.0% for AGIs $50k-75k , 55.6% for AGIs $75k-100k , 66.7% for AGIs $100k-200k )
Averages for the 2004 tax year for zip code 74126, filed in 2005:
Average Adjusted Gross Income (AGI) in 2004: $20,641 (Individual Income Tax Returns) Here:
$20,641State:
$41,245
Salary/wage: $19,927 (reported on 90.0% of returns )Here:
$19,927State:
$35,318
(% of AGI for various income ranges: 81.6% for AGIs below $10k , 87.4% for AGIs $10k-25k , 90.4% for AGIs $25k-50k , 85.3% for AGIs $50k-75k , 79.1% for AGIs $75k-100k , 73.3% for AGIs over 100k ) Taxable interest for individuals: $610 (reported on 13.1% of returns )This zip code:
$610Oklahoma:
$1,745
(% of AGI for various income ranges: 1.1% for AGIs below $10k , 0.5% for AGIs $10k-25k , 0.3% for AGIs $25k-50k , 0.2% for AGIs $50k-75k , 0.1% for AGIs $75k-100k ) Taxable dividends: $387 (reported on 3.8% of returns )(% of AGI for various income ranges: 0.1% for AGIs below $10k , 0.1% for AGIs $10k-25k , 0.1% for AGIs $25k-50k , 0.1% for AGIs $50k-75k , 0.0% for AGIs $75k-100k ) Net capital gain/loss: +$930 (reported on 2.2% of returns )Profit/loss from business: +$4,902 (reported on 11.4% of returns )Here:
+$4,902State:
+$8,532
(% of AGI for various income ranges: 10.8% for AGIs below $10k , 5.0% for AGIs $10k-25k , 0.7% for AGIs $25k-50k , -0.5% for AGIs $50k-75k ) IRA payment deduction: $1,667 (reported on 0.5% of returns )74126:
$1,667Oklahoma:
$3,127
Total itemized deductions: $12,637 (29% of AGI, reported on 10.9% of returns )Here:
$12,637State:
$17,093
Here:
28.8% of AGIState:
20.5% of AGI
(% of AGI for various income ranges: 2.8% for AGIs below $10k , 3.4% for AGIs $10k-25k , 6.7% for AGIs $25k-50k , 12.0% for AGIs $50k-75k , 16.4% for AGIs $75k-100k , 11.0% for AGIs over 100k ) Charity contributions deductions: $3,929 (9% of AGI, reported on 9.2% of returns )Here:
8.6% of AGIState:
4.8% of AGI
(% of AGI for various income ranges: 0.5% for AGIs below $10k , 0.8% for AGIs $10k-25k , 1.8% for AGIs $25k-50k , 3.4% for AGIs $50k-75k , 4.1% for AGIs $75k-100k , 3.5% for AGIs over 100k ) Total tax: $2,143 (reported on 49.4% of returns )(% of AGI for various income ranges: 2.5% for AGIs below $10k , 2.7% for AGIs $10k-25k , 5.3% for AGIs $25k-50k , 8.8% for AGIs $50k-75k , 10.4% for AGIs $75k-100k , 11.3% for AGIs over 100k ) Earned income credit: $2,152 (reported on 51.6% of returns )Percentage of individuals using paid preparers for their 2004 taxes: 72.0%(% for various income ranges: 73.5% for AGIs below $10k , 75.0% for AGIs $10k-25k , 67.4% for AGIs $25k-50k , 60.4% for AGIs $50k-75k , 61.5% for AGIs $75k-100k , 73.3% for AGIs over 100k )
Estimated median household income in 2022: This zip code:
$38,418Oklahoma:
$59,673
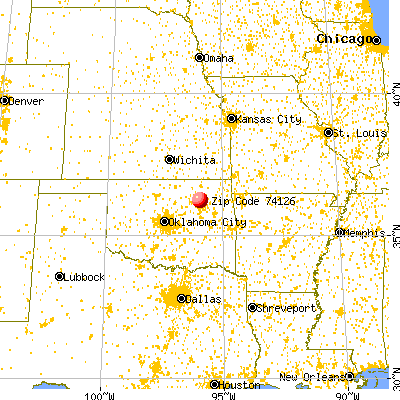
Nearest zip codes: 74073 ,
74106 ,
74130 ,
74127 ,
74110 ,
74103 .
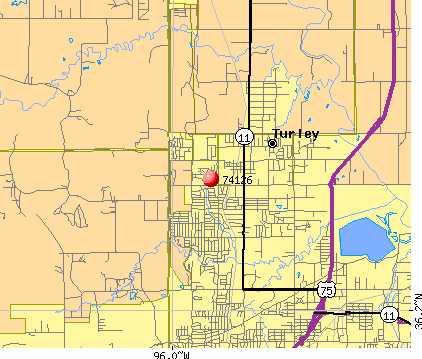
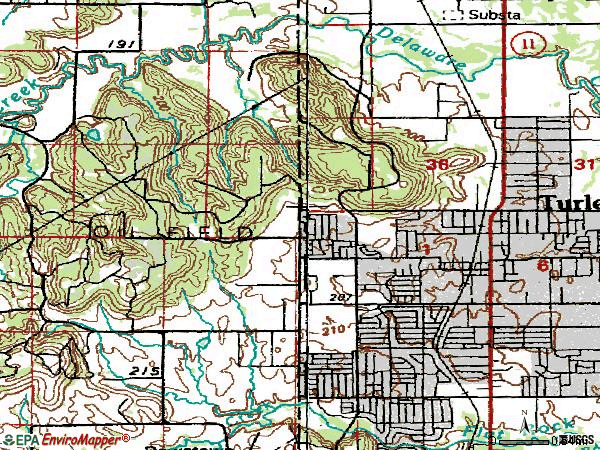
Turley Zip Code Map
Percentage of family households: This zip code:
47.8%Oklahoma:
47.1%
Percentage of households with unmarried partners: This zip code:
8.2%Oklahoma:
47.5%
Likely homosexual households (counted as self-reported same-sex unmarried-partner households)
Lesbian couples: 0.2% of all households Gay men: 0.0% of all households
Household received Food Stamps/SNAP in the past 12 months: 1,423Household did not receive Food Stamps/SNAP in the past 12 months: 2,567
Women who had a birth in the past 12 months: 96 (45 now married , 49 unmarried) Women who did not have a birth in the past 12 months: 2,586 (755 now married , 1,831 unmarried)
Housing units in zip code 74126 with a mortgage: 792 (43
second mortgage , 16
both second mortgage and home equity loan )
Median monthly owner costs for units with a mortgage: $1,028
Median monthly owner costs for units without a mortgage: $405
Residents with income below the poverty level in 2022:
This zip code:
34.0%Whole state:
15.7%
Residents with income below 50% of the poverty level in 2022:
This zip code:
16.9%Whole state:
8.3%
Median number of rooms in houses and condos: Median number of rooms in apartments: Notable locations in this zip code not listed on our city pages
Click to draw/clear zip code borders Notable locations in zip code 74126: (A) , Black Dog Fire Association (B) , Turley Fire and Rescue Company (C) . Display/hide their locations on the map
Shopping Centers: (1) , Northridge Shopping Center (2) . Display/hide their locations on the map
Churches in zip code 74126 include: (A) , True Holiness Church (B) , Timothy Baptist Church (C) , Saint Paul AME Church (D) , Kingdom Hall-Jehovahs Witness Church (E) , New Harvest Church of God (F) , New Hope Baptist Church (G) , North Cincinnati Christian Church (H) , Philippi Baptist Church (I) . Display/hide their locations on the map
Creek: (A) . Display/hide its location on the map
Parks in zip code 74126 include: (1) , County Park (2) . Display/hide their locations on the map
Year house built (houses)
0 2020 or later137 2010 to 2019171 2000 to 2009182 1990 to 1999217 1980 to 1989625 1970 to 19791,054 1960 to 19691,790 1950 to 1959322 1940 to 1949132 1939 or earlier
Zip code 74126 household income distribution in 2022 456 Less than $10,000264 $10,000 to $14,999204 $15,000 to $19,999264 $20,000 to $24,999300 $25,000 to $29,999276 $30,000 to $34,999254 $35,000 to $39,999188 $40,000 to $44,999216 $45,000 to $49,999354 $50,000 to $59,999347 $60,000 to $74,999382 $75,000 to $99,999197 $100,000 to $124,99986 $125,000 to $149,99950 $150,000 to $199,99944 $200,000 or moreEstimate of home value of owner-occupied houses/condos in 2022 in zip code 74126 58 Less than $10,00025 $10,000 to $14,99931 $15,000 to $19,99951 $20,000 to $24,99966 $25,000 to $29,99979 $30,000 to $34,99998 $35,000 to $39,999395 $40,000 to $49,999216 $50,000 to $59,999392 $60,000 to $69,999218 $70,000 to $79,99990 $80,000 to $89,99952 $90,000 to $99,99963 $100,000 to $124,99960 $125,000 to $149,99929 $150,000 to $174,99911 $175,000 to $199,99960 $200,000 to $249,99969 $250,000 to $299,99968 $300,000 to $399,9999 $400,000 to $499,9996 $500,000 to $749,99910 $750,000 to $999,999Rent paid by renters in 2022 in zip code 74126 41 Less than $10028 $100 to $1495 $200 to $24924 $250 to $29913 $300 to $34924 $350 to $39970 $400 to $44941 $450 to $499215 $500 to $549107 $550 to $599160 $600 to $64978 $650 to $699106 $700 to $749131 $750 to $799148 $800 to $89956 $900 to $99955 $1,000 to $1,2499 $1,250 to $1,49911 $1,500 to $1,999193 No cash rent
Median gross rent in 2022: $971.
Median price asked for vacant for-sale houses and condos in 2022: $125,411.
Estimated median house (or condo) value in 2022 for: White Non-Hispanic householders: $61,514Black or African American householders: $68,456American Indian or Alaska Native householders: $56,693Native Hawaiian and other Pacific Islander householders: $125,343Two or more races householders: $47,630Hispanic or Latino householders: $43,387Estimated median house or condo value in 2022: $67,685
74126:
$67,685Oklahoma:
$191,700
Lower value quartile - upper value quartile: $47,289 - $88,606
Mean price in 2022: Detached houses: $290,686Here:
$290,686State:
$255,409
Townhouses or other attached units: $185,256Here:
$185,256State:
$206,466
In 2-unit structures: $335,467Here:
$335,467State:
$195,100
In 3-to-4-unit structures: $188,091Here:
$188,091State:
$140,612
In 5-or-more-unit structures: $219,929Here:
$219,929State:
$233,805
Mobile homes: $76,648Here:
$76,648State:
$110,804
Occupied boats, RVs, vans, etc.: $75,962Here:
$75,962State:
$68,690
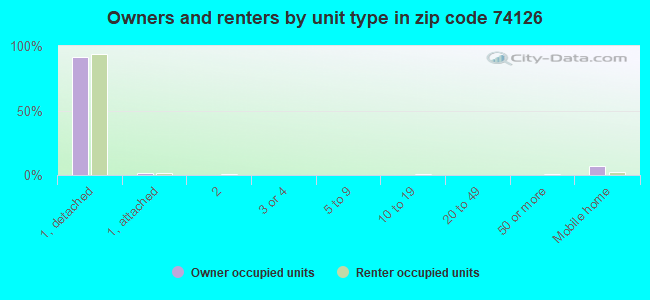
Housing units in structures:
One, detached: 4,493One, attached: 50Two: 2210 to 19: 550 or more: 19Mobile homes: 219Boats, RVs, vans, etc.: 3Unemployment : 8.5%
Means of transportation to work in zip code 74126 75.6% 3,008 Drove a car alone13.5% 535 Carpooled1.6% 63 Bus or trolley bus0.2% 6 Taxi1.2% 48 Walked1.7% 67 Other means4.8% 191 Worked at homeTravel time to work (commute) in zip code 74126 105 Less than 5 minutes212 5 to 9 minutes377 10 to 14 minutes819 15 to 19 minutes803 20 to 24 minutes307 25 to 29 minutes667 30 to 34 minutes49 35 to 39 minutes89 40 to 44 minutes111 45 to 59 minutes115 60 to 89 minutes81 90 or more minutes
Percentage of zip code residents living and working in this county: 85.9%
Household type by relationship:
Households: 10,574
Male householders: 1,606 (490 living alone ), Female householders: 2,265 (456 living alone )1,050 spouses (1,050 opposite-sex spouses ), 385 unmarried partners , (385 opposite-sex unmarried partners ), 3,782 children (3,619 natural , 45 adopted , 116 stepchildren ), 578 grandchildren , 131 brothers or sisters , 121 parents , 0 foster children , 226 other relatives , 224 non-relatives In group quarters: 165 (-1 institutionalized population )
Size of family households: 1,136 2-persons , 553 3-persons , 384 4-persons , 269 5-persons , 177 6-persons , 91 7-or-more-persons
Size of nonfamily households: 946 1-person , 288 2-persons , 14 3-persons , 5 4-persons
669 married couples with children. single-parent households (232 men , 1,550 women ).
87.2% of residents of 74126 zip code speak English at home. of residents speak Spanish at home (65% very well, 18% well, 13% not well, 5% not at all ).of residents speak other Indo-European language at home (43% very well, 57% well ).of residents speak Asian or Pacific Island language at home (71% very well, 15% well, 14% not well ).of residents speak other language at home (50% very well, 50% not well ).
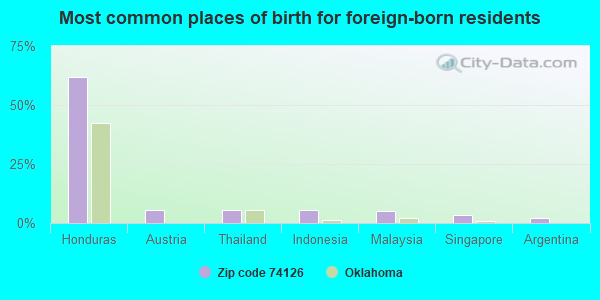
Foreign born population: 499 (4.7%)
(29.6%
of them are naturalized citizens )
This zip code:
4.7%Whole state:
6.0%
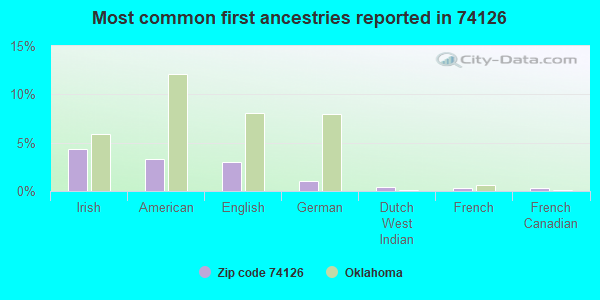
62% Honduras 6% Austria 6% Thailand 5% Indonesia 5% Malaysia 3% Singapore 2% Argentina 4% Irish 3% American 3% English 1% German 0% Dutch West Indian 0% French 0% French Canadian
Year of entry for the foreign-born population
172 2010 or later 171 2000 to 2009 123 1990 to 1999 72 Before 1990
Facilities with environmental interests located in this zip code:
ALCOTT ES (525 E. 46TH N. in TULSA, OK)
(National Center for Education Statistics) - STATE ID-72-I001-110 Organizations: TULSA (SCHOOL DISTRICT)
CHEROKEE ES (6001 N. PEORIA in TULSA, OK)
(National Center for Education Statistics) - STATE ID-72-I001-150 Organizations: TULSA (SCHOOL DISTRICT)
GILCREASE IS (5550 N. CINCINNATI AVE in TULSA, OK)
(National Center for Education Statistics) - STATE ID-72-I001-539 Organizations: TULSA (SCHOOL DISTRICT)
GREELEY ES (105 E. 63RD ST N. in TULSA, OK)
(National Center for Education Statistics) - STATE ID-72-I001-197 Organizations: TULSA (SCHOOL DISTRICT)
AT & T NETWORK SYSTEMS (510 S ELGIN RME1118 in TULSA, OK)
(Resource Conservation and Recovery Act (tracking hazardous waste)) Organizations: AT&T NETWORK SYSTEM (CONTACT/OWNER)
Housing units lacking complete plumbing facilities: 7.3%
Housing units lacking complete kitchen facilities: 12.4%
70.5% Utility gas 20.7% Electricity 4.2% Wood 3.9% Bottled, tank, or LP gas
Population in 1990: 13,636.
Place of birth for U.S.-born residents:
This state: 7,114Northeast: 76Midwest: 798South: 1,002West: 1,042
54% of the 74126 zip code residents lived in the same house 5 years ago.
Out of people who lived in different houses, 87% lived in this county.
Out of people who lived in different counties, 50% lived in Oklahoma.
88% of the 74126 zip code residents lived in the same house 1 year ago.
Out of people who lived in different houses, 61% moved from this county.
Out of people who lived in different houses, 23% moved from different county within same state.
Out of people who lived in different houses, 12% moved from different state.
Out of people who lived in different houses, 1% moved from abroad.
Private vs. public school enrollment:
Students in private schools in grades 1 to 8 (elementary and middle school): 127
Students in private schools in grades 9 to 12 (high school): 68
Students in private undergraduate colleges: 23
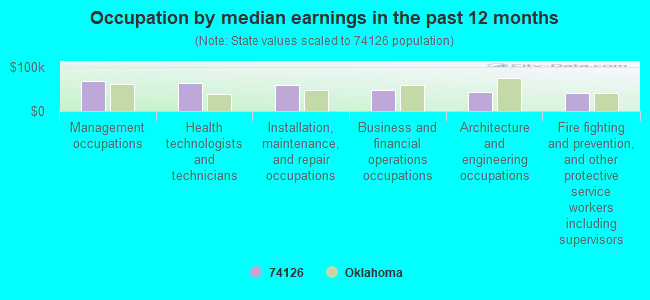
Occupation by median earnings in the past 12 months ($)
67,702 Management occupations 64,789 Health technologists and technicians 58,878 Installation, maintenance, and repair occupations 48,591 Business and financial operations occupations 43,800 Architecture and engineering occupations 41,731 Fire fighting and prevention, and other protective service workers including supervisors
Top industries in this zip code by the number of employees in 2005:
Accommodation and Food Services: Limited-Service Restaurants (10-19 employees: 2 establishments, 5-9 employees: 1 establishment, 1-4 employees: 2 establishments)Accommodation and Food Services: Full-Service Restaurants (20-49: 1, 1-4: 1)Finance and Insurance: Commercial Banking (20-49: 1)Health Care and Social Assistance: Other Individual and Family Services (20-49: 1)Health Care and Social Assistance: Other Residential Care Facilities (20-49: 1)Administrative and Support and Waste Management and Remediation Services: Janitorial Services (20-49: 1)
People in group quarters in 2010:
139 people in correctional residential facilities
5 people in nursing facilities/skilled-nursing facilities
Fatal accident statistics in 2014:
Fatal accident count: 2Vehicles involved in fatal accidents: 2Fatal accidents caused by drunken drivers: 0Fatalities: 2Persons involved in fatal accidents: 2Pedestrians involved in fatal accidents: 0
Fatal accident statistics in 2013:
Fatal accident count: 1Vehicles involved in fatal accidents: 2Fatal accidents caused by drunken drivers: 0Fatalities: 1Persons involved in fatal accidents: 2Pedestrians involved in fatal accidents: 0
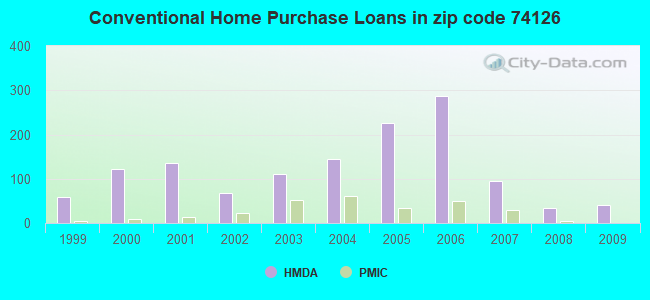
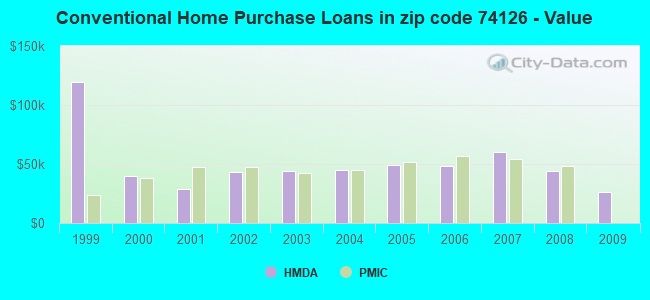
Home Mortgage Disclosure Act Aggregated Statistics For Year 2009(Based on 2 full and 6 partial tracts) A) FHA, FSA/RHS & VA B) Conventional C) Refinancings D) Home Improvement Loans F) Non-occupant Loans on G) Loans On Manufactured Number Average Value Number Average Value Number Average Value Number Average Value Number Average Value Number Average Value
LOANS ORIGINATED 13 $53,068 41 $26,610 34 $74,045 10 $45,226 41 $25,780 3 $89,523 APPLICATIONS APPROVED, NOT ACCEPTED 3 $48,807 0 $0 6 $73,470 0 $0 0 $0 0 $0 APPLICATIONS DENIED 9 $40,720 18 $44,783 68 $56,694 26 $30,588 13 $38,031 4 $57,355 APPLICATIONS WITHDRAWN 1 $72,060 10 $15,648 21 $59,809 0 $0 8 $5,746 0 $0 FILES CLOSED FOR INCOMPLETENESS 2 $54,945 0 $0 2 $65,370 0 $0 0 $0 0 $0
Aggregated Statistics For Year 2008(Based on 2 full and 6 partial tracts) A) FHA, FSA/RHS & VA B) Conventional C) Refinancings D) Home Improvement Loans F) Non-occupant Loans on G) Loans On Manufactured Number Average Value Number Average Value Number Average Value Number Average Value Number Average Value Number Average Value
LOANS ORIGINATED 11 $71,532 35 $44,418 59 $71,410 26 $20,084 48 $67,878 4 $46,142 APPLICATIONS APPROVED, NOT ACCEPTED 0 $0 7 $79,759 21 $39,526 2 $25,055 13 $35,482 0 $0 APPLICATIONS DENIED 2 $88,620 18 $56,383 150 $57,136 81 $20,881 39 $42,671 1 $36,990 APPLICATIONS WITHDRAWN 3 $16,973 1 $23,950 36 $67,782 9 $44,937 16 $38,616 2 $5,340 FILES CLOSED FOR INCOMPLETENESS 2 $46,520 6 $69,925 15 $57,473 0 $0 9 $45,262 0 $0
Aggregated Statistics For Year 2007(Based on 2 full and 6 partial tracts) A) FHA, FSA/RHS & VA B) Conventional C) Refinancings D) Home Improvement Loans F) Non-occupant Loans on G) Loans On Manufactured Number Average Value Number Average Value Number Average Value Number Average Value Number Average Value Number Average Value
LOANS ORIGINATED 2 $86,935 94 $59,781 98 $60,775 22 $20,267 99 $53,200 1 $40,350 APPLICATIONS APPROVED, NOT ACCEPTED 0 $0 22 $53,585 33 $53,785 10 $19,819 16 $53,603 6 $63,810 APPLICATIONS DENIED 0 $0 106 $51,285 201 $54,658 74 $23,498 80 $45,457 10 $42,186 APPLICATIONS WITHDRAWN 0 $0 24 $50,657 70 $58,284 11 $46,997 21 $41,633 2 $55,615 FILES CLOSED FOR INCOMPLETENESS 0 $0 7 $48,359 18 $55,909 2 $15,250 6 $33,943 0 $0
Aggregated Statistics For Year 2006(Based on 2 full and 6 partial tracts) A) FHA, FSA/RHS & VA B) Conventional C) Refinancings D) Home Improvement Loans F) Non-occupant Loans on G) Loans On Manufactured Number Average Value Number Average Value Number Average Value Number Average Value Number Average Value Number Average Value
LOANS ORIGINATED 1 $49,240 288 $48,507 165 $49,661 41 $23,891 286 $44,891 8 $48,312 APPLICATIONS APPROVED, NOT ACCEPTED 0 $0 26 $57,042 58 $50,289 7 $40,671 24 $48,302 9 $30,243 APPLICATIONS DENIED 2 $39,310 164 $49,063 324 $53,565 94 $30,826 170 $46,543 10 $49,921 APPLICATIONS WITHDRAWN 0 $0 43 $48,682 135 $58,181 14 $46,107 38 $47,978 0 $0 FILES CLOSED FOR INCOMPLETENESS 0 $0 4 $55,445 20 $63,472 0 $0 9 $47,717 0 $0
Aggregated Statistics For Year 2005(Based on 2 full and 6 partial tracts) A) FHA, FSA/RHS & VA B) Conventional C) Refinancings D) Home Improvement Loans F) Non-occupant Loans on G) Loans On Manufactured Number Average Value Number Average Value Number Average Value Number Average Value Number Average Value Number Average Value
LOANS ORIGINATED 3 $47,747 225 $49,017 238 $51,880 60 $34,847 265 $51,370 0 $0 APPLICATIONS APPROVED, NOT ACCEPTED 0 $0 34 $52,758 51 $42,921 19 $31,248 17 $38,324 9 $38,537 APPLICATIONS DENIED 2 $49,950 119 $47,196 398 $52,519 104 $30,779 116 $45,580 14 $48,224 APPLICATIONS WITHDRAWN 4 $51,595 51 $61,626 205 $58,460 45 $64,476 44 $52,062 3 $64,567 FILES CLOSED FOR INCOMPLETENESS 0 $0 8 $53,645 14 $58,567 0 $0 3 $32,090 0 $0
Aggregated Statistics For Year 2004(Based on 2 full and 6 partial tracts) A) FHA, FSA/RHS & VA B) Conventional C) Refinancings D) Home Improvement Loans F) Non-occupant Loans on G) Loans On Manufactured Number Average Value Number Average Value Number Average Value Number Average Value Number Average Value Number Average Value
LOANS ORIGINATED 14 $41,958 145 $44,760 263 $58,273 49 $25,637 161 $61,725 17 $49,563 APPLICATIONS APPROVED, NOT ACCEPTED 0 $0 31 $51,157 78 $51,554 14 $32,391 16 $43,571 7 $33,980 APPLICATIONS DENIED 7 $42,771 92 $43,461 371 $51,960 106 $24,074 69 $36,742 26 $44,634 APPLICATIONS WITHDRAWN 2 $169,445 27 $56,981 175 $57,611 24 $39,049 28 $52,261 3 $122,777 FILES CLOSED FOR INCOMPLETENESS 0 $0 7 $48,709 8 $49,002 0 $0 4 $36,962 0 $0
Aggregated Statistics For Year 2003(Based on 2 full and 6 partial tracts) A) FHA, FSA/RHS & VA B) Conventional C) Refinancings D) Home Improvement Loans F) Non-occupant Loans on Number Average Value Number Average Value Number Average Value Number Average Value Number Average Value
LOANS ORIGINATED 13 $71,262 111 $43,710 264 $46,343 39 $22,120 143 $39,430 APPLICATIONS APPROVED, NOT ACCEPTED 0 $0 34 $41,873 77 $50,541 6 $28,972 44 $40,854 APPLICATIONS DENIED 2 $14,490 88 $45,954 428 $47,601 72 $15,146 106 $42,492 APPLICATIONS WITHDRAWN 2 $41,180 16 $34,645 156 $51,157 3 $16,160 25 $30,154 FILES CLOSED FOR INCOMPLETENESS 1 $31,060 13 $44,415 17 $52,455 0 $0 12 $38,542
Aggregated Statistics For Year 2002(Based on 2 full and 4 partial tracts) A) FHA, FSA/RHS & VA B) Conventional C) Refinancings D) Home Improvement Loans F) Non-occupant Loans on Number Average Value Number Average Value Number Average Value Number Average Value Number Average Value
LOANS ORIGINATED 11 $45,165 67 $43,428 176 $38,651 48 $17,443 85 $31,771 APPLICATIONS APPROVED, NOT ACCEPTED 0 $0 28 $46,280 92 $39,841 4 $12,778 17 $36,048 APPLICATIONS DENIED 4 $40,562 143 $495,578 322 $43,138 59 $14,150 144 $483,375 APPLICATIONS WITHDRAWN 2 $73,970 15 $39,903 202 $43,109 16 $14,900 8 $43,418 FILES CLOSED FOR INCOMPLETENESS 0 $0 13 $40,946 38 $78,594 0 $0 12 $33,616
Aggregated Statistics For Year 2001(Based on 2 full and 4 partial tracts) A) FHA, FSA/RHS & VA B) Conventional C) Refinancings D) Home Improvement Loans F) Non-occupant Loans on Number Average Value Number Average Value Number Average Value Number Average Value Number Average Value
LOANS ORIGINATED 27 $43,542 135 $28,486 219 $39,955 45 $11,769 157 $23,579 APPLICATIONS APPROVED, NOT ACCEPTED 0 $0 32 $37,105 86 $39,632 6 $23,235 17 $33,186 APPLICATIONS DENIED 2 $28,970 72 $34,695 378 $42,807 78 $16,088 30 $28,515 APPLICATIONS WITHDRAWN 1 $28,740 22 $33,905 233 $43,107 19 $17,729 18 $31,543 FILES CLOSED FOR INCOMPLETENESS 0 $0 7 $31,081 19 $44,372 4 $23,718 5 $28,872
Aggregated Statistics For Year 2000(Based on 2 full and 4 partial tracts) A) FHA, FSA/RHS & VA B) Conventional C) Refinancings D) Home Improvement Loans F) Non-occupant Loans on Number Average Value Number Average Value Number Average Value Number Average Value Number Average Value
LOANS ORIGINATED 23 $47,415 122 $39,503 199 $36,389 53 $15,753 67 $33,613 APPLICATIONS APPROVED, NOT ACCEPTED 5 $39,136 33 $47,209 97 $38,590 24 $20,739 8 $21,642 APPLICATIONS DENIED 7 $70,581 129 $35,199 236 $35,653 79 $11,756 62 $28,756 APPLICATIONS WITHDRAWN 4 $28,795 33 $57,969 137 $38,705 6 $27,193 6 $41,625 FILES CLOSED FOR INCOMPLETENESS 0 $0 11 $39,878 38 $44,666 0 $0 3 $21,860
Aggregated Statistics For Year 1999(Based on 1 full and 3 partial tracts) A) FHA, FSA/RHS & VA B) Conventional C) Refinancings D) Home Improvement Loans F) Non-occupant Loans on Number Average Value Number Average Value Number Average Value Number Average Value Number Average Value
LOANS ORIGINATED 6 $36,440 59 $119,908 136 $32,292 35 $16,995 61 $23,350 APPLICATIONS APPROVED, NOT ACCEPTED 1 $18,900 18 $34,492 55 $31,341 15 $15,241 11 $21,314 APPLICATIONS DENIED 4 $30,198 90 $32,496 127 $31,258 55 $13,045 48 $24,829 APPLICATIONS WITHDRAWN 2 $38,175 15 $27,232 68 $33,500 8 $20,761 7 $21,810 FILES CLOSED FOR INCOMPLETENESS 0 $0 4 $41,400 25 $34,967 3 $22,573 1 $37,430
Detailed HMDA statistics for the following Tracts:
0057.00
,
0079.00 ,
0091.01 ,
0091.04
Private Mortgage Insurance Companies Aggregated Statistics For Year 2009(Based on 4 partial tracts) A) Conventional B) Refinancings Number Average Value Number Average Value
LOANS ORIGINATED 0 $0 1 $102,790 APPLICATIONS APPROVED, NOT ACCEPTED 1 $11,380 0 $0 APPLICATIONS DENIED 0 $0 0 $0 APPLICATIONS WITHDRAWN 0 $0 0 $0 FILES CLOSED FOR INCOMPLETENESS 0 $0 0 $0
Aggregated Statistics For Year 2008(Based on 2 full and 6 partial tracts) A) Conventional B) Refinancings C) Non-occupant Loans on Number Average Value Number Average Value Number Average Value
LOANS ORIGINATED 4 $47,905 1 $92,180 2 $57,940 APPLICATIONS APPROVED, NOT ACCEPTED 5 $44,380 11 $61,754 8 $42,569 APPLICATIONS DENIED 0 $0 0 $0 0 $0 APPLICATIONS WITHDRAWN 0 $0 0 $0 0 $0 FILES CLOSED FOR INCOMPLETENESS 0 $0 0 $0 0 $0
Aggregated Statistics For Year 2007(Based on 2 full and 6 partial tracts) A) Conventional B) Refinancings C) Non-occupant Loans on Number Average Value Number Average Value Number Average Value
LOANS ORIGINATED 29 $54,133 6 $59,415 16 $43,065 APPLICATIONS APPROVED, NOT ACCEPTED 6 $56,390 0 $0 2 $17,980 APPLICATIONS DENIED 3 $93,037 0 $0 0 $0 APPLICATIONS WITHDRAWN 1 $49,100 0 $0 0 $0 FILES CLOSED FOR INCOMPLETENESS 0 $0 0 $0 0 $0
Aggregated Statistics For Year 2006(Based on 2 full and 6 partial tracts) A) Conventional B) Refinancings C) Non-occupant Loans on Number Average Value Number Average Value Number Average Value
LOANS ORIGINATED 50 $56,922 21 $51,814 37 $53,617 APPLICATIONS APPROVED, NOT ACCEPTED 8 $44,868 9 $57,022 8 $55,316 APPLICATIONS DENIED 0 $0 2 $42,955 2 $42,955 APPLICATIONS WITHDRAWN 0 $0 0 $0 0 $0 FILES CLOSED FOR INCOMPLETENESS 0 $0 0 $0 0 $0
Aggregated Statistics For Year 2005(Based on 2 full and 6 partial tracts) A) Conventional B) Refinancings C) Non-occupant Loans on Number Average Value Number Average Value Number Average Value
LOANS ORIGINATED 34 $51,696 22 $60,908 36 $54,214 APPLICATIONS APPROVED, NOT ACCEPTED 2 $30,505 0 $0 0 $0 APPLICATIONS DENIED 2 $58,940 0 $0 2 $58,940 APPLICATIONS WITHDRAWN 2 $59,940 2 $48,950 4 $54,445 FILES CLOSED FOR INCOMPLETENESS 0 $0 0 $0 0 $0
Aggregated Statistics For Year 2004(Based on 2 full and 6 partial tracts) A) Conventional B) Refinancings C) Non-occupant Loans on D) Loans On Manufactured Number Average Value Number Average Value Number Average Value Number Average Value
LOANS ORIGINATED 61 $45,043 17 $47,289 66 $45,374 0 $0 APPLICATIONS APPROVED, NOT ACCEPTED 6 $54,658 9 $50,551 10 $51,975 2 $51,855 APPLICATIONS DENIED 0 $0 2 $39,960 2 $39,960 0 $0 APPLICATIONS WITHDRAWN 6 $64,368 2 $49,600 4 $46,602 0 $0 FILES CLOSED FOR INCOMPLETENESS 0 $0 0 $0 0 $0 0 $0
Aggregated Statistics For Year 2003(Based on 2 full and 6 partial tracts) A) Conventional B) Refinancings C) Non-occupant Loans on Number Average Value Number Average Value Number Average Value
LOANS ORIGINATED 53 $42,595 16 $45,120 50 $42,607 APPLICATIONS APPROVED, NOT ACCEPTED 11 $50,336 15 $58,566 14 $38,117 APPLICATIONS DENIED 4 $47,300 2 $61,940 4 $47,300 APPLICATIONS WITHDRAWN 0 $0 0 $0 0 $0 FILES CLOSED FOR INCOMPLETENESS 0 $0 4 $49,950 2 $45,955
Aggregated Statistics For Year 2002(Based on 2 full and 4 partial tracts) A) Conventional B) Refinancings C) Non-occupant Loans on Number Average Value Number Average Value Number Average Value
LOANS ORIGINATED 22 $47,314 19 $47,464 14 $45,236 APPLICATIONS APPROVED, NOT ACCEPTED 2 $106,325 5 $60,780 2 $37,960 APPLICATIONS DENIED 2 $47,950 9 $38,359 7 $41,041 APPLICATIONS WITHDRAWN 0 $0 0 $0 0 $0 FILES CLOSED FOR INCOMPLETENESS 2 $17,540 0 $0 0 $0
Aggregated Statistics For Year 2001(Based on 2 full and 4 partial tracts) A) Conventional B) Refinancings C) Non-occupant Loans on Number Average Value Number Average Value Number Average Value
LOANS ORIGINATED 14 $47,612 16 $58,772 13 $36,932 APPLICATIONS APPROVED, NOT ACCEPTED 4 $65,323 3 $62,040 0 $0 APPLICATIONS DENIED 0 $0 1 $42,510 0 $0 APPLICATIONS WITHDRAWN 0 $0 0 $0 0 $0 FILES CLOSED FOR INCOMPLETENESS 0 $0 0 $0 0 $0
Aggregated Statistics For Year 2000(Based on 2 full and 4 partial tracts) A) Conventional B) Refinancings C) Non-occupant Loans on Number Average Value Number Average Value Number Average Value
LOANS ORIGINATED 10 $38,194 14 $27,799 12 $28,896 APPLICATIONS APPROVED, NOT ACCEPTED 0 $0 0 $0 0 $0 APPLICATIONS DENIED 2 $24,405 0 $0 2 $24,405 APPLICATIONS WITHDRAWN 0 $0 0 $0 0 $0 FILES CLOSED FOR INCOMPLETENESS 0 $0 0 $0 0 $0
Aggregated Statistics For Year 1999(Based on 1 full and 3 partial tracts) A) Conventional B) Refinancings C) Non-occupant Loans on Number Average Value Number Average Value Number Average Value
LOANS ORIGINATED 4 $24,138 6 $29,617 2 $32,565 APPLICATIONS APPROVED, NOT ACCEPTED 0 $0 1 $58,410 0 $0 APPLICATIONS DENIED 1 $49,690 0 $0 0 $0 APPLICATIONS WITHDRAWN 0 $0 0 $0 0 $0 FILES CLOSED FOR INCOMPLETENESS 0 $0 0 $0 0 $0
Detailed PMIC statistics for the following Tracts:
0057.00
,
0079.00 ,
0091.01 ,
0091.04
2002 - 2018 National Fire Incident Reporting System (NFIRS) incidents See full 2006 National Fire Incident Reporting System statistics for zip code 74126, Oklahoma
Most common first names in zip code 74126 among deceased individuals Name Count Lived (average)
James 64 66.7 years John 59 75.1 years William 55 71.7 years Mary 47 75.3 years Robert 37 65.0 years Willie 34 69.7 years Charles 34 68.3 years George 22 73.0 years Ruth 19 77.9 years Helen 18 72.5 years
Most common last names in zip code 74126 among deceased individuals Last name Count Lived (average)
Smith 46 70.5 years Johnson 40 69.8 years Jones 36 69.3 years Jackson 35 65.5 years Wilson 28 68.3 years Brown 23 71.1 years Williams 23 70.3 years Allen 18 69.6 years Anderson 18 72.0 years Walker 18 71.0 years
Businesses in zip code 74126
Name Count Name Count
AutoZone 1 H&R Block 1 Church's Chicken 1 KFC 1 Cricket Wireless 1 Subway 1


 Nearest zip codes: 74073, 74106, 74130, 74127, 74110, 74103.
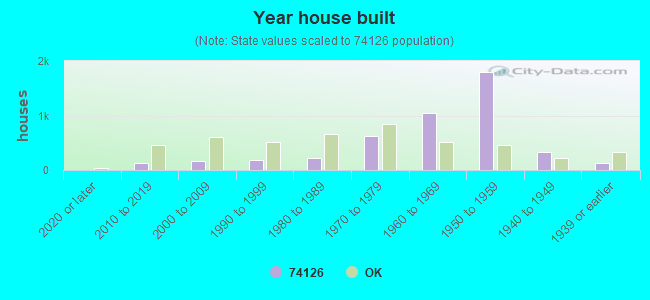


 According to the data from the years 2002 - 2018 the average number of fires per year is 131. The highest number of reported fires - 173 took place in 2006, and the least - 90 in 2004. The data has a decreasing trend.
 When looking into fire subcategories, the most incidents belonged to: Outside Fires (47.4%), and Structure Fires (33.5%).