Estimated zip code population in 2022: 10,891 Zip code population in 2010: 11,206 Zip code population in 2000: 12,012
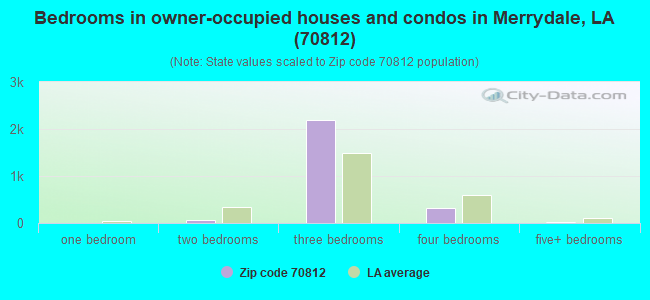
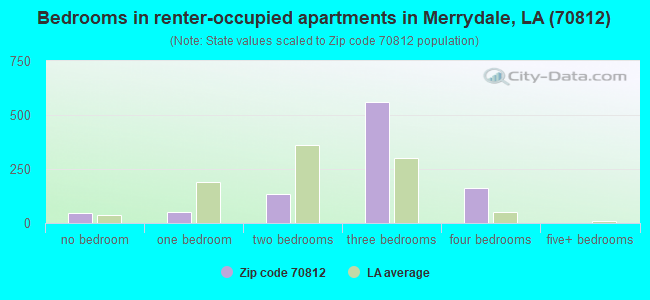
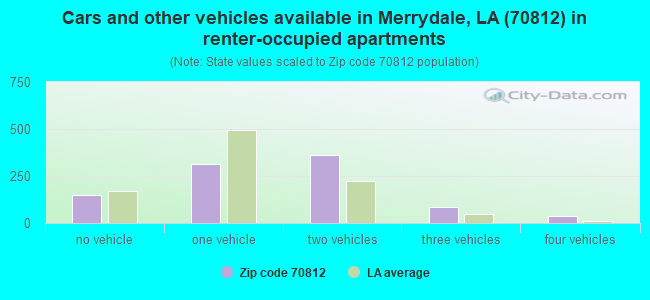
Houses and condos: 4,344 Renter-occupied apartments: 949
% of renters here:
27%
State:
32%
March 2022 cost of living index in zip code 70812: 89.6 (less than average, U.S. average is 100)
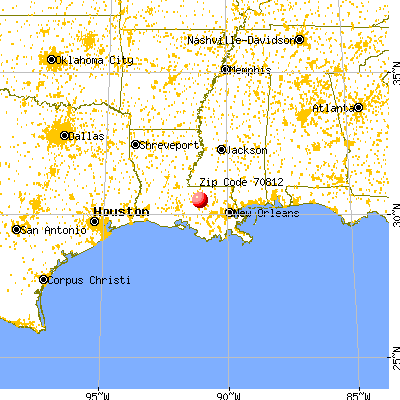
Land area: 4.4 sq. mi. Water area: 0.0 sq. mi.
Population density: 2,503 people per square mile
(average).
OSM Map
General Map
Google Map
MSN Map
OSM Map
General Map
Google Map
MSN Map
OSM Map
General Map
Google Map
MSN Map
OSM Map
General Map
Google Map
MSN Map
Please wait while loading the map...
Real estate property taxes paid for housing units in 2022:
This zip code:
0.2% ($206)
Louisiana:
0.5% ($1,127)
Median real estate property taxes paid for housing units with mortgages in 2022: $468 (0.4%) Median real estate property taxes paid for housing units with no mortgage in 2022: $207 (0.2%)
Business Search- 14 Million verified businesses
Males: 5,071
(46.6%)
Females: 5,820
(53.4%)
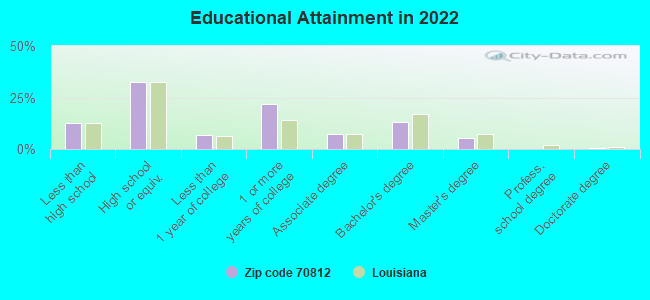
For population 25 years and over in 70812:
High school or higher: 87.6%
Bachelor's degree or higher: 19.1%
Graduate or professional degree: 6.0%
Unemployed: 15.0%
Mean travel time to work (commute): 23.5 minutes
For population 15 years and over in 70812:
Never married: 44.5%
Now married: 32.6%
Separated: 4.0%
Widowed: 4.3%
Divorced: 14.6%
Zip code 70812 compared to state average:
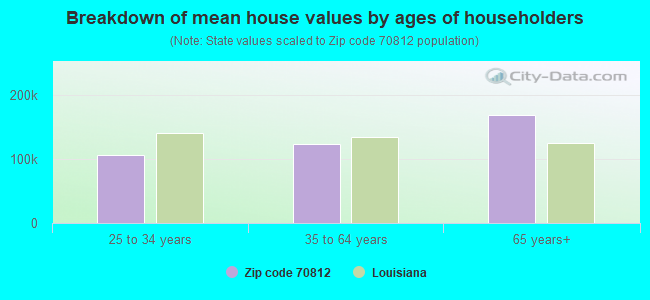
Median house value below state average.
Unemployed percentage above state average.
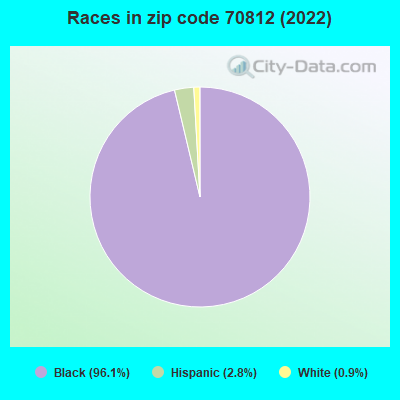
Black race population percentage significantly above state average.
Hispanic race population percentage below state average.
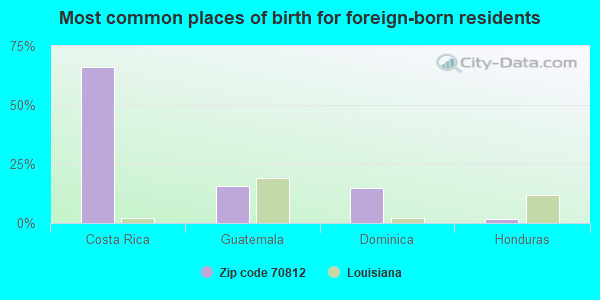
Foreign-born population percentage significantly below state average.
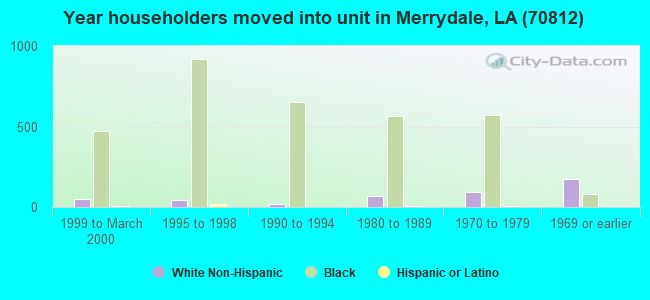
Length of stay since moving in significantly above state average.
Percentage of population with a bachelor's degree or higher below state average.
Averages for the 2020 tax year for zip code 70812, filed in 2021:
Average Adjusted Gross Income (AGI) in 2020: $30,059 (Individual Income Tax Returns)
Here:
$30,059
State:
$60,757
Salary/wage: $27,392 (reported on 83.2% of returns)
Here:
$27,392
State:
$50,882
(% of AGI for various income ranges: 1131.8% for AGIs below $25k, 3622.7% for AGIs $25k-50k, 7288.6% for AGIs $50k-75k, 9723.8% for AGIs $75k-100k, 18206.7% for AGIs $100k-200k)
Taxable interest for individuals: $219 (reported on 8.7% of returns)
This zip code:
$219
Louisiana:
$1,576
(% of AGI for various income ranges: 1.0% for AGIs below $25k, 1.6% for AGIs $25k-50k, 10.3% for AGIs $50k-75k, 17.5% for AGIs $75k-100k, 11.7% for AGIs $100k-200k)
Ordinary dividends: $656 (reported on 1.9% of returns)
Here:
$656
State:
$7,743
(% of AGI for various income ranges: 0.6% for AGIs $25k-50k, 8.3% for AGIs $50k-75k, 33.8% for AGIs $75k-100k)
Net capital gain/loss in AGI: +$738 (reported on 1.7% of returns)
Here:
+$738
State:
+$16,917
(% of AGI for various income ranges: 23.8% for AGIs $50k-75k)
Profit/loss from business: +$629 (reported on 24.9% of returns)
Here:
+$629
State:
+$7,679
(% of AGI for various income ranges: 73.3% for AGIs below $25k, 97.6% for AGIs $50k-75k, 230.0% for AGIs $75k-100k)
Taxable individual retirement arrangement distribution: $13,307 (reported on 2.9% of returns)
70812:
$13,307
Louisiana:
$20,716
(% of AGI for various income ranges: 6.4% for AGIs below $25k, 26.2% for AGIs $25k-50k, 104.1% for AGIs $50k-75k, 1366.2% for AGIs $75k-100k)
Total itemized deductions: $28,509 (reported on 4.8% of returns)
Here:
$28,509
State:
$36,265
(% of AGI for various income ranges: 28.7% for AGIs below $25k, 189.9% for AGIs $25k-50k, 404.1% for AGIs $50k-75k, 1483.8% for AGIs $75k-100k, 1963.3% for AGIs $100k-200k)
Charity contributions: $10,162 (reported on 4.4% of returns)
Here:
$10,162
State:
$13,106
(% of AGI for various income ranges: 58.5% for AGIs $25k-50k, 164.8% for AGIs $50k-75k, 580.0% for AGIs $75k-100k, 748.3% for AGIs $100k-200k)
Taxes paid: $4,855 (reported on 4.6% of returns)
70812:
$4,855
State:
$6,643
(% of AGI for various income ranges: 3.2% for AGIs below $25k, 30.8% for AGIs $25k-50k, 61.0% for AGIs $50k-75k, 220.0% for AGIs $75k-100k, 426.7% for AGIs $100k-200k)
Earned income credit: $3,051 (reported on 43.2% of returns)
Here:
$3,051
State:
$2,671
(% of AGI for various income ranges: 221.0% for AGIs below $25k, 130.9% for AGIs $25k-50k)
Percentage of individuals using paid preparers for their 2020 taxes: 91.9%
Here:
92%
State:
92%
(% for various income ranges: 92.4% for AGIs below $25k, 93.7% for AGIs $25k-50k, 88.9% for AGIs $50k-75k, 80.0% for AGIs $75k-100k, 83.3% for AGIs $100k-200k)
Averages for the 2012 tax year for zip code 70812, filed in 2013:
Average Adjusted Gross Income (AGI) in 2012: $27,690 (Individual Income Tax Returns)
Here:
$27,690
State:
$56,730
Salary/wage: $25,665 (reported on 88.5% of returns)
Here:
$25,665
State:
$45,545
(% of AGI for various income ranges: 84.7% for AGIs below $25k, 88.4% for AGIs $25k-50k, 81.5% for AGIs $50k-75k, 75.1% for AGIs $75k-100k, 62.0% for AGIs $100k-200k)
Taxable interest for individuals: $491 (reported on 8.5% of returns)
This zip code:
$491
Louisiana:
$1,804
(% of AGI for various income ranges: 0.2% for AGIs $25k-50k, 0.1% for AGIs $50k-75k, 0.2% for AGIs $75k-100k, 0.1% for AGIs $100k-200k)
Ordinary dividends: $2,020 (reported on 2.9% of returns)
Here:
$2,020
State:
$7,610
(% of AGI for various income ranges: 0.2% for AGIs below $25k, 0.3% for AGIs $25k-50k, 0.7% for AGIs $75k-100k)
Net capital gain/loss in AGI: +$1,200 (reported on 1.0% of returns)
Here:
+$1,200
State:
+$17,096
Profit/loss from business: +$2,292 (reported on 20.4% of returns)
Here:
+$2,292
State:
+$12,088
(% of AGI for various income ranges: 7.7% for AGIs below $25k)
Taxable individual retirement arrangement distribution: $17,707 (reported on 2.9% of returns)
70812:
$17,707
Louisiana:
$16,085
(% of AGI for various income ranges: 0.4% for AGIs below $25k, 0.9% for AGIs $25k-50k, 2.2% for AGIs $50k-75k, 10.0% for AGIs $100k-200k)
Total itemized deductions: $17,805 (33% of AGI, reported on 17.9% of returns)
Here:
$17,805
State:
$23,585
Here:
33.3% of AGI
State:
18.1% of AGI
(% of AGI for various income ranges: 4.5% for AGIs below $25k, 13.6% for AGIs $25k-50k, 15.6% for AGIs $50k-75k, 17.4% for AGIs $75k-100k, 13.0% for AGIs $100k-200k)
Charity contributions: $5,483 (reported on 16.0% of returns)
Here:
$5,483
State:
$5,533
(% of AGI for various income ranges: 0.8% for AGIs below $25k, 3.2% for AGIs $25k-50k, 4.7% for AGIs $50k-75k, 6.1% for AGIs $75k-100k, 4.8% for AGIs $100k-200k)
Taxes paid: $2,186 (reported on 17.3% of returns)
70812:
$2,186
State:
$6,282
(% of AGI for various income ranges: 0.3% for AGIs below $25k, 1.3% for AGIs $25k-50k, 1.9% for AGIs $50k-75k, 2.5% for AGIs $75k-100k, 2.5% for AGIs $100k-200k)
Earned income credit: $3,052 (reported on 49.0% of returns)
Here:
$3,052
State:
$2,633
(% of AGI for various income ranges: 15.8% for AGIs below $25k, 2.0% for AGIs $25k-50k)
Percentage of individuals using paid preparers for their 2012 taxes: 50.4%
Here:
50%
State:
57%
(% for various income ranges: 50.3% for AGIs below $25k, 48.5% for AGIs $25k-50k, 52.5% for AGIs $50k-75k, 56.2% for AGIs $75k-100k, 58.3% for AGIs $100k-200k)
Averages for the 2004 tax year for zip code 70812, filed in 2005:
Average Adjusted Gross Income (AGI) in 2004: $24,600 (Individual Income Tax Returns)
Here:
$24,600
State:
$39,411
Salary/wage: $23,332 (reported on 92.0% of returns)
Here:
$23,332
State:
$34,434
(% of AGI for various income ranges: 88.9% for AGIs below $10k, 89.1% for AGIs $10k-25k, 90.4% for AGIs $25k-50k, 84.4% for AGIs $50k-75k, 84.7% for AGIs $75k-100k, 73.3% for AGIs over 100k)
Taxable interest for individuals: $421 (reported on 14.4% of returns)
This zip code:
$421
Louisiana:
$1,606
(% of AGI for various income ranges: 0.3% for AGIs below $10k, 0.3% for AGIs $10k-25k, 0.2% for AGIs $25k-50k, 0.2% for AGIs $50k-75k, 0.1% for AGIs $75k-100k, 0.5% for AGIs over 100k)
Taxable dividends: $858 (reported on 4.0% of returns)
Here:
$858
State:
$3,235
(% of AGI for various income ranges: 0.2% for AGIs below $10k, 0.0% for AGIs $10k-25k, 0.1% for AGIs $25k-50k, 0.2% for AGIs $50k-75k, 0.3% for AGIs $75k-100k, 0.2% for AGIs over 100k)
Net capital gain/loss: +$629 (reported on 2.1% of returns)
Here:
+$629
State:
+$8,531
(% of AGI for various income ranges: 0.0% for AGIs $10k-25k, 0.0% for AGIs $25k-50k, -0.0% for AGIs $50k-75k, 0.4% for AGIs $75k-100k)
Profit/loss from business: +$4,160 (reported on 11.6% of returns)
Here:
+$4,160
State:
+$9,128
(% of AGI for various income ranges: 8.4% for AGIs below $10k, 3.6% for AGIs $10k-25k, 1.2% for AGIs $25k-50k, 0.3% for AGIs $50k-75k, -0.4% for AGIs $75k-100k, 0.9% for AGIs over 100k)
IRA payment deduction: $1,548 (reported on 0.7% of returns)
70812:
$1,548
Louisiana:
$3,055
Total itemized deductions: $15,055 (30% of AGI, reported on 17.1% of returns)
Here:
$15,055
State:
$18,222
Here:
30.3% of AGI
State:
20.3% of AGI
(% of AGI for various income ranges: 2.1% for AGIs below $10k, 3.6% for AGIs $10k-25k, 13.6% for AGIs $25k-50k, 15.2% for AGIs $50k-75k, 14.7% for AGIs $75k-100k, 13.3% for AGIs over 100k)
Charity contributions deductions: $4,882 (10% of AGI, reported on 16.1% of returns)
Here:
$4,882
State:
$4,190
Here:
9.7% of AGI
State:
4.4% of AGI
(% of AGI for various income ranges: 0.4% for AGIs below $10k, 0.8% for AGIs $10k-25k, 3.9% for AGIs $25k-50k, 4.7% for AGIs $50k-75k, 5.7% for AGIs $75k-100k, 5.1% for AGIs over 100k)
Total tax: $2,728 (reported on 51.6% of returns)
70812:
$2,728
State:
$6,529
(% of AGI for various income ranges: 1.9% for AGIs below $10k, 2.2% for AGIs $10k-25k, 4.8% for AGIs $25k-50k, 8.1% for AGIs $50k-75k, 10.1% for AGIs $75k-100k, 15.5% for AGIs over 100k)
Earned income credit: $2,378 (reported on 51.5% of returns)
Here:
$2,378
State:
$2,103
Percentage of individuals using paid preparers for their 2004 taxes: 62.1%
Here:
62%
State:
61%
(% for various income ranges: 60.6% for AGIs below $10k, 67.4% for AGIs $10k-25k, 57.6% for AGIs $25k-50k, 53.0% for AGIs $50k-75k, 57.9% for AGIs $75k-100k, 58.2% for AGIs over 100k)
Household received Food Stamps/SNAP in the past 12 months: 1,166 Household did not receive Food Stamps/SNAP in the past 12 months: 2,471
Women who had a birth in the past 12 months: 48 (24 now married, 23 unmarried) Women who did not have a birth in the past 12 months: 2,324 (406 now married, 1,934 unmarried)
Housing units in zip code 70812 with a mortgage: 1,675 (45 second mortgage, 28 both second mortgage and home equity loan) Median monthly owner costs for units with a mortgage: $1,175 Median monthly owner costs for units without a mortgage: $339
Residents with income below the poverty level in 2022:
This zip code:
33.9%
Whole state:
18.6%
Residents with income below 50% of the poverty level in 2022:
This zip code:
23.2%
Whole state:
10.1%
Median number of rooms in houses and condos:
Here:
6.0
State:
6.2
Median number of rooms in apartments:
Here:
4.9
State:
4.4
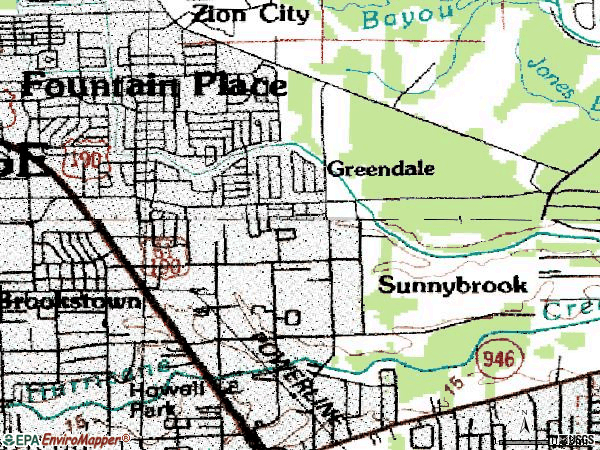
Notable locations in this zip code not listed on our city pages
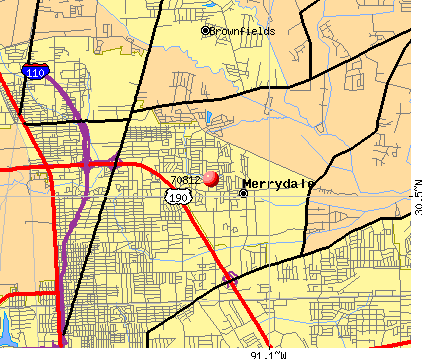
Notable locations in zip code 70812: Bethesda Rehabilitation Hospital (A), East Baton Rouge Fire District 6 Station 51 (B). Display/hide their locations on the map
Churches in zip code 70812 include: Lanier Baptist Church (A), Glen Oaks Baptist Church (B), First Unity Missionary Baptist Church (C), Greater Emmanuel Missionary Church (D), Faith Seventh Day Adventist Church (E), Beacon Light Baptist Church (F), All Faiths Christian Center (G), Elm Park Church (H). Display/hide their locations on the map
Tourist attraction (not listed on the city page) : East Baton Rouge Parish School System - Schools- Glen Oaks Park Magnet Elementary School- Lib (Cultural Attractions- Events- & Facilities; 5656 Lanier Drive).
In group quarters: 93 (-1 institutionalized population)
Size of family households: 953 2-persons, 944 3-persons, 498 4-persons, 194 5-persons, 99 6-persons, 41 7-or-more-persons
Size of nonfamily households: 673 1-person, 110 2-persons
210 married couples with children.
2,441 single-parent households (99 men, 2,342 women).
97.2% of residents of 70812 zip code speak English at home.
2.6% of residents speak Spanish at home (64% very well, 29% not well, 7% not at all).
Foreign born population: 101 (0.9%) (0.0% of them are naturalized citizens)
:
0.9%
Whole state:
4.2%
66%Costa Rica
16%Guatemala
15%Dominica
2%Honduras
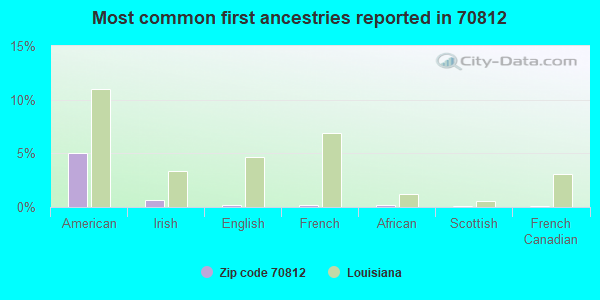
5%American
1%Irish
0%English
0%French
0%African
0%Scottish
0%French Canadian
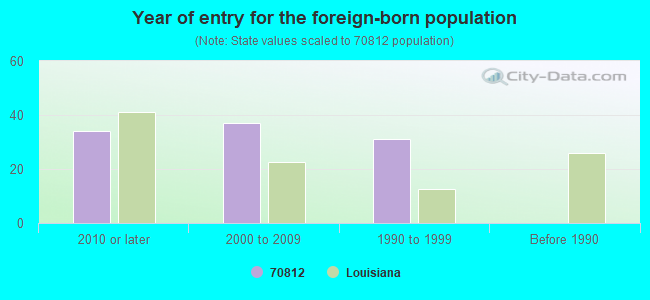
Year of entry for the foreign-born population
342010 or later
372000 to 2009
311990 to 1999
0Before 1990
Facilities with environmental interests located in this zip code:
GLEN OAKS HIGH SCHOOL (6650 CEDAR GROVE DRIVE in BATON ROUGE, LA)
(Geographic Names Information System) (National Center for Education Statistics) - STATE ID-017038 (Resource Conservation and Recovery Act (tracking hazardous waste)) Organizations: BATON ROUGE SCHOOLS (CONTACT/OWNER)
, EAST BATON ROUGE PARISH SCHOOL BOARD (SCHOOL DISTRICT)
Alternative names: GLEN OAKS HIGH SCHOOL BODY SHOP, GLEN OAKS SENIOR HIGH SCHOOL
GLEN OAKS PARK ELEMENTARY SCHOOL (5656 LANIER DRIVE in BATON ROUGE, LA)
(Geographic Names Information System) (National Center for Education Statistics) - STATE ID-017037 Organizations: EAST BATON ROUGE PARISH SCHOOL BOARD (SCHOOL DISTRICT)
FOREST HEIGHTS ELEMENTARY SCHOOL (7447 SUMRALL DRIVE in BATON ROUGE, LA)
(Geographic Names Information System) (National Center for Education Statistics) - STATE ID-017034 Organizations: EAST BATON ROUGE PARISH SCHOOL BOARD (SCHOOL DISTRICT)
CHEVRON SS 109057 (5735 SILVERLEAF in BATON ROUGE, LA)
Conditionally Exempt Small Quantity Generators, less than 100 kg/month of hazardous waste (Resource Conservation and Recovery Act (tracking hazardous waste)) - notification Organizations: KATHY NORRIS (CONTACT/OPERATOR)
, CHEVRON PRODUCTS CO (CONTACT/OWNER)
ADAMS ROLLING MECHANIC SVC (3834C VICTORIA DR in BATON ROUGE, LA)
Conditionally Exempt Small Quantity Generators, less than 100 kg/month of hazardous waste (Resource Conservation and Recovery Act (tracking hazardous waste)) - notification Business NAICS classification: GENERAL AUTOMOTIVE REPAIR. Organizations: JOE ADAMS (CONTACT/OWNER)
EXXON CO USA 52234 (6923 AIRLINE 1 PRESCOTT in BATON ROUGE, LA)
Conditionally Exempt Small Quantity Generators, less than 100 kg/month of hazardous waste (Resource Conservation and Recovery Act (tracking hazardous waste)) - notification
Housing units lacking complete plumbing facilities: 6.4% Housing units lacking complete kitchen facilities: 7.2%
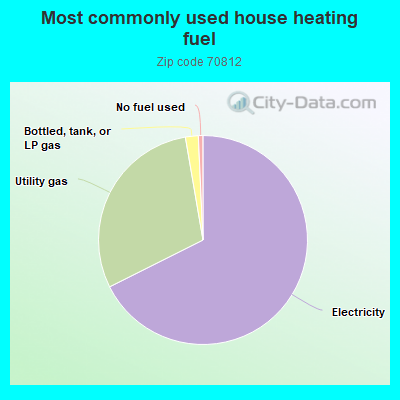
67.6%Electricity
29.7%Utility gas
2.0%Bottled, tank, or LP gas
0.7%No fuel used
Population in 1990: 11,842. Population change in the 1990s: +170 (+1.4%).
Place of birth for U.S.-born residents:
This state: 10,312
Northeast: 9
Midwest: 54
South: 202
West: 182
66% of the 70812 zip code residents lived in the same house 5 years ago. Out of people who lived in different houses, 76% lived in this county. Out of people who lived in different counties, 50% lived in Louisiana.
95% of the 70812 zip code residents lived in the same house 1 year ago. Out of people who lived in different houses, 73% moved from this county. Out of people who lived in different houses, 7% moved from different county within same state. Out of people who lived in different houses, 15% moved from different state. Out of people who lived in different houses, 10% moved from abroad.
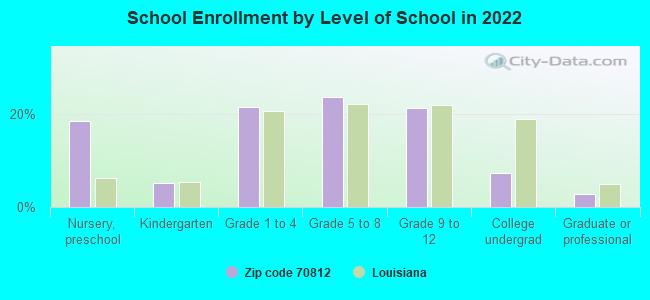
Private vs. public school enrollment:
Students in private schools in grades 1 to 8 (elementary and middle school): 81
Here:
5.4%
Louisiana:
19.6%
Students in private schools in grades 9 to 12 (high school): 41
Here:
5.8%
Louisiana:
18.3%
Students in private undergraduate colleges: 29
Here:
12.0%
Louisiana:
17.4%
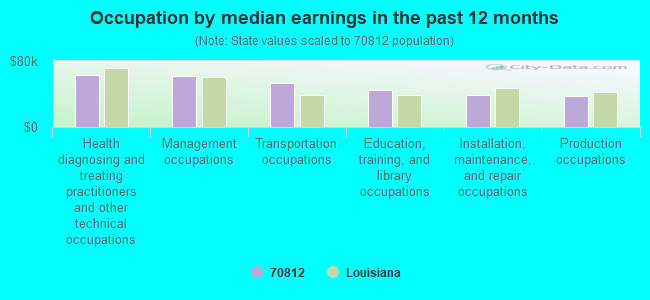
Occupation by median earnings in the past 12 months ($)
62,773Health diagnosing and treating practitioners and other technical occupations
61,578Management occupations
53,862Transportation occupations
44,603Education, training, and library occupations
39,275Installation, maintenance, and repair occupations
37,678Production occupations
Top industries in this zip code by the number of employees in 2005:
Health Care and Social Assistance: Nursing Care Facilities (50-99 employees: 1 establishment)
Health Care and Social Assistance: HMO Medical Centers (50-99: 1)
Health Care and Social Assistance: Child Day Care Services (10-19: 1, 5-9: 2, 1-4: 1)
Other Services (except Public Administration): Other Social Advocacy Organizations (10-19: 1)
Construction: Electrical Contractors (10-19: 1)
Health Care and Social Assistance: Home Health Care Services (10-19: 1)
Construction: Tile and Terrazzo Contractors (5-9: 1, 1-4: 1)
Other Services (except Public Administration): Civic and Social Organizations (5-9: 1, 1-4: 1)
Other Services (except Public Administration): Automotive Glass Replacement Shops (5-9: 1)
People in group quarters in 2010:
17 people in other noninstitutional facilities
People in group quarters in 2000:
79 people in nursing homes
40 people in hospitals/wards and hospices for chronically ill
40 people in other hospitals or wards for chronically ill
2 people in homes for the mentally retarded
Fatal accident statistics in 2013:
Fatal accident count: 2
Vehicles involved in fatal accidents: 2
Fatal accidents caused by drunken drivers: 0
Fatalities: 2
Persons involved in fatal accidents: 2
Pedestrians involved in fatal accidents: 1
Fatal accident statistics in 2012:
Fatal accident count: 2
Vehicles involved in fatal accidents: 2
Fatal accidents caused by drunken drivers: 0
Fatalities: 2
Persons involved in fatal accidents: 2
Pedestrians involved in fatal accidents: 2
Home Mortgage Disclosure Act Aggregated Statistics For Year 2009 (Based on 2 full and 4 partial tracts)
A) FHA, FSA/RHS & VA Home Purchase Loans
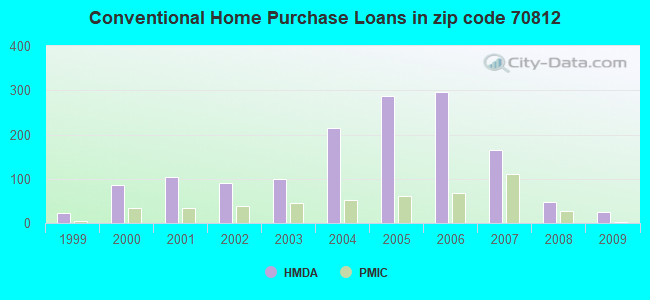
B) Conventional Home Purchase Loans
C) Refinancings
D) Home Improvement Loans
F) Non-occupant Loans on < 5 Family Dwellings (A B C & D)
G) Loans On Manufactured Home Dwelling (A B C & D)
Number
Average Value
Number
Average Value
Number
Average Value
Number
Average Value
Number
Average Value
Number
Average Value
LOANS ORIGINATED
49
$98,444
25
$61,237
108
$100,140
34
$24,442
35
$85,965
0
$0
APPLICATIONS APPROVED, NOT ACCEPTED
5
$77,618
0
$0
25
$107,214
12
$32,675
0
$0
2
$25,380
APPLICATIONS DENIED
22
$103,577
13
$65,112
195
$90,727
73
$47,985
24
$51,902
0
$0
APPLICATIONS WITHDRAWN
15
$97,297
10
$96,680
68
$94,004
6
$37,367
4
$85,442
2
$19,035
FILES CLOSED FOR INCOMPLETENESS
4
$153,715
2
$101,000
23
$89,506
4
$83,302
0
$0
0
$0
Aggregated Statistics For Year 2008 (Based on 2 full and 4 partial tracts)
A) FHA, FSA/RHS & VA Home Purchase Loans
B) Conventional Home Purchase Loans
C) Refinancings
D) Home Improvement Loans
E) Loans on Dwellings For 5+ Families
F) Non-occupant Loans on < 5 Family Dwellings (A B C & D)
G) Loans On Manufactured Home Dwelling (A B C & D)
Number
Average Value
Number
Average Value
Number
Average Value
Number
Average Value
Number
Average Value
Number
Average Value
Number
Average Value
LOANS ORIGINATED
99
$103,723
47
$92,541
172
$82,516
49
$40,341
2
$336,315
50
$65,043
0
$0
APPLICATIONS APPROVED, NOT ACCEPTED
11
$103,930
6
$100,912
70
$95,274
16
$52,258
0
$0
4
$62,988
0
$0
APPLICATIONS DENIED
40
$84,646
44
$76,018
324
$92,034
98
$52,579
0
$0
28
$59,444
6
$29,138
APPLICATIONS WITHDRAWN
4
$126,170
4
$76,725
59
$92,575
6
$97,777
0
$0
4
$76,540
0
$0
FILES CLOSED FOR INCOMPLETENESS
6
$97,463
2
$38,075
48
$90,263
2
$78,385
0
$0
2
$36,000
0
$0
Aggregated Statistics For Year 2007 (Based on 2 full and 4 partial tracts)
A) FHA, FSA/RHS & VA Home Purchase Loans
B) Conventional Home Purchase Loans
C) Refinancings
D) Home Improvement Loans
F) Non-occupant Loans on < 5 Family Dwellings (A B C & D)
G) Loans On Manufactured Home Dwelling (A B C & D)
Number
Average Value
Number
Average Value
Number
Average Value
Number
Average Value
Number
Average Value
Number
Average Value
LOANS ORIGINATED
14
$83,203
166
$97,456
268
$85,284
69
$43,891
76
$69,518
0
$0
APPLICATIONS APPROVED, NOT ACCEPTED
3
$106,577
43
$70,695
100
$85,272
15
$52,095
20
$63,553
0
$0
APPLICATIONS DENIED
11
$103,335
84
$90,092
452
$80,013
153
$53,321
45
$66,486
12
$69,714
APPLICATIONS WITHDRAWN
0
$0
38
$116,367
126
$84,627
15
$62,307
10
$67,878
0
$0
FILES CLOSED FOR INCOMPLETENESS
4
$94,452
9
$115,204
56
$93,654
0
$0
6
$62,680
0
$0
Aggregated Statistics For Year 2006 (Based on 2 full and 4 partial tracts)
A) FHA, FSA/RHS & VA Home Purchase Loans
B) Conventional Home Purchase Loans
C) Refinancings
D) Home Improvement Loans
F) Non-occupant Loans on < 5 Family Dwellings (A B C & D)
G) Loans On Manufactured Home Dwelling (A B C & D)
Number
Average Value
Number
Average Value
Number
Average Value
Number
Average Value
Number
Average Value
Number
Average Value
LOANS ORIGINATED
26
$82,019
296
$83,589
347
$72,671
61
$39,640
89
$75,821
2
$33,200
APPLICATIONS APPROVED, NOT ACCEPTED
8
$67,278
91
$83,465
113
$79,468
11
$40,743
16
$119,694
4
$52,000
APPLICATIONS DENIED
6
$63,660
166
$70,108
469
$74,898
155
$49,930
51
$65,216
17
$47,847
APPLICATIONS WITHDRAWN
6
$83,000
35
$101,197
184
$75,841
11
$53,272
11
$52,824
0
$0
FILES CLOSED FOR INCOMPLETENESS
0
$0
19
$104,581
124
$80,429
0
$0
7
$137,401
0
$0
Aggregated Statistics For Year 2005 (Based on 2 full and 4 partial tracts)
A) FHA, FSA/RHS & VA Home Purchase Loans
B) Conventional Home Purchase Loans
C) Refinancings
D) Home Improvement Loans
E) Loans on Dwellings For 5+ Families
F) Non-occupant Loans on < 5 Family Dwellings (A B C & D)
G) Loans On Manufactured Home Dwelling (A B C & D)
Number
Average Value
Number
Average Value
Number
Average Value
Number
Average Value
Number
Average Value
Number
Average Value
Number
Average Value
LOANS ORIGINATED
20
$68,690
288
$64,599
345
$67,191
43
$26,623
2
$210,990
112
$60,479
2
$16,655
APPLICATIONS APPROVED, NOT ACCEPTED
8
$72,249
120
$62,704
119
$61,490
13
$38,898
0
$0
24
$51,331
2
$38,080
APPLICATIONS DENIED
10
$59,145
170
$61,358
665
$70,918
105
$33,542
0
$0
57
$63,665
6
$59,175
APPLICATIONS WITHDRAWN
2
$107,450
44
$76,862
289
$77,451
36
$95,768
0
$0
22
$67,558
0
$0
FILES CLOSED FOR INCOMPLETENESS
0
$0
27
$51,771
68
$72,260
2
$67,000
0
$0
8
$41,986
0
$0
Aggregated Statistics For Year 2004 (Based on 2 full and 4 partial tracts)
A) FHA, FSA/RHS & VA Home Purchase Loans
B) Conventional Home Purchase Loans
C) Refinancings
D) Home Improvement Loans
E) Loans on Dwellings For 5+ Families
F) Non-occupant Loans on < 5 Family Dwellings (A B C & D)
G) Loans On Manufactured Home Dwelling (A B C & D)
Number
Average Value
Number
Average Value
Number
Average Value
Number
Average Value
Number
Average Value
Number
Average Value
Number
Average Value
LOANS ORIGINATED
62
$70,526
215
$58,732
407
$64,565
79
$25,013
2
$210,990
128
$48,252
2
$95,210
APPLICATIONS APPROVED, NOT ACCEPTED
6
$68,175
99
$70,016
224
$65,691
3
$25,677
0
$0
18
$57,463
2
$27,000
APPLICATIONS DENIED
15
$70,093
146
$58,887
691
$65,691
100
$26,334
0
$0
41
$49,406
11
$31,511
APPLICATIONS WITHDRAWN
10
$76,449
50
$57,835
341
$72,216
18
$31,999
0
$0
4
$50,178
0
$0
FILES CLOSED FOR INCOMPLETENESS
5
$99,496
18
$74,919
64
$67,272
4
$41,000
0
$0
5
$66,904
2
$70,000
Aggregated Statistics For Year 2003 (Based on 2 full and 4 partial tracts)
A) FHA, FSA/RHS & VA Home Purchase Loans
B) Conventional Home Purchase Loans
C) Refinancings
D) Home Improvement Loans
F) Non-occupant Loans on < 5 Family Dwellings (A B C & D)
Number
Average Value
Number
Average Value
Number
Average Value
Number
Average Value
Number
Average Value
LOANS ORIGINATED
68
$66,426
100
$59,142
455
$61,610
37
$14,783
65
$45,896
APPLICATIONS APPROVED, NOT ACCEPTED
2
$59,040
33
$76,342
186
$58,646
17
$22,544
14
$45,242
APPLICATIONS DENIED
22
$65,995
99
$55,055
592
$64,947
97
$18,821
36
$48,148
APPLICATIONS WITHDRAWN
9
$59,912
9
$122,419
304
$66,530
12
$15,500
4
$40,835
FILES CLOSED FOR INCOMPLETENESS
2
$46,000
15
$82,652
39
$66,802
2
$20,000
6
$45,925
Aggregated Statistics For Year 2002 (Based on 2 full and 4 partial tracts)
A) FHA, FSA/RHS & VA Home Purchase Loans
B) Conventional Home Purchase Loans
C) Refinancings
D) Home Improvement Loans
E) Loans on Dwellings For 5+ Families
F) Non-occupant Loans on < 5 Family Dwellings (A B C & D)
Number
Average Value
Number
Average Value
Number
Average Value
Number
Average Value
Number
Average Value
Number
Average Value
LOANS ORIGINATED
109
$68,296
90
$59,326
379
$57,972
47
$23,570
2
$138,810
60
$41,839
APPLICATIONS APPROVED, NOT ACCEPTED
4
$45,675
24
$68,200
191
$57,042
20
$19,583
0
$0
23
$41,459
APPLICATIONS DENIED
27
$60,151
75
$53,856
442
$58,299
54
$18,537
0
$0
30
$37,582
APPLICATIONS WITHDRAWN
3
$56,127
17
$62,194
159
$63,433
0
$0
0
$0
3
$74,030
FILES CLOSED FOR INCOMPLETENESS
4
$74,522
14
$45,854
153
$68,874
0
$0
0
$0
0
$0
Aggregated Statistics For Year 2001 (Based on 2 full and 4 partial tracts)
A) FHA, FSA/RHS & VA Home Purchase Loans
B) Conventional Home Purchase Loans
C) Refinancings
D) Home Improvement Loans
E) Loans on Dwellings For 5+ Families
F) Non-occupant Loans on < 5 Family Dwellings (A B C & D)
Number
Average Value
Number
Average Value
Number
Average Value
Number
Average Value
Number
Average Value
Number
Average Value
LOANS ORIGINATED
92
$65,298
105
$49,593
335
$53,135
51
$17,203
0
$0
92
$42,576
APPLICATIONS APPROVED, NOT ACCEPTED
4
$75,985
35
$53,608
111
$54,450
17
$27,704
2
$70,000
12
$45,555
APPLICATIONS DENIED
26
$71,341
82
$54,789
712
$52,361
108
$17,793
0
$0
30
$37,492
APPLICATIONS WITHDRAWN
9
$61,314
20
$48,313
288
$56,010
22
$24,950
0
$0
10
$35,550
FILES CLOSED FOR INCOMPLETENESS
2
$26,175
12
$27,350
66
$63,602
0
$0
0
$0
4
$35,500
Aggregated Statistics For Year 2000 (Based on 2 full and 4 partial tracts)
A) FHA, FSA/RHS & VA Home Purchase Loans
B) Conventional Home Purchase Loans
C) Refinancings
D) Home Improvement Loans
F) Non-occupant Loans on < 5 Family Dwellings (A B C & D)
Number
Average Value
Number
Average Value
Number
Average Value
Number
Average Value
Number
Average Value
LOANS ORIGINATED
112
$62,536
87
$48,569
257
$51,096
65
$17,367
37
$37,222
APPLICATIONS APPROVED, NOT ACCEPTED
15
$55,237
30
$47,554
157
$56,776
27
$19,767
4
$48,602
APPLICATIONS DENIED
24
$58,322
100
$58,874
730
$46,463
122
$15,822
33
$37,709
APPLICATIONS WITHDRAWN
16
$62,017
54
$62,483
322
$47,648
12
$20,124
18
$45,056
FILES CLOSED FOR INCOMPLETENESS
4
$52,038
12
$47,037
142
$55,281
0
$0
2
$63,070
Aggregated Statistics For Year 1999 (Based on 1 full and 2 partial tracts)
A) FHA, FSA/RHS & VA Home Purchase Loans
B) Conventional Home Purchase Loans
C) Refinancings
D) Home Improvement Loans
F) Non-occupant Loans on < 5 Family Dwellings (A B C & D)
2003 - 2018 National Fire Incident Reporting System (NFIRS) incidents
According to the data from the years 2003 - 2018 the average number of fires per year is 77. The highest number of fires - 109 took place in 2011, and the least - 33 in 2003. The data has a rising trend.
When looking into fire subcategories, the most reports belonged to: Structure Fires (45.6%), and Outside Fires (30.2%).
Fire incident types reported to NFIRS in Zip Code 70812


 Nearest zip codes: 70811, 70814, 70805, 70806, 70815, 70818.


 According to the data from the years 2003 - 2018 the average number of fires per year is 77. The highest number of fires - 109 took place in 2011, and the least - 33 in 2003. The data has a rising trend.
 When looking into fire subcategories, the most reports belonged to: Structure Fires (45.6%), and Outside Fires (30.2%).