Estimated zip code population in 2022: 5,482 Zip code population in 2010: 5,213 Zip code population in 2000: 5,338
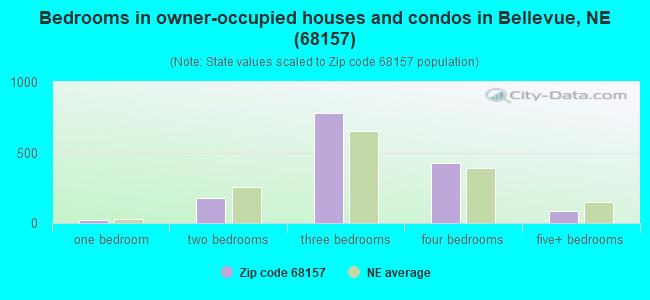
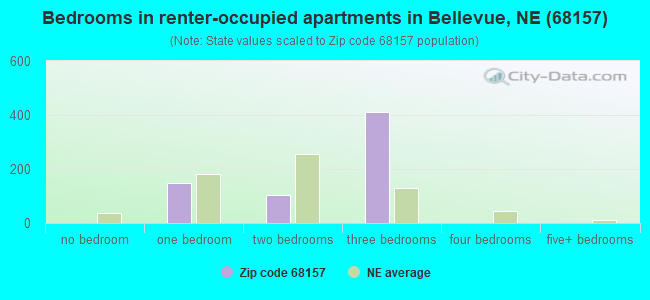
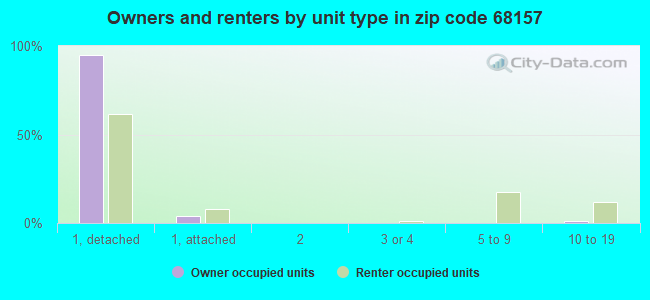
Houses and condos: 2,223 Renter-occupied apartments: 685
% of renters here:
32%
State:
34%
March 2022 cost of living index in zip code 68157: 90.4 (less than average, U.S. average is 100)
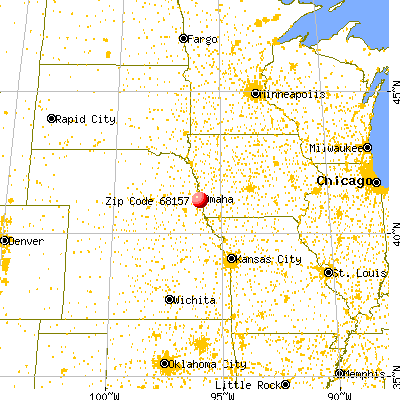
Land area: 2.5 sq. mi. Water area: 0.0 sq. mi.
Population density: 2,183 people per square mile
(low).
OSM Map
General Map
Google Map
MSN Map
OSM Map
General Map
Google Map
MSN Map
OSM Map
General Map
Google Map
MSN Map
OSM Map
General Map
Google Map
MSN Map
Please wait while loading the map...
Real estate property taxes paid for housing units in 2022:
This zip code:
1.7% ($3,798)
Nebraska:
1.4% ($3,313)
Median real estate property taxes paid for housing units with mortgages in 2022: $3,880 (1.6%) Median real estate property taxes paid for housing units with no mortgage in 2022: $3,558 (1.7%)
Business Search- 14 Million verified businesses
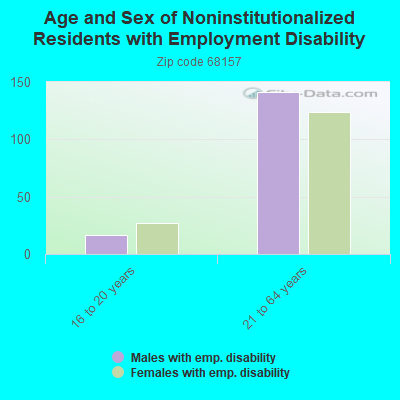
Males: 3,239
(59.1%)
Females: 2,241
(40.9%)
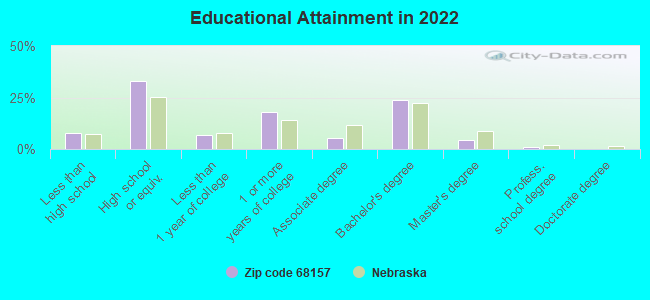
For population 25 years and over in 68157:
High school or higher: 91.5%
Bachelor's degree or higher: 28.7%
Graduate or professional degree: 5.0%
Unemployed: 5.5%
Mean travel time to work (commute): 19.2 minutes
For population 15 years and over in 68157:
Never married: 34.5%
Now married: 44.8%
Separated: 4.6%
Widowed: 4.0%
Divorced: 12.0%
Zip code 68157 compared to state average:
Unemployed percentage above state average.
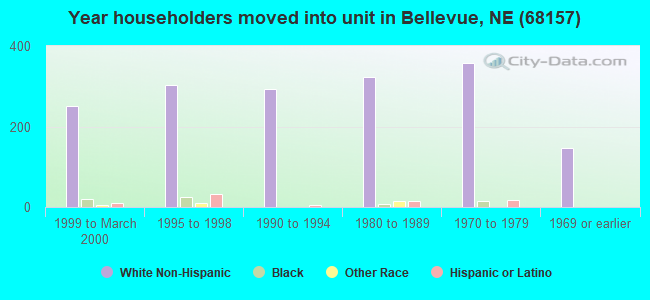
Length of stay since moving in significantly above state average.
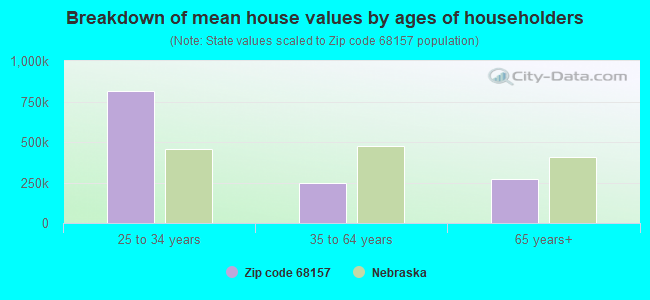
Estimated median house/condo value in 2022: $226,183
68157:
$226,183
Nebraska:
$232,400
According to our research of Nebraska and other state lists, there were 8 registered sex offenders living in 68157 zip code as of June 07, 2024. The ratio of all residents to sex offenders in zip code 68157 is 747 to 1. The ratio of registered sex offenders to all residents in this zip code is lower than the state average.
Median resident age:
This zip code:
37.4 years
Nebraska median age:
37.4 years
Average household size:
This zip code:
2.5 people
Nebraska:
2.4 people
Averages for the 2020 tax year for zip code 68157, filed in 2021:
Average Adjusted Gross Income (AGI) in 2020: $59,634 (Individual Income Tax Returns)
Here:
$59,634
State:
$73,874
Salary/wage: $53,331 (reported on 85.4% of returns)
Here:
$53,331
State:
$58,268
(% of AGI for various income ranges: 1153.6% for AGIs below $25k, 3619.5% for AGIs $25k-50k, 6420.0% for AGIs $50k-75k, 8565.4% for AGIs $75k-100k, 15230.4% for AGIs $100k-200k)
Taxable interest for individuals: $903 (reported on 25.9% of returns)
This zip code:
$903
Nebraska:
$1,748
(% of AGI for various income ranges: 12.4% for AGIs below $25k, 20.4% for AGIs $25k-50k, 25.6% for AGIs $50k-75k, 45.7% for AGIs $75k-100k, 55.9% for AGIs $100k-200k)
Ordinary dividends: $2,582 (reported on 17.9% of returns)
Here:
$2,582
State:
$7,841
(% of AGI for various income ranges: 20.5% for AGIs below $25k, 16.1% for AGIs $25k-50k, 51.0% for AGIs $50k-75k, 66.8% for AGIs $75k-100k, 208.9% for AGIs $100k-200k)
Net capital gain/loss in AGI: +$4,810 (reported on 15.0% of returns)
Here:
+$4,810
State:
+$21,703
(% of AGI for various income ranges: 7.1% for AGIs below $25k, 27.3% for AGIs $25k-50k, 76.4% for AGIs $50k-75k, 49.3% for AGIs $75k-100k, 292.6% for AGIs $100k-200k)
Profit/loss from business: +$9,194 (reported on 11.3% of returns)
Here:
+$9,194
State:
+$11,239
(% of AGI for various income ranges: 97.6% for AGIs below $25k, 165.4% for AGIs $25k-50k, 210.0% for AGIs $50k-75k, 84.6% for AGIs $75k-100k, 108.1% for AGIs $100k-200k)
Taxable individual retirement arrangement distribution: $13,348 (reported on 9.9% of returns)
68157:
$13,348
Nebraska:
$18,251
(% of AGI for various income ranges: 68.5% for AGIs below $25k, 90.2% for AGIs $25k-50k, 94.1% for AGIs $50k-75k, 355.0% for AGIs $75k-100k, 494.1% for AGIs $100k-200k)
Total itemized deductions: $27,764 (reported on 5.1% of returns)
Here:
$27,764
State:
$37,704
(% of AGI for various income ranges: 119.2% for AGIs below $25k, 227.9% for AGIs $50k-75k, 350.0% for AGIs $75k-100k, 487.0% for AGIs $100k-200k)
Charity contributions: $8,027 (reported on 4.0% of returns)
Here:
$8,027
State:
$15,251
(% of AGI for various income ranges: 25.6% for AGIs $50k-75k, 88.6% for AGIs $75k-100k, 198.1% for AGIs $100k-200k)
Taxes paid: $6,893 (reported on 5.5% of returns)
68157:
$6,893
State:
$8,015
(% of AGI for various income ranges: 14.1% for AGIs below $25k, 63.6% for AGIs $50k-75k, 97.5% for AGIs $75k-100k, 159.3% for AGIs $100k-200k)
Earned income credit: $2,327 (reported on 12.0% of returns)
Here:
$2,327
State:
$2,260
(% of AGI for various income ranges: 76.3% for AGIs below $25k, 56.8% for AGIs $25k-50k)
Percentage of individuals using paid preparers for their 2020 taxes: 95.6%
Here:
96%
State:
95%
(% for various income ranges: 93.3% for AGIs below $25k, 97.0% for AGIs $25k-50k, 96.2% for AGIs $50k-75k, 94.4% for AGIs $75k-100k, 97.5% for AGIs $100k-200k, 100.0% for AGIs over 200k)
Averages for the 2012 tax year for zip code 68157, filed in 2013:
Average Adjusted Gross Income (AGI) in 2012: $50,063 (Individual Income Tax Returns)
Here:
$50,063
State:
$60,572
Salary/wage: $44,155 (reported on 86.7% of returns)
Here:
$44,155
State:
$47,046
(% of AGI for various income ranges: 76.5% for AGIs below $25k, 81.8% for AGIs $25k-50k, 81.9% for AGIs $50k-75k, 80.9% for AGIs $75k-100k, 80.9% for AGIs $100k-200k, 27.0% for AGIs over 200k)
Taxable interest for individuals: $649 (reported on 33.2% of returns)
This zip code:
$649
Nebraska:
$1,535
(% of AGI for various income ranges: 0.9% for AGIs below $25k, 0.6% for AGIs $25k-50k, 0.4% for AGIs $50k-75k, 0.3% for AGIs $75k-100k, 0.3% for AGIs $100k-200k, 0.4% for AGIs over 200k)
Ordinary dividends: $1,492 (reported on 19.6% of returns)
Here:
$1,492
State:
$5,776
(% of AGI for various income ranges: 0.9% for AGIs below $25k, 0.5% for AGIs $25k-50k, 0.4% for AGIs $50k-75k, 0.6% for AGIs $75k-100k, 0.9% for AGIs $100k-200k)
Net capital gain/loss in AGI: +$3,591 (reported on 11.8% of returns)
Here:
+$3,591
State:
+$16,171
(% of AGI for various income ranges: 0.1% for AGIs $25k-50k, 0.2% for AGIs $50k-75k, 3.6% for AGIs $100k-200k)
Profit/loss from business: +$8,750 (reported on 9.6% of returns)
Here:
+$8,750
State:
+$9,897
(% of AGI for various income ranges: 5.4% for AGIs below $25k, 1.7% for AGIs $25k-50k, 2.2% for AGIs $50k-75k, 1.3% for AGIs $75k-100k, 0.7% for AGIs $100k-200k)
Taxable individual retirement arrangement distribution: $9,279 (reported on 10.7% of returns)
68157:
$9,279
Nebraska:
$12,804
(% of AGI for various income ranges: 3.7% for AGIs below $25k, 2.3% for AGIs $25k-50k, 2.0% for AGIs $50k-75k, 2.2% for AGIs $75k-100k, 1.6% for AGIs $100k-200k)
Total itemized deductions: $17,025 (21% of AGI, reported on 35.1% of returns)
Here:
$17,025
State:
$23,343
Here:
20.6% of AGI
State:
18.7% of AGI
(% of AGI for various income ranges: 9.0% for AGIs below $25k, 10.4% for AGIs $25k-50k, 12.0% for AGIs $50k-75k, 13.4% for AGIs $75k-100k, 13.6% for AGIs $100k-200k, 10.1% for AGIs over 200k)
Charity contributions: $2,941 (reported on 28.0% of returns)
Here:
$2,941
State:
$4,921
(% of AGI for various income ranges: 0.9% for AGIs below $25k, 0.9% for AGIs $25k-50k, 1.4% for AGIs $50k-75k, 1.8% for AGIs $75k-100k, 2.1% for AGIs $100k-200k, 3.1% for AGIs over 200k)
Taxes paid: $7,006 (reported on 35.1% of returns)
68157:
$7,006
State:
$9,758
(% of AGI for various income ranges: 2.2% for AGIs below $25k, 3.3% for AGIs $25k-50k, 4.5% for AGIs $50k-75k, 5.6% for AGIs $75k-100k, 6.7% for AGIs $100k-200k, 5.9% for AGIs over 200k)
Earned income credit: $2,267 (reported on 13.3% of returns)
Here:
$2,267
State:
$2,188
(% of AGI for various income ranges: 4.7% for AGIs below $25k, 0.9% for AGIs $25k-50k)
Percentage of individuals using paid preparers for their 2012 taxes: 48.3%
Here:
48%
State:
57%
(% for various income ranges: 44.2% for AGIs below $25k, 47.2% for AGIs $25k-50k, 52.3% for AGIs $50k-75k, 51.5% for AGIs $75k-100k, 54.2% for AGIs $100k-200k, 66.7% for AGIs over 200k)
Averages for the 2004 tax year for zip code 68157, filed in 2005:
Average Adjusted Gross Income (AGI) in 2004: $42,870 (Individual Income Tax Returns)
Here:
$42,870
State:
$44,271
Salary/wage: $40,143 (reported on 89.2% of returns)
Here:
$40,143
State:
$38,230
(% of AGI for various income ranges: 92.8% for AGIs below $10k, 80.6% for AGIs $10k-25k, 82.6% for AGIs $25k-50k, 83.1% for AGIs $50k-75k, 88.8% for AGIs $75k-100k, 79.8% for AGIs over 100k)
Taxable interest for individuals: $883 (reported on 47.3% of returns)
This zip code:
$883
Nebraska:
$1,759
(% of AGI for various income ranges: 2.9% for AGIs below $10k, 1.5% for AGIs $10k-25k, 0.8% for AGIs $25k-50k, 0.6% for AGIs $50k-75k, 0.6% for AGIs $75k-100k, 1.6% for AGIs over 100k)
Taxable dividends: $971 (reported on 24.9% of returns)
Here:
$971
State:
$2,804
(% of AGI for various income ranges: 2.0% for AGIs below $10k, 0.7% for AGIs $10k-25k, 0.5% for AGIs $25k-50k, 0.4% for AGIs $50k-75k, 0.3% for AGIs $75k-100k, 0.9% for AGIs over 100k)
Net capital gain/loss: +$1,014 (reported on 17.0% of returns)
Here:
+$1,014
State:
+$7,887
(% of AGI for various income ranges: -0.7% for AGIs below $10k, 0.4% for AGIs $10k-25k, 0.1% for AGIs $25k-50k, 0.1% for AGIs $50k-75k, 0.4% for AGIs $75k-100k, 1.2% for AGIs over 100k)
Profit/loss from business: +$4,012 (reported on 9.9% of returns)
Here:
+$4,012
State:
+$7,743
(% of AGI for various income ranges: 5.2% for AGIs below $10k, 1.5% for AGIs $10k-25k, 1.4% for AGIs $25k-50k, 1.4% for AGIs $50k-75k, -0.0% for AGIs $75k-100k, 0.3% for AGIs over 100k)
IRA payment deduction: $2,721 (reported on 2.7% of returns)
68157:
$2,721
Nebraska:
$2,902
Total itemized deductions: $15,021 (22% of AGI, reported on 40.6% of returns)
Here:
$15,021
State:
$18,692
Here:
21.6% of AGI
State:
21.1% of AGI
(% of AGI for various income ranges: 12.7% for AGIs below $10k, 9.5% for AGIs $10k-25k, 10.4% for AGIs $25k-50k, 15.8% for AGIs $50k-75k, 16.6% for AGIs $75k-100k, 15.9% for AGIs over 100k)
Charity contributions deductions: $2,301 (3% of AGI, reported on 37.4% of returns)
Here:
$2,301
State:
$3,500
Here:
3.2% of AGI
State:
3.8% of AGI
(% of AGI for various income ranges: 0.7% for AGIs below $10k, 1.1% for AGIs $10k-25k, 1.2% for AGIs $25k-50k, 2.2% for AGIs $50k-75k, 2.5% for AGIs $75k-100k, 2.6% for AGIs over 100k)
Total tax: $4,719 (reported on 80.3% of returns)
68157:
$4,719
State:
$6,550
(% of AGI for various income ranges: 2.4% for AGIs below $10k, 4.2% for AGIs $10k-25k, 6.9% for AGIs $25k-50k, 7.7% for AGIs $50k-75k, 9.8% for AGIs $75k-100k, 13.7% for AGIs over 100k)
Earned income credit: $1,578 (reported on 9.3% of returns)
Here:
$1,578
State:
$1,643
Percentage of individuals using paid preparers for their 2004 taxes: 52.3%
Here:
52%
State:
62%
(% for various income ranges: 38.6% for AGIs below $10k, 49.8% for AGIs $10k-25k, 54.4% for AGIs $25k-50k, 58.5% for AGIs $50k-75k, 62.1% for AGIs $75k-100k, 56.0% for AGIs over 100k)
Household received Food Stamps/SNAP in the past 12 months: 260 Household did not receive Food Stamps/SNAP in the past 12 months: 1,919
Women who had a birth in the past 12 months: 87 (41 now married, 39 unmarried) Women who did not have a birth in the past 12 months: 1,024 (459 now married, 564 unmarried)
Housing units in zip code 68157 with a mortgage: 921 (27 second mortgage, 27 both second mortgage and home equity loan) Houses without a mortgage: 24
Median monthly owner costs for units with a mortgage: $1,492 Median monthly owner costs for units without a mortgage: $627
Residents with income below the poverty level in 2022:
This zip code:
10.4%
Whole state:
11.2%
Residents with income below 50% of the poverty level in 2022:
This zip code:
6.5%
Whole state:
6.1%
Median number of rooms in houses and condos:
Here:
7.6
State:
7.1
Median number of rooms in apartments:
Here:
5.4
State:
4.2
Notable locations in this zip code not listed on our city pages
514 married couples with children.
517 single-parent households (151 men, 366 women).
84.7% of residents of 68157 zip code speak English at home.
11.9% of residents speak Spanish at home (62% very well, 26% well, 12% not well).
1.3% of residents speak other Indo-European language at home (93% very well, 7% not at all).
0.9% of residents speak Asian or Pacific Island language at home (48% very well, 52% well).
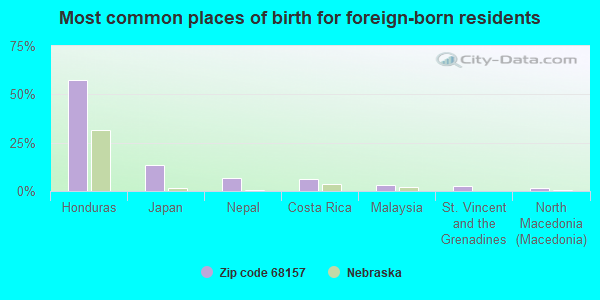
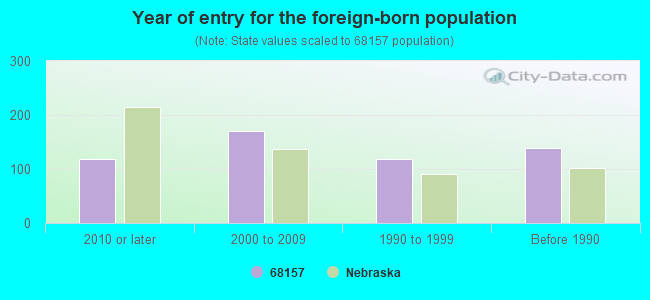
Foreign born population: 518 (9.5%) (61.3% of them are naturalized citizens)
Facilities with environmental interests located in this zip code:
CONVENIENT FOOD MART (4741 GILES RD in PAPILLION, NE)
(Integrated Compliance Information System) - ICIS-07-1997-0277, FORMAL ENFORCEMENT ACTION STATE MASTER (Nebraska tracking) - EPCRA
AUTO FINESSE (6701 HARRISON STREET in OMAHA, NE)
STATE MASTER (Nebraska tracking) - HAZARDOUS WASTE PROGRAM (Resource Conservation and Recovery Act (tracking hazardous waste)) Organizations: JOHN HUBBARD (CONTACT/OWNER)
BRYAN HIGH SCHOOL ( in OMAHA, NE)
(Geographic Names Information System) (National Center for Education Statistics) - STATE ID-280001003 Organizations: OMAHA PUBLIC SCHOOLS (SCHOOL DISTRICT)
Housing units lacking complete plumbing facilities: 1.0%
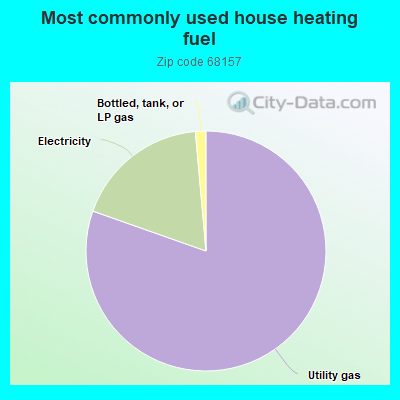
80.4%Utility gas
18.2%Electricity
1.4%Bottled, tank, or LP gas
Population in 1990: 6,112.
Place of birth for U.S.-born residents:
This state: 3,538
Northeast: 104
Midwest: 724
South: 378
West: 164
69% of the 68157 zip code residents lived in the same house 5 years ago. Out of people who lived in different houses, 32% lived in this county. Out of people who lived in different counties, 50% lived in Nebraska.
95% of the 68157 zip code residents lived in the same house 1 year ago. Out of people who lived in different houses, 43% moved from different county within same state. Out of people who lived in different houses, 80% moved from different state.
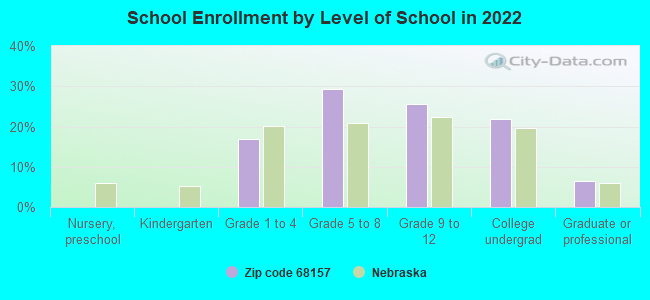
Private vs. public school enrollment:
Students in private schools in grades 1 to 8 (elementary and middle school): 53
Here:
10.1%
Nebraska:
14.1%
Students in private schools in grades 9 to 12 (high school): 20
Here:
7.1%
Nebraska:
12.5%
Students in private undergraduate colleges:
Here:
0.0%
Nebraska:
18.0%
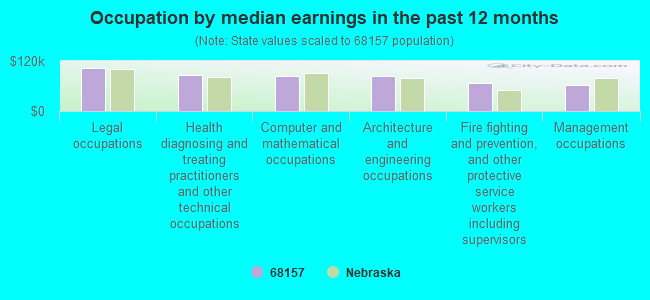
Occupation by median earnings in the past 12 months ($)
102,875Legal occupations
86,823Health diagnosing and treating practitioners and other technical occupations
83,937Computer and mathematical occupations
82,840Architecture and engineering occupations
66,313Fire fighting and prevention, and other protective service workers including supervisors
62,052Management occupations
Top industries in this zip code by the number of employees in 2005:
Wholesale Trade: Automobile and Other Motor Vehicle Merchant Wholesalers (50-99 employees: 1 establishment)
Other Services (except Public Administration): Religious Organizations (20-49: 1)
Administrative and Support and Waste Management and Remediation Services: Landscaping Services (10-19: 1, 1-4: 1)
Health Care and Social Assistance: Offices of Physical, Occupational and Speech Therapists, and Audiologists (10-19: 1)
Construction: Masonry Contractors (10-19: 1)
Real Estate and Rental and Leasing: Video Tape and Disc Rental (10-19: 1)
Health Care and Social Assistance: Child Day Care Services (5-9: 1, 1-4: 1)
Administrative and Support and Waste Management and Remediation Services: Security Systems Services (except Locksmiths) (5-9: 1, 1-4: 1)
People in group quarters in 2010:
6 people in group homes intended for adults
People in group quarters in 2000:
48 people in homes for the mentally retarded
Fatal accident statistics in 2012:
Fatal accident count: 1
Vehicles involved in fatal accidents: 1
Fatal accidents caused by drunken drivers: 1
Fatalities: 1
Persons involved in fatal accidents: 1
Pedestrians involved in fatal accidents: 0
Home Mortgage Disclosure Act Aggregated Statistics For Year 2009 (Based on 2 full and 4 partial tracts)
A) FHA, FSA/RHS & VA Home Purchase Loans
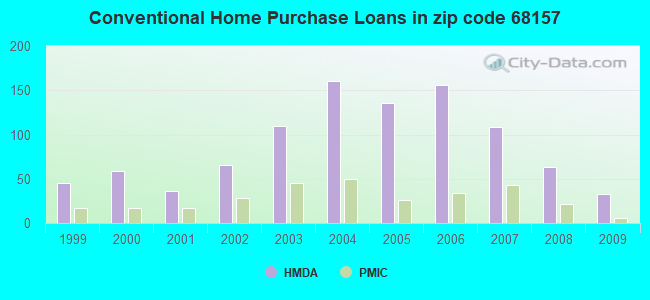
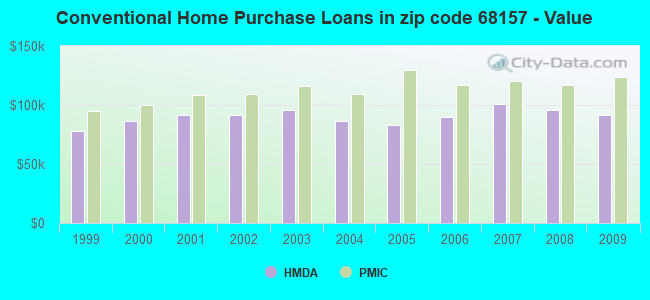
B) Conventional Home Purchase Loans
C) Refinancings
D) Home Improvement Loans
E) Loans on Dwellings For 5+ Families
F) Non-occupant Loans on < 5 Family Dwellings (A B C & D)
Number
Average Value
Number
Average Value
Number
Average Value
Number
Average Value
Number
Average Value
Number
Average Value
LOANS ORIGINATED
113
$123,800
33
$91,178
245
$109,567
38
$16,986
2
$463,695
11
$63,347
APPLICATIONS APPROVED, NOT ACCEPTED
6
$113,542
5
$91,792
33
$120,310
7
$31,757
0
$0
2
$85,905
APPLICATIONS DENIED
11
$128,960
3
$60,590
75
$119,107
26
$22,595
0
$0
1
$600
APPLICATIONS WITHDRAWN
6
$92,228
2
$95,670
52
$116,796
7
$34,549
0
$0
2
$95,670
FILES CLOSED FOR INCOMPLETENESS
1
$41,690
0
$0
11
$92,347
1
$52,240
0
$0
2
$22,455
Aggregated Statistics For Year 2008 (Based on 2 full and 4 partial tracts)
A) FHA, FSA/RHS & VA Home Purchase Loans
B) Conventional Home Purchase Loans
C) Refinancings
D) Home Improvement Loans
E) Loans on Dwellings For 5+ Families
F) Non-occupant Loans on < 5 Family Dwellings (A B C & D)
G) Loans On Manufactured Home Dwelling (A B C & D)
Number
Average Value
Number
Average Value
Number
Average Value
Number
Average Value
Number
Average Value
Number
Average Value
Number
Average Value
LOANS ORIGINATED
65
$125,014
63
$95,940
157
$97,937
46
$15,864
4
$351,988
21
$89,608
0
$0
APPLICATIONS APPROVED, NOT ACCEPTED
7
$89,981
4
$96,155
25
$83,612
16
$27,141
0
$0
3
$127,480
2
$27,335
APPLICATIONS DENIED
1
$600
11
$92,670
98
$114,737
53
$32,905
0
$0
10
$44,978
0
$0
APPLICATIONS WITHDRAWN
3
$89,677
2
$118,120
46
$114,405
5
$40,554
0
$0
2
$62,835
0
$0
FILES CLOSED FOR INCOMPLETENESS
6
$111,612
2
$129,790
8
$115,602
1
$59,530
0
$0
1
$8,930
0
$0
Aggregated Statistics For Year 2007 (Based on 2 full and 4 partial tracts)
A) FHA, FSA/RHS & VA Home Purchase Loans
B) Conventional Home Purchase Loans
C) Refinancings
D) Home Improvement Loans
F) Non-occupant Loans on < 5 Family Dwellings (A B C & D)
G) Loans On Manufactured Home Dwelling (A B C & D)
Number
Average Value
Number
Average Value
Number
Average Value
Number
Average Value
Number
Average Value
Number
Average Value
LOANS ORIGINATED
33
$136,012
108
$100,551
173
$94,979
70
$32,810
11
$84,896
0
$0
APPLICATIONS APPROVED, NOT ACCEPTED
0
$0
7
$96,869
23
$107,991
21
$33,256
0
$0
0
$0
APPLICATIONS DENIED
1
$88,440
14
$90,781
97
$102,724
45
$44,712
3
$45,207
2
$24,405
APPLICATIONS WITHDRAWN
0
$0
10
$108,125
90
$106,592
7
$31,427
3
$138,363
0
$0
FILES CLOSED FOR INCOMPLETENESS
0
$0
1
$59,560
12
$111,538
0
$0
0
$0
0
$0
Aggregated Statistics For Year 2006 (Based on 2 full and 4 partial tracts)
A) FHA, FSA/RHS & VA Home Purchase Loans
B) Conventional Home Purchase Loans
C) Refinancings
D) Home Improvement Loans
F) Non-occupant Loans on < 5 Family Dwellings (A B C & D)
Number
Average Value
Number
Average Value
Number
Average Value
Number
Average Value
Number
Average Value
LOANS ORIGINATED
38
$132,044
156
$89,761
190
$80,422
53
$22,629
46
$78,608
APPLICATIONS APPROVED, NOT ACCEPTED
3
$88,970
15
$82,187
29
$91,609
15
$32,911
5
$87,322
APPLICATIONS DENIED
0
$0
18
$85,919
133
$88,481
39
$12,320
9
$89,388
APPLICATIONS WITHDRAWN
0
$0
17
$82,950
104
$103,420
3
$23,757
2
$145,805
FILES CLOSED FOR INCOMPLETENESS
0
$0
6
$102,758
17
$104,651
0
$0
1
$32,160
Aggregated Statistics For Year 2005 (Based on 2 full and 4 partial tracts)
A) FHA, FSA/RHS & VA Home Purchase Loans
B) Conventional Home Purchase Loans
C) Refinancings
D) Home Improvement Loans
F) Non-occupant Loans on < 5 Family Dwellings (A B C & D)
G) Loans On Manufactured Home Dwelling (A B C & D)
Number
Average Value
Number
Average Value
Number
Average Value
Number
Average Value
Number
Average Value
Number
Average Value
LOANS ORIGINATED
43
$127,880
136
$83,191
206
$92,867
52
$14,930
15
$70,197
1
$10,130
APPLICATIONS APPROVED, NOT ACCEPTED
4
$115,600
7
$77,403
28
$77,801
3
$18,823
1
$43,480
0
$0
APPLICATIONS DENIED
1
$76,110
20
$139,292
131
$107,275
32
$27,912
11
$89,988
0
$0
APPLICATIONS WITHDRAWN
4
$111,258
13
$82,040
90
$102,173
8
$68,882
2
$109,865
0
$0
FILES CLOSED FOR INCOMPLETENESS
0
$0
6
$85,635
24
$111,347
1
$76,200
1
$75,960
0
$0
Aggregated Statistics For Year 2004 (Based on 2 full and 4 partial tracts)
A) FHA, FSA/RHS & VA Home Purchase Loans
B) Conventional Home Purchase Loans
C) Refinancings
D) Home Improvement Loans
F) Non-occupant Loans on < 5 Family Dwellings (A B C & D)
Number
Average Value
Number
Average Value
Number
Average Value
Number
Average Value
Number
Average Value
LOANS ORIGINATED
36
$126,028
161
$86,625
251
$95,283
60
$32,214
22
$85,485
APPLICATIONS APPROVED, NOT ACCEPTED
0
$0
9
$90,980
46
$84,174
11
$14,165
6
$94,025
APPLICATIONS DENIED
4
$125,120
16
$82,961
119
$101,136
47
$30,277
2
$55,715
APPLICATIONS WITHDRAWN
7
$121,529
7
$114,964
87
$95,998
10
$28,663
2
$75,165
FILES CLOSED FOR INCOMPLETENESS
0
$0
3
$57,943
43
$107,838
0
$0
1
$27,400
Aggregated Statistics For Year 2003 (Based on 2 full and 4 partial tracts)
A) FHA, FSA/RHS & VA Home Purchase Loans
B) Conventional Home Purchase Loans
C) Refinancings
D) Home Improvement Loans
F) Non-occupant Loans on < 5 Family Dwellings (A B C & D)
Number
Average Value
Number
Average Value
Number
Average Value
Number
Average Value
Number
Average Value
LOANS ORIGINATED
68
$113,725
110
$95,797
724
$87,208
76
$21,538
40
$71,999
APPLICATIONS APPROVED, NOT ACCEPTED
2
$131,190
14
$106,057
46
$86,953
9
$22,127
8
$89,851
APPLICATIONS DENIED
3
$96,653
12
$52,725
174
$98,988
23
$17,245
8
$72,149
APPLICATIONS WITHDRAWN
1
$72,710
11
$97,238
126
$93,782
8
$15,221
1
$36,140
FILES CLOSED FOR INCOMPLETENESS
2
$92,740
3
$119,050
27
$98,538
4
$48,810
5
$88,778
Aggregated Statistics For Year 2002 (Based on 2 full and 2 partial tracts)
A) FHA, FSA/RHS & VA Home Purchase Loans
B) Conventional Home Purchase Loans
C) Refinancings
D) Home Improvement Loans
F) Non-occupant Loans on < 5 Family Dwellings (A B C & D)
Number
Average Value
Number
Average Value
Number
Average Value
Number
Average Value
Number
Average Value
LOANS ORIGINATED
36
$103,729
66
$91,334
408
$78,830
67
$17,028
29
$62,360
APPLICATIONS APPROVED, NOT ACCEPTED
1
$141,170
11
$91,808
40
$70,692
13
$32,008
2
$42,955
APPLICATIONS DENIED
8
$95,180
6
$111,763
105
$78,289
21
$12,970
2
$41,670
APPLICATIONS WITHDRAWN
3
$101,707
3
$71,373
105
$85,220
10
$27,184
0
$0
FILES CLOSED FOR INCOMPLETENESS
0
$0
6
$84,223
30
$90,991
0
$0
0
$0
Aggregated Statistics For Year 2001 (Based on 2 full and 2 partial tracts)
A) FHA, FSA/RHS & VA Home Purchase Loans
B) Conventional Home Purchase Loans
C) Refinancings
D) Home Improvement Loans
F) Non-occupant Loans on < 5 Family Dwellings (A B C & D)
Number
Average Value
Number
Average Value
Number
Average Value
Number
Average Value
Number
Average Value
LOANS ORIGINATED
54
$99,469
36
$91,673
333
$71,786
56
$12,356
17
$67,137
APPLICATIONS APPROVED, NOT ACCEPTED
2
$110,310
2
$65,055
40
$69,996
7
$28,580
2
$47,835
APPLICATIONS DENIED
4
$114,615
10
$87,936
101
$64,771
24
$11,633
7
$50,700
APPLICATIONS WITHDRAWN
0
$0
3
$49,217
77
$86,619
7
$46,001
0
$0
FILES CLOSED FOR INCOMPLETENESS
0
$0
3
$60,153
23
$86,656
4
$12,608
1
$49,320
Aggregated Statistics For Year 2000 (Based on 2 full and 2 partial tracts)
A) FHA, FSA/RHS & VA Home Purchase Loans
B) Conventional Home Purchase Loans
C) Refinancings
D) Home Improvement Loans
F) Non-occupant Loans on < 5 Family Dwellings (A B C & D)
Number
Average Value
Number
Average Value
Number
Average Value
Number
Average Value
Number
Average Value
LOANS ORIGINATED
57
$92,096
59
$86,027
151
$51,431
87
$16,263
14
$54,669
APPLICATIONS APPROVED, NOT ACCEPTED
1
$47,200
6
$135,012
23
$60,226
18
$20,634
0
$0
APPLICATIONS DENIED
1
$90,570
13
$75,792
67
$54,600
40
$17,253
2
$113,100
APPLICATIONS WITHDRAWN
3
$109,273
6
$73,517
40
$70,080
5
$23,328
0
$0
FILES CLOSED FOR INCOMPLETENESS
0
$0
0
$0
26
$90,077
0
$0
0
$0
Aggregated Statistics For Year 1999 (Based on 1 full and 2 partial tracts)
A) FHA, FSA/RHS & VA Home Purchase Loans
B) Conventional Home Purchase Loans
C) Refinancings
D) Home Improvement Loans
F) Non-occupant Loans on < 5 Family Dwellings (A B C & D)
2002 - 2018 National Fire Incident Reporting System (NFIRS) incidents
According to the data from the years 2002 - 2018 the average number of fire incidents per year is 7. The highest number of reported fires - 15 took place in 2006, and the least - 0 in 2010. The data has a decreasing trend.
When looking into fire subcategories, the most incidents belonged to: Structure Fires (45.5%), and Outside Fires (25.0%).
Fire incident types reported to NFIRS in Zip Code 68157


 Nearest zip codes: 68117, 68147, 68107, 68106, 68127, 68133.


 According to the data from the years 2002 - 2018 the average number of fire incidents per year is 7. The highest number of reported fires - 15 took place in 2006, and the least - 0 in 2010. The data has a decreasing trend.
 When looking into fire subcategories, the most incidents belonged to: Structure Fires (45.5%), and Outside Fires (25.0%).