Estimated zip code population in 2022: 18,006 Zip code population in 2010: 18,097 Zip code population in 2000: 19,342
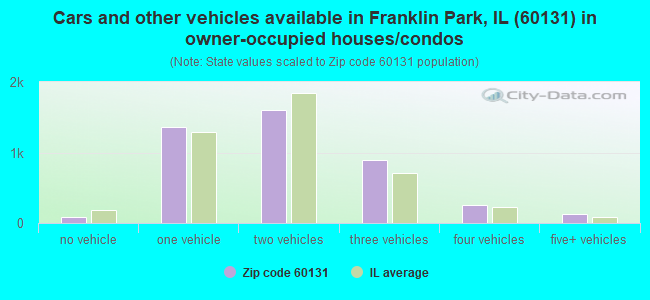
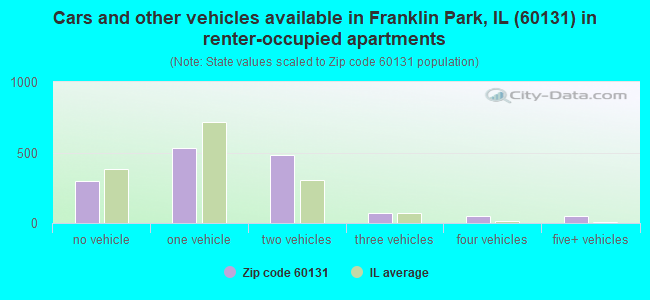
Houses and condos: 6,209 Renter-occupied apartments: 1,524
% of renters here:
26%
State:
33%
March 2022 cost of living index in zip code 60131: 100.2 (near average, U.S. average is 100)
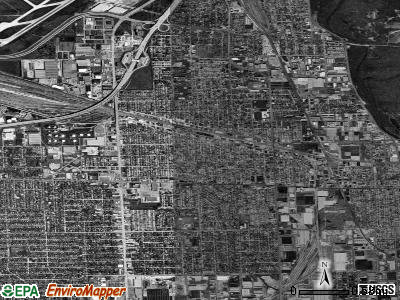
Land area: 5.5 sq. mi. Water area: 0.0 sq. mi.
Population density: 3,245 people per square mile
(average).
OSM Map
General Map
Google Map
MSN Map
OSM Map
General Map
Google Map
MSN Map
OSM Map
General Map
Google Map
MSN Map
OSM Map
General Map
Google Map
MSN Map
Please wait while loading the map...
Real estate property taxes paid for housing units in 2022:
This zip code:
2.4% ($6,225)
Illinois:
2.0% ($4,912)
Median real estate property taxes paid for housing units with mortgages in 2022: $6,283 (2.4%) Median real estate property taxes paid for housing units with no mortgage in 2022: $5,978 (2.3%)
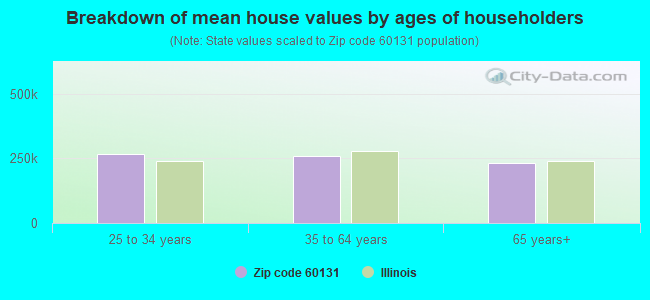
Estimated median house/condo value in 2022: $259,387
60131:
$259,387
Illinois:
$251,600
According to our research of Illinois and other state lists, there were 17 registered sex offenders living in 60131 zip code as of June 08, 2024. The ratio of all residents to sex offenders in zip code 60131 is 1,078 to 1. The ratio of registered sex offenders to all residents in this zip code is lower than the state average.
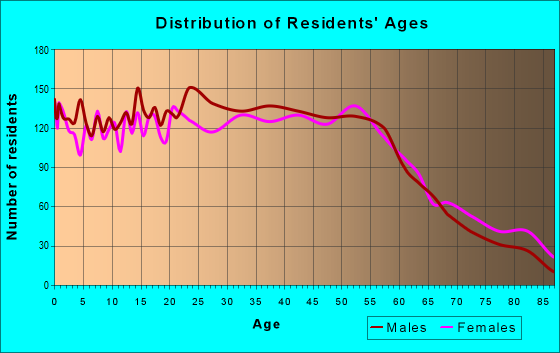
Median resident age:
This zip code:
37.2 years
Illinois median age:
39.1 years
Average household size:
This zip code:
3.1 people
Illinois:
2.4 people
Averages for the 2020 tax year for zip code 60131, filed in 2021:
Average Adjusted Gross Income (AGI) in 2020: $49,871 (Individual Income Tax Returns)
Here:
$49,871
State:
$82,626
Salary/wage: $46,486 (reported on 82.3% of returns)
Here:
$46,486
State:
$66,640
(% of AGI for various income ranges: 1138.6% for AGIs below $25k, 3660.0% for AGIs $25k-50k, 6507.7% for AGIs $50k-75k, 9880.0% for AGIs $75k-100k, 16652.0% for AGIs $100k-200k, 84785.0% for AGIs over 200k)
Taxable interest for individuals: $884 (reported on 18.2% of returns)
This zip code:
$884
Illinois:
$2,376
(% of AGI for various income ranges: 12.1% for AGIs below $25k, 11.0% for AGIs $25k-50k, 15.1% for AGIs $50k-75k, 33.8% for AGIs $75k-100k, 68.9% for AGIs $100k-200k, 1095.0% for AGIs over 200k)
Ordinary dividends: $3,174 (reported on 9.7% of returns)
Here:
$3,174
State:
$9,061
(% of AGI for various income ranges: 11.7% for AGIs below $25k, 19.8% for AGIs $25k-50k, 27.9% for AGIs $50k-75k, 34.8% for AGIs $75k-100k, 153.9% for AGIs $100k-200k, 3835.0% for AGIs over 200k)
Net capital gain/loss in AGI: +$7,639 (reported on 8.4% of returns)
Here:
+$7,639
State:
+$31,684
(% of AGI for various income ranges: 9.7% for AGIs below $25k, 12.7% for AGIs $25k-50k, 25.9% for AGIs $50k-75k, 53.5% for AGIs $75k-100k, 274.6% for AGIs $100k-200k, 16695.0% for AGIs over 200k)
Profit/loss from business: +$10,343 (reported on 17.1% of returns)
Here:
+$10,343
State:
+$12,175
(% of AGI for various income ranges: 271.0% for AGIs below $25k, 275.7% for AGIs $25k-50k, 216.0% for AGIs $50k-75k, 180.0% for AGIs $75k-100k, 174.3% for AGIs $100k-200k)
Taxable individual retirement arrangement distribution: $14,449 (reported on 5.6% of returns)
60131:
$14,449
Illinois:
$21,613
(% of AGI for various income ranges: 49.3% for AGIs below $25k, 52.8% for AGIs $25k-50k, 101.3% for AGIs $50k-75k, 164.1% for AGIs $75k-100k, 555.5% for AGIs $100k-200k)
Total itemized deductions: $23,102 (reported on 6.4% of returns)
Here:
$23,102
State:
$34,948
(% of AGI for various income ranges: 32.0% for AGIs below $25k, 124.9% for AGIs $25k-50k, 250.4% for AGIs $50k-75k, 438.2% for AGIs $75k-100k, 599.3% for AGIs $100k-200k, 5505.0% for AGIs over 200k)
Charity contributions: $4,116 (reported on 4.0% of returns)
Here:
$4,116
State:
$13,122
(% of AGI for various income ranges: 10.8% for AGIs $25k-50k, 24.2% for AGIs $50k-75k, 55.5% for AGIs $75k-100k, 118.4% for AGIs $100k-200k)
Taxes paid: $8,217 (reported on 6.4% of returns)
60131:
$8,217
State:
$8,563
(% of AGI for various income ranges: 9.7% for AGIs below $25k, 44.1% for AGIs $25k-50k, 104.8% for AGIs $50k-75k, 175.8% for AGIs $75k-100k, 191.4% for AGIs $100k-200k, 1150.0% for AGIs over 200k)
Earned income credit: $2,093 (reported on 15.7% of returns)
Here:
$2,093
State:
$2,311
(% of AGI for various income ranges: 83.5% for AGIs below $25k, 59.3% for AGIs $25k-50k, 1.6% for AGIs $50k-75k)
Percentage of individuals using paid preparers for their 2020 taxes: 90.4%
Here:
90%
State:
93%
(% for various income ranges: 88.4% for AGIs below $25k, 91.1% for AGIs $25k-50k, 91.4% for AGIs $50k-75k, 92.4% for AGIs $75k-100k, 92.0% for AGIs $100k-200k, 88.9% for AGIs over 200k)
Averages for the 2012 tax year for zip code 60131, filed in 2013:
Average Adjusted Gross Income (AGI) in 2012: $40,452 (Individual Income Tax Returns)
Here:
$40,452
State:
$68,058
Salary/wage: $38,944 (reported on 82.8% of returns)
Here:
$38,944
State:
$55,396
(% of AGI for various income ranges: 71.6% for AGIs below $25k, 83.3% for AGIs $25k-50k, 84.6% for AGIs $50k-75k, 84.0% for AGIs $75k-100k, 80.0% for AGIs $100k-200k, 33.5% for AGIs over 200k)
Taxable interest for individuals: $842 (reported on 25.3% of returns)
This zip code:
$842
Illinois:
$1,969
(% of AGI for various income ranges: 0.7% for AGIs below $25k, 0.4% for AGIs $25k-50k, 0.4% for AGIs $50k-75k, 0.3% for AGIs $75k-100k, 1.0% for AGIs $100k-200k, 0.5% for AGIs over 200k)
Ordinary dividends: $2,852 (reported on 11.7% of returns)
Here:
$2,852
State:
$7,786
(% of AGI for various income ranges: 0.9% for AGIs below $25k, 0.6% for AGIs $25k-50k, 0.7% for AGIs $50k-75k, 0.8% for AGIs $75k-100k, 1.5% for AGIs $100k-200k)
Net capital gain/loss in AGI: +$1,301 (reported on 7.4% of returns)
Here:
+$1,301
State:
+$22,183
(% of AGI for various income ranges: 0.4% for AGIs $50k-75k, 0.8% for AGIs $100k-200k)
Profit/loss from business: +$9,856 (reported on 15.2% of returns)
Here:
+$9,856
State:
+$12,903
(% of AGI for various income ranges: 13.5% for AGIs below $25k, 4.6% for AGIs $25k-50k, 2.1% for AGIs $50k-75k, 0.9% for AGIs $75k-100k, 0.5% for AGIs $100k-200k)
Taxable individual retirement arrangement distribution: $11,879 (reported on 7.8% of returns)
60131:
$11,879
Illinois:
$17,929
(% of AGI for various income ranges: 3.3% for AGIs below $25k, 1.5% for AGIs $25k-50k, 1.7% for AGIs $50k-75k, 2.4% for AGIs $75k-100k, 3.6% for AGIs $100k-200k)
Total itemized deductions: $18,718 (27% of AGI, reported on 31.3% of returns)
Here:
$18,718
State:
$26,433
Here:
27.4% of AGI
State:
19.2% of AGI
(% of AGI for various income ranges: 9.9% for AGIs below $25k, 11.6% for AGIs $25k-50k, 16.7% for AGIs $50k-75k, 17.0% for AGIs $75k-100k, 16.0% for AGIs $100k-200k, 19.0% for AGIs over 200k)
Charity contributions: $1,621 (reported on 23.9% of returns)
Here:
$1,621
State:
$4,525
(% of AGI for various income ranges: 0.4% for AGIs below $25k, 0.6% for AGIs $25k-50k, 1.1% for AGIs $50k-75k, 1.1% for AGIs $75k-100k, 1.5% for AGIs $100k-200k, 0.7% for AGIs over 200k)
Taxes paid: $8,720 (reported on 31.2% of returns)
60131:
$8,720
State:
$11,968
(% of AGI for various income ranges: 4.1% for AGIs below $25k, 5.3% for AGIs $25k-50k, 7.8% for AGIs $50k-75k, 8.2% for AGIs $75k-100k, 7.9% for AGIs $100k-200k, 6.5% for AGIs over 200k)
Earned income credit: $2,143 (reported on 18.6% of returns)
Here:
$2,143
State:
$2,349
(% of AGI for various income ranges: 5.2% for AGIs below $25k, 1.1% for AGIs $25k-50k)
Percentage of individuals using paid preparers for their 2012 taxes: 64.9%
Here:
65%
State:
57%
(% for various income ranges: 61.9% for AGIs below $25k, 65.9% for AGIs $25k-50k, 67.4% for AGIs $50k-75k, 66.7% for AGIs $75k-100k, 70.4% for AGIs $100k-200k, 100.0% for AGIs over 200k)
Averages for the 2004 tax year for zip code 60131, filed in 2005:
Average Adjusted Gross Income (AGI) in 2004: $35,806 (Individual Income Tax Returns)
Here:
$35,806
State:
$54,625
Salary/wage: $35,454 (reported on 83.6% of returns)
Here:
$35,454
State:
$46,811
(% of AGI for various income ranges: 73.2% for AGIs below $10k, 73.4% for AGIs $10k-25k, 85.7% for AGIs $25k-50k, 87.8% for AGIs $50k-75k, 86.3% for AGIs $75k-100k, 72.9% for AGIs over 100k)
Taxable interest for individuals: $1,075 (reported on 44.7% of returns)
This zip code:
$1,075
Illinois:
$2,101
(% of AGI for various income ranges: 4.5% for AGIs below $10k, 2.1% for AGIs $10k-25k, 1.2% for AGIs $25k-50k, 1.1% for AGIs $50k-75k, 1.0% for AGIs $75k-100k, 1.3% for AGIs over 100k)
Taxable dividends: $1,778 (reported on 16.8% of returns)
Here:
$1,778
State:
$4,306
(% of AGI for various income ranges: 2.1% for AGIs below $10k, 1.2% for AGIs $10k-25k, 0.7% for AGIs $25k-50k, 0.6% for AGIs $50k-75k, 0.7% for AGIs $75k-100k, 1.2% for AGIs over 100k)
Net capital gain/loss: +$5,082 (reported on 10.7% of returns)
Here:
+$5,082
State:
+$17,321
(% of AGI for various income ranges: -1.6% for AGIs below $10k, 0.3% for AGIs $10k-25k, 0.2% for AGIs $25k-50k, 0.8% for AGIs $50k-75k, 1.4% for AGIs $75k-100k, 7.6% for AGIs over 100k)
Profit/loss from business: +$8,450 (reported on 13.8% of returns)
Here:
+$8,450
State:
+$11,771
(% of AGI for various income ranges: 16.7% for AGIs below $10k, 10.3% for AGIs $10k-25k, 2.9% for AGIs $25k-50k, 1.5% for AGIs $50k-75k, 0.7% for AGIs $75k-100k, 1.3% for AGIs over 100k)
IRA payment deduction: $2,912 (reported on 2.3% of returns)
60131:
$2,912
Illinois:
$3,087
(% of AGI for various income ranges: 0.2% for AGIs $10k-25k, 0.2% for AGIs $25k-50k, 0.2% for AGIs $50k-75k, 0.2% for AGIs $75k-100k, 0.1% for AGIs over 100k)
Total itemized deductions: $16,225 (29% of AGI, reported on 36.7% of returns)
Here:
$16,225
State:
$20,239
Here:
29.1% of AGI
State:
19.5% of AGI
(% of AGI for various income ranges: 12.2% for AGIs below $10k, 14.1% for AGIs $10k-25k, 17.6% for AGIs $25k-50k, 19.2% for AGIs $50k-75k, 16.2% for AGIs $75k-100k, 13.3% for AGIs over 100k)
Charity contributions deductions: $1,766 (3% of AGI, reported on 31.8% of returns)
Here:
$1,766
State:
$3,719
Here:
3.0% of AGI
State:
3.4% of AGI
(% of AGI for various income ranges: 0.5% for AGIs below $10k, 0.9% for AGIs $10k-25k, 1.4% for AGIs $25k-50k, 1.7% for AGIs $50k-75k, 2.0% for AGIs $75k-100k, 1.9% for AGIs over 100k)
Total tax: $3,892 (reported on 73.5% of returns)
60131:
$3,892
State:
$9,882
(% of AGI for various income ranges: 3.8% for AGIs below $10k, 4.3% for AGIs $10k-25k, 6.1% for AGIs $25k-50k, 7.6% for AGIs $50k-75k, 9.6% for AGIs $75k-100k, 15.1% for AGIs over 100k)
Earned income credit: $1,534 (reported on 15.3% of returns)
Here:
$1,534
State:
$1,788
Percentage of individuals using paid preparers for their 2004 taxes: 64.1%
Here:
64%
State:
61%
(% for various income ranges: 54.8% for AGIs below $10k, 67.2% for AGIs $10k-25k, 65.3% for AGIs $25k-50k, 66.2% for AGIs $50k-75k, 67.5% for AGIs $75k-100k, 69.8% for AGIs over 100k)
Household received Food Stamps/SNAP in the past 12 months: 831 Household did not receive Food Stamps/SNAP in the past 12 months: 5,026
Women who had a birth in the past 12 months: 113 (79 now married, 33 unmarried) Women who did not have a birth in the past 12 months: 4,375 (1,695 now married, 2,680 unmarried)
Housing units in zip code 60131 with a mortgage: 2,900 (87 second mortgage, 56 both second mortgage and home equity loan) Houses without a mortgage: 42
Median monthly owner costs for units with a mortgage: $1,849 Median monthly owner costs for units without a mortgage: $813
Residents with income below the poverty level in 2022:
This zip code:
14.4%
Whole state:
11.9%
Residents with income below 50% of the poverty level in 2022:
This zip code:
9.8%
Whole state:
5.7%
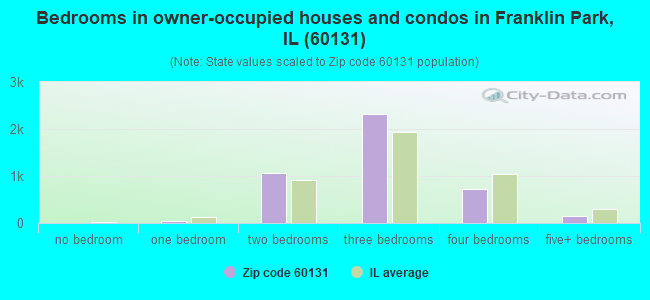
Median number of rooms in houses and condos:
Here:
5.8
State:
6.4
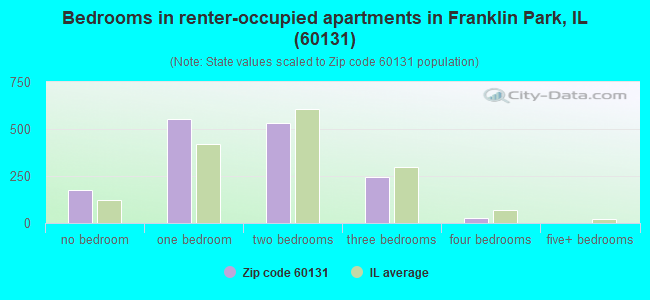
Median number of rooms in apartments:
Here:
3.9
State:
4.1
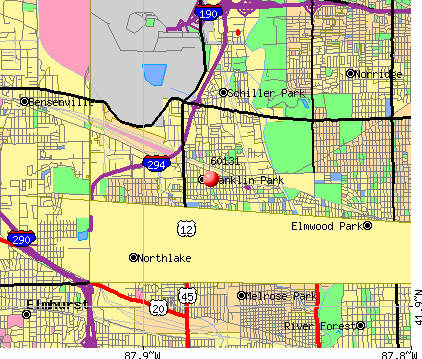
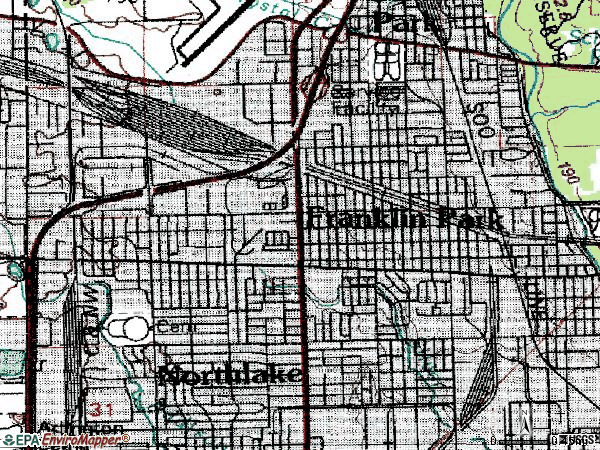
Notable locations in this zip code not listed on our city pages
Notable locations in zip code 60131: Mannheim (A), Franklin Park Fire Department Station 3 (B), Franklin Park Fire Department Station 1 (C), Franklin Park Fire Department Station 2 (D), Franklin Park Village Hall (E). Display/hide their locations on the map
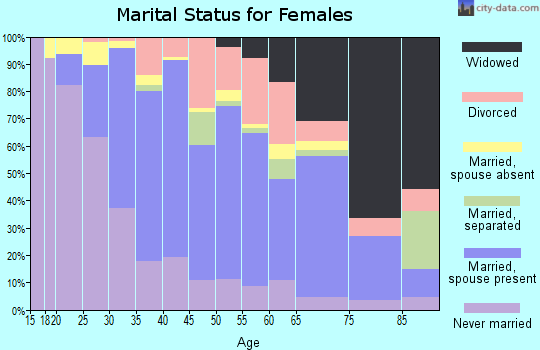
2,326 married couples with children.
1,389 single-parent households (494 men, 895 women).
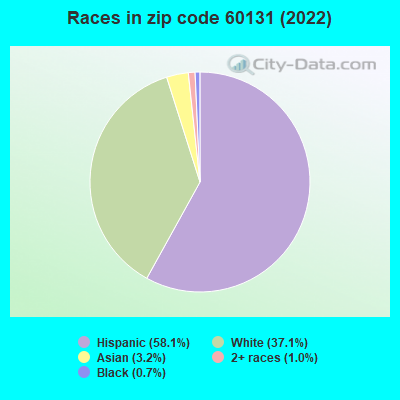
38.1% of residents of 60131 zip code speak English at home.
46.7% of residents speak Spanish at home (55% very well, 15% well, 15% not well, 15% not at all).
12.7% of residents speak other Indo-European language at home (65% very well, 21% well, 13% not well, 1% not at all).
1.7% of residents speak Asian or Pacific Island language at home (74% very well, 24% well, 1% not well).
1.5% of residents speak other language at home (83% very well, 3% well, 10% not well, 4% not at all).
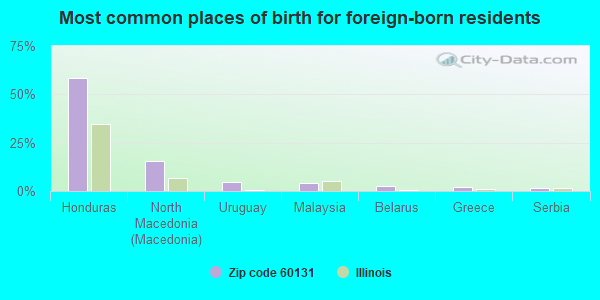
Foreign born population: 5,902 (32.8%) (47.3% of them are naturalized citizens)
This zip code:
32.8%
Whole state:
14.4%
59%Honduras
15%North Macedonia (Macedonia)
5%Uruguay
4%Malaysia
3%Belarus
2%Greece
2%Serbia
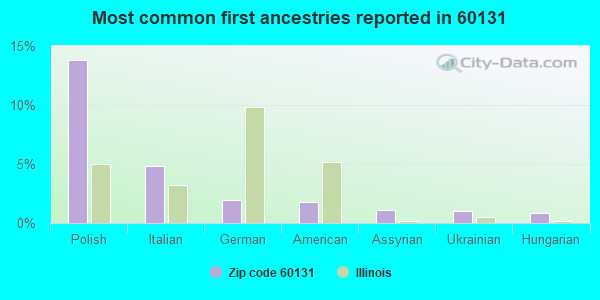
14%Polish
5%Italian
2%German
2%American
1%Assyrian
1%Ukrainian
1%Hungarian
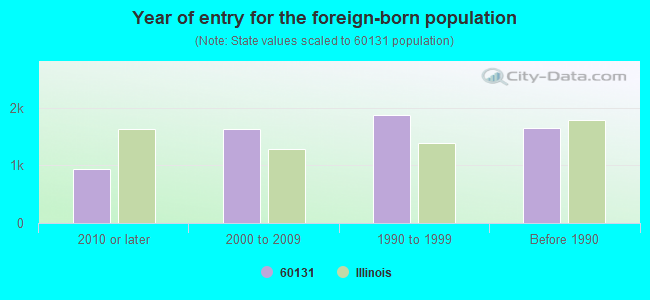
Year of entry for the foreign-born population
9452010 or later
1,6262000 to 2009
1,8771990 to 1999
1,652Before 1990
Major facilities with environmental interests located in this zip code:
AMERICAN STANDARD CIRCUITS INC (3615 WOLF RD. in FRANKLIN PARK, IL)
STATE MASTER (Illinois EPA Project) - HAZARDOUS WASTE PROGRAM, AIR PROGRAM, SOLID WASTE PROGRAM AIR MINOR (AIRS/AFS) ENFORCEMENT/COMPLIANCE ACTIVITY (Integrated Compliance Information System) - ICIS-05-2002-1105, FORMAL ENFORCEMENT ACTION (Integrated Compliance Information System) - ICIS-05-2002-1105, FORMAL ENFORCEMENT ACTION (Integrated Compliance Information System) - ICIS-05-2002-1012, FORMAL ENFORCEMENT ACTION CRITERIA AND HAZARDOUS AIR POLLUTANT INVENTORY (Inventory of air pollution sources) HAZARDOUS WASTE BIENNIAL REPORTER (Resource Conservation and Recovery Act (tracking hazardous waste)) - ICIS-, ENFORCEMENT/COMPLIANCE ACTIVITY Large Quantity Generators, more that 1000 kg of hazardous waste/month (Resource Conservation and Recovery Act (tracking hazardous waste)) - notification - ICIS-, ENFORCEMENT/COMPLIANCE ACTIVITY TRI REPORTER (Tracking of toxic chemicals releasing facilities) Business SIC classification: PRINTED CIRCUIT BOARDS Business NAICS classification: BARE PRINTED CIRCUIT BOARD MANUFACTURING.
MAGELLAN PIPELINE CO LP-CHICAGO TERMINAL (10601 FRANKLIN AVENUE in FRANKLIN PARK, IL)
STATE MASTER (Illinois EPA Project) - HAZARDOUS WASTE PROGRAM, AIR PROGRAM, SOLID WASTE PROGRAM AIR MAJOR (AIRS/AFS) SUPERFUND (Superfund database) OIL CONTROL (Facility Response Plan for oil discharge) (Integrated Compliance Information System) - ICIS-05-1979-0077, FORMAL ENFORCEMENT ACTION CRITERIA AND HAZARDOUS AIR POLLUTANT INVENTORY (Inventory of air pollution sources) National Pollutant Discharge Elimination System NON-MAJOR (Tracking pollutant discharge elimination systems) - permit HAZARDOUS WASTE BIENNIAL REPORTER (Resource Conservation and Recovery Act (tracking hazardous waste)) Large Quantity Generators, more that 1000 kg of hazardous waste/month (Resource Conservation and Recovery Act (tracking hazardous waste)) Business SIC classification: REFINED PETROLEUM PIPELINES; TRANSPORTATION SERVICES Business NAICS classification: PIPELINE TRANSPORTATION OF REFINED PETROLEUM PRODUCTS. Organizations: MAGELLAN PIPELINE COMPANY (CONTACT/GENERAL)
, WILLIAMS PIPE LINE CO (CONTACT/OWNER)
Alternative names: MAGELLAN MIDSTREAM PARTNERS, MAGELLAN PIPELINE COMPANY, LLC CHICAGO, ILLINOIS TERMINAL, MAGELLAN PIPELINE COMPANY LLC CHICAGO TERMINAL, WILLIAMS PIPE LINE CO, WILLIAMS PIPE LINE COMPANY CHICAGO, WILLIAMS PIPELINE CHICAGO, WILLIAMS PIPELINE-FRANKLIN PK
MACLEAN POWER SYSTEMS INC (11411 ADDISON ST. in FRANKLIN PARK, IL)
STATE MASTER (Illinois EPA Project) - HAZARDOUS WASTE PROGRAM, AIR PROGRAM, SOLID WASTE PROGRAM STATE MASTER (Illinois EPA Project) - National Pollutant Discharge Elimination System Permit AIR MAJOR (AIRS/AFS) National Pollutant Discharge Elimination System NON-MAJOR (Tracking pollutant discharge elimination systems) - permit HAZARDOUS WASTE BIENNIAL REPORTER (Resource Conservation and Recovery Act (tracking hazardous waste)) Small Quantity Generators, between 100 kg and 1000 kg of hazardous waste/month (Resource Conservation and Recovery Act (tracking hazardous waste)) - notification TRI REPORTER (Tracking of toxic chemicals releasing facilities) Business SIC classification: NONCURRENT-CARRYING WIRING DEVICES; TELEPHONE AND TELEGRAPH APPARATUS Business NAICS classification: METAL STAMPING. Organizations: RELIABLE POWER PRODUCTS (CONTACT/OWNER)
, MACLEAN FOGG COMPANY (CONTACT/OWNER)
Alternative names: RELIABLE POWER PRODUCTS
RIXSON-FIREMARK INC (9100 WEST BELMONT AVENUE in FRANKLIN PARK, IL)
STATE MASTER (Illinois EPA Project) - HAZARDOUS WASTE PROGRAM, AIR PROGRAM, SOLID WASTE PROGRAM AIR MINOR (AIRS/AFS) (Integrated Compliance Information System) - ICIS-05-1996-0112, FORMAL ENFORCEMENT ACTION CRITERIA AND HAZARDOUS AIR POLLUTANT INVENTORY (Inventory of air pollution sources) Large Quantity Generators, more that 1000 kg of hazardous waste/month (Resource Conservation and Recovery Act (tracking hazardous waste)) - notification TRI REPORTER (Tracking of toxic chemicals releasing facilities) Business SIC classification: HARDWARE Alternative names: CONRAC CORP RIXSON-FIREMARK
NATIONAL CONCRETE PIPE COMPANY (11825 FRANKLIN AVE. in FRANKLIN PARK, IL)
STATE MASTER (Illinois EPA Project) - AIR PROGRAM, SOLID WASTE PROGRAM STATE MASTER (Illinois EPA Project) - National Pollutant Discharge Elimination System Permit AIR MINOR (AIRS/AFS) CRITERIA AND HAZARDOUS AIR POLLUTANT INVENTORY (Inventory of air pollution sources) National Pollutant Discharge Elimination System NON-MAJOR (Tracking pollutant discharge elimination systems) - permit Business SIC classification: CONCRETE PRODUCTS, EXCEPT BLOCK AND BRICK
AMERICAN / JEBCO CORPORTION (11330 W. MELROSE ST. in FRANKLIN PARK, IL)
STATE MASTER (Illinois EPA Project) - AIR PROGRAM, HAZARDOUS WASTE PROGRAM, SOLID WASTE PROGRAM, AIR PROGRAM AIR MINOR (AIRS/AFS) CRITERIA AND HAZARDOUS AIR POLLUTANT INVENTORY (Inventory of air pollution sources) HAZARDOUS WASTE BIENNIAL REPORTER (Resource Conservation and Recovery Act (tracking hazardous waste)) Large Quantity Generators, more that 1000 kg of hazardous waste/month (Resource Conservation and Recovery Act (tracking hazardous waste)) - notification TRI REPORTER (Tracking of toxic chemicals releasing facilities) Business SIC classification: BOLTS, NUTS, SCREWS, RIVETS, AND WASHERS; ELECTROPLATING, PLATING, POLISHING, ANODIZING, AND COLORING Business NAICS classification: BOLT, NUT, SCREW, RIVET, AND WASHER MANUFACTURING.; ELECTROPLATING, PLATING, POLISHING, ANODIZING, AND COLORING.; ELECTROPLATING, PLATING, POLISHING, ANODIZING, AND COLORING. Organizations: AMERICAN JEBCO CORP (CONTACT/OPERATOR)
, MATTHEW OCONNOR (CONTACT/OWNER)
Alternative names: AMERICAN JEBCO CORP., AMERICAN JEBCO CORP., AMERICAN RIVET CO
MAGIE BROTHERS OIL CO (9101 FULLERTON AVENUE in FRANKLIN PARK, IL)
STATE MASTER (Illinois EPA Project) - HAZARDOUS WASTE PROGRAM, AIR PROGRAM, SOLID WASTE PROGRAM STATE MASTER (Illinois EPA Project) - National Pollutant Discharge Elimination System Permit AIR SYNTHETIC MINOR (AIRS/AFS) CRITERIA AND HAZARDOUS AIR POLLUTANT INVENTORY (Inventory of air pollution sources) National Pollutant Discharge Elimination System NON-MAJOR (Tracking pollutant discharge elimination systems) - permit Small Quantity Generators, between 100 kg and 1000 kg of hazardous waste/month (Resource Conservation and Recovery Act (tracking hazardous waste)) - notification TRI REPORTER (Tracking of toxic chemicals releasing facilities) Business SIC classification: LUBRICATING OILS AND GREASES; PETROLEUM BULK STATIONS AND TERMINALS Organizations: PENNZOIL CO. (CONTACT/OWNER)
Alternative names: MAGIE BROS., PENRECO
INDIANA HARBOR BELT (9400 FULLERTON in FRANKLIN PARK, IL)
STATE MASTER (Illinois EPA Project) - AIR PROGRAM, SOLID WASTE PROGRAM STATE MASTER (Illinois EPA Project) - National Pollutant Discharge Elimination System Permit AIR MINOR (AIRS/AFS) National Pollutant Discharge Elimination System NON-MAJOR (Tracking pollutant discharge elimination systems) - permit Business SIC classification: NONCLASSIFIABLE ESTABLISHMENTS Organizations: INDIANA HARBOR BELT (CONS. RA (CONTACT/OWNER)
Alternative names: INDIANA HARBOR BELT (CONS. RA
SAMUEL BINGHAM CO (11101 FRANKLIN AVE in FRANKLIN PARK, IL)
STATE MASTER (Illinois EPA Project) - HAZARDOUS WASTE PROGRAM, AIR PROGRAM, SOLID WASTE PROGRAM AIR MINOR (AIRS/AFS) COMPLIANCE ACTIVITY (Tracking inspections of insecticide, fungicide, and rodenticide, and toxic substances) CRITERIA AND HAZARDOUS AIR POLLUTANT INVENTORY (Inventory of air pollution sources) Large Quantity Generators, more that 1000 kg of hazardous waste/month (Resource Conservation and Recovery Act (tracking hazardous waste)) - notification Small Quantity Generators, between 100 kg and 1000 kg of hazardous waste/month (Resource Conservation and Recovery Act (tracking hazardous waste)) - notification TRI REPORTER (Tracking of toxic chemicals releasing facilities) Business SIC classification: FABRICATED RUBBER PRODUCTS Organizations: JENKINS ROBERT (CONTACT/OWNER)
Alternative names: BINGHAM SAMUEL CO
NESTLE FOOD CO (3401 MT. PROSPECT RD in FRANKLIN PARK, IL)
STATE MASTER (Illinois EPA Project) - HAZARDOUS WASTE PROGRAM, AIR PROGRAM, SOLID WASTE PROGRAM AIR SYNTHETIC MINOR (AIRS/AFS) CRITERIA AND HAZARDOUS AIR POLLUTANT INVENTORY (Inventory of air pollution sources) National Pollutant Discharge Elimination System NON-MAJOR (Tracking pollutant discharge elimination systems) - permit National Pollutant Discharge Elimination System NON-MAJOR (Tracking pollutant discharge elimination systems) - permit Small Quantity Generators, between 100 kg and 1000 kg of hazardous waste/month (Resource Conservation and Recovery Act (tracking hazardous waste)) TRI REPORTER (Tracking of toxic chemicals releasing facilities) Business SIC classification: CANDY AND OTHER CONFECTIONERY PRODUCTS Organizations: NESTLE CHOCOLATE & CONFECTION (CONTACT/OWNER)
, NESTLE FOODS CORP (CONTACT/OWNER)
Alternative names: NESTLE CHOCOLATE & CONFECTION, NESTLE CHOCOLATE & CONFECTIONS, NESTLE FOODS
PLEXCO (10423 FRANKLIN AVE in FRANKLIN PARK, IL)
STATE MASTER (Illinois EPA Project) - HAZARDOUS WASTE PROGRAM, AIR PROGRAM STATE MASTER (Illinois EPA Project) - National Pollutant Discharge Elimination System Permit AIR MAJOR (AIRS/AFS) National Pollutant Discharge Elimination System NON-MAJOR (Tracking pollutant discharge elimination systems) - permit Conditionally Exempt Small Quantity Generators, less than 100 kg/month of hazardous waste (Resource Conservation and Recovery Act (tracking hazardous waste)) - notification Business SIC classification: COATING, ENGRAVING, AND ALLIED SERVICES Organizations: PLEXCO SPIROLITE DIV. CHEVRON (CONTACT/OWNER)
, CHEVRON CHEMICAL CO (CONTACT/OWNER)
Alternative names: PLEXCO SPIROLITE
HUNTER PANELS (9201 BELMONT AVENUE in FRANKLIN PARK, IL)
STATE MASTER (Illinois EPA Project) - AIR PROGRAM STATE MASTER (Illinois EPA Project) - National Pollutant Discharge Elimination System Permit AIR SYNTHETIC MINOR (AIRS/AFS) CRITERIA AND HAZARDOUS AIR POLLUTANT INVENTORY (Inventory of air pollution sources) National Pollutant Discharge Elimination System NON-MAJOR (Tracking pollutant discharge elimination systems) - permit TRI REPORTER (Tracking of toxic chemicals releasing facilities) Business SIC classification: PLASTICS FOAM PRODUCTS Alternative names: HUNTER PANEL L.L.C., HUNTER PANEL LLC, HUNTER PANELS LLC, HUNTER PANELS LLC-FRANKLIN PK
JOSLYN CORPORATION - E A D (9200 W. FULLERTON AVE. in FRANKLIN PARK, IL)
STATE MASTER (Illinois EPA Project) - HAZARDOUS WASTE PROGRAM, AIR PROGRAM, SOLID WASTE PROGRAM AIR MINOR (AIRS/AFS) CRITERIA AND HAZARDOUS AIR POLLUTANT INVENTORY (Inventory of air pollution sources) National Pollutant Discharge Elimination System NON-MAJOR (Tracking pollutant discharge elimination systems) - permit Conditionally Exempt Small Quantity Generators, less than 100 kg/month of hazardous waste (Resource Conservation and Recovery Act (tracking hazardous waste)) TRI REPORTER (Tracking of toxic chemicals releasing facilities) Business SIC classification: CURRENT-CARRYING WIRING DEVICES; NONCURRENT-CARRYING WIRING DEVICES Alternative names: JOSLYN MANUFACTURING, JOSYN MFG., MACLEAN POWER JOSLYN
Housing units lacking complete plumbing facilities: 0.7% Housing units lacking complete kitchen facilities: 1.4%
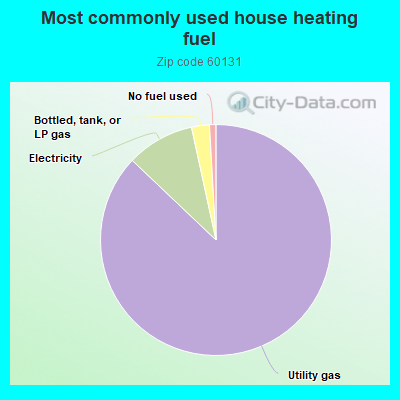
87.1%Utility gas
9.5%Electricity
2.5%Bottled, tank, or LP gas
0.9%No fuel used
Population in 1990: 18,572. Population change in the 1990s: +770 (+4.1%).
Place of birth for U.S.-born residents:
This state: 10,976
Northeast: 196
Midwest: 204
South: 160
West: 261
67% of the 60131 zip code residents lived in the same house 5 years ago. Out of people who lived in different houses, 88% lived in this county. Out of people who lived in different counties, 50% lived in Illinois.
97% of the 60131 zip code residents lived in the same house 1 year ago. Out of people who lived in different houses, 70% moved from this county. Out of people who lived in different houses, 4% moved from different county within same state. Out of people who lived in different houses, 25% moved from different state.
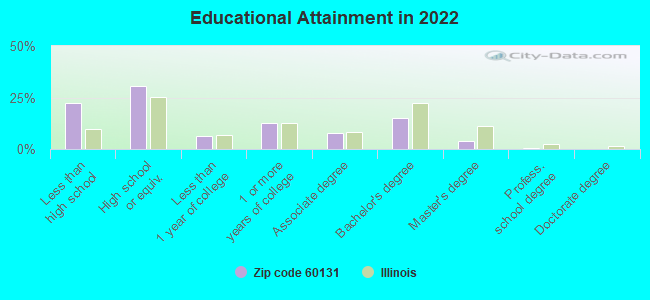
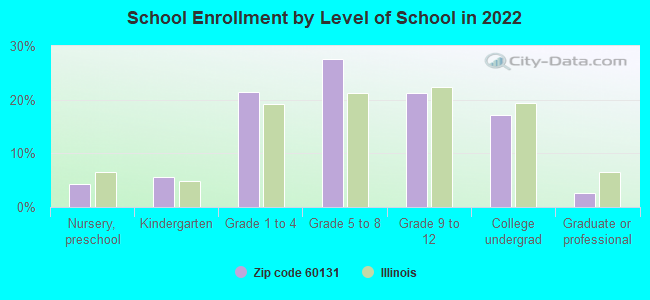
Private vs. public school enrollment:
Students in private schools in grades 1 to 8 (elementary and middle school): 156
Here:
6.5%
Illinois:
13.3%
Students in private schools in grades 9 to 12 (high school): 73
Here:
7.0%
Illinois:
9.9%
Students in private undergraduate colleges: 221
Here:
26.3%
Illinois:
27.4%
Occupation by median earnings in the past 12 months ($)
77,019Architecture and engineering occupations
71,720Management occupations
67,297Business and financial operations occupations
66,334Transportation occupations
65,728Life, physical, and social science occupations
64,714Computer and mathematical occupations
Companies with biggest federal contracts located in this zip code (FRANKLIN PARK, IL):
KOVILIC CONSTRUCTION CO INC (3721 CARNATION ST; small business) : $10,522,602 in 52 contractsfrom 2000 to 2006
Contracts for Maintenance, Repair or Alteration of Real Property -- Tunnels and Subsurface Structures, Construction of Structures and Facilities -- Other Conservation and Development Facilities, Maintenance, Repair or Alteration of Real Property -- Office Buildings, Construction of Structures and Facilities -- Other Administrative Facilities and Service Buildings, and moreby Saint Lawrence Seaway Development Corporation, U.S. Army Corps of Engineers - civil program financing only, Public Buildings Service, Army, and others Signed by year:2000: $2,856,137; 2001: $2,741,207; 2002: $1,237,604; 2003: $116,892; 2004: $962,162; 2005: $2,907,700; 2006: -$299,100.
Biggest contracts:
$1,399,100 with Saint Lawrence Seaway Development Corporation for Maintenance, Repair or Alteration of Real Property -- Tunnels and Subsurface Structures. Taking place in NY. Signed on 2005-09-29. Completion date: 2006-03-31.
$1,134,000 with U.S. Army Corps of Engineers - civil program financing only for Construction of Structures and Facilities -- Other Conservation and Development Facilities. Signed on 2000-03-30. Completion date: 2002-03-30.
$1,066,000, same as above.Signed on 2001-02-06. Completion date: 2002-03-30.
$1,000,000 with Public Buildings Service for Maintenance, Repair or Alteration of Real Property -- Office Buildings. Signed on 2002-02-15. Completion date: 2001-09-15.
SCHMID TOOL & ENGINEERING (9101 BELDEN AVE; small business) : $1,038,274 in 23 contractsfrom 2000 to 2006
Contracts for Guns, through 30 mm by Army, Defense Logistics Agency Signed by year:2000: $38,889; 2001: $68,840; 2002: $323,841; 2003: $295,050; 2004: $116,678; 2005: $105,789; 2006: $89,187.
Biggest contracts:
$124,749 with Army for Guns, through 30 mm. Signed on 2002-02-22. Completion date: 2005-09-30.
$91,998, same as above.Signed on 2004-04-01. Completion date: 2005-09-30.
$80,700, same as above.Signed on 2003-11-24. Completion date: 2005-09-30.
$78,538, same as above.Signed on 2002-11-26. Completion date: 2005-09-30.
MANDEL METALS, INC (11400 WEST ADDISON ST; small business) : $729,729 in 18 contractsfrom 2000 to 2006
Contracts for Plate, Sheet, Strip, and Foil; Nonferrous Base Metal, Pipe, Tube and Rigid Tubing, Bars and Rods by Army Signed by year:2000: $67,679; 2001: $0; 2002: $0; 2003: $0; 2004: $89,971; 2005: $540,691; 2006: $31,388.
Biggest contracts:
$412,494 with Army for Plate, Sheet, Strip, and Foil; Nonferrous Base Metal. Signed on 2005-08-04. Completion date: 2006-10-01.
$67,679, same as above.Signed on 2000-11-09. Completion date: 2000-12-07.
$54,318, same as above.Signed on 2005-08-09. Completion date: 2006-05-01.
$53,844, same as above.Signed on 2004-03-22. Completion date: 2004-04-15.
DEL MEDICAL IMAGING (11550 W KING AVENUE; small business) : $531,671 in 25 contractsfrom 2002 to 2006
Contracts for X-Ray Equipment and Supplies: Medical, Dental, Veterinary, Other Medical Services, Medical and Surgical Instruments, Equipment, and Supplies, Photographic Equipment and Accessories, and moreby Department of Veterans Affairs, Indian Health Service, Defense Logistics Agency, Army, and others Signed by year:2000: $0; 2001: $0; 2002: $50,115; 2003: $82,800; 2004: $46,616; 2005: $204,982; 2006: $147,158.
Biggest contracts:
$76,577 with Department of Veterans Affairs for X-Ray Equipment and Supplies: Medical, Dental, Veterinary. Signed on 2005-09-30. Completion date: 2005-09-30.
$68,858 with Indian Health Service for Other Medical Services. Taking place in SD. Signed on 2006-07-26. Completion date: 2007-03-23.
$50,115 with Defense Logistics Agency for X-Ray Equipment and Supplies: Medical, Dental, Veterinary. Signed on 2002-04-13. Completion date: 2002-07-11.
$39,150, same as above.Signed on 2003-10-29. Completion date: 2004-02-25.
OHMAN DESCALING SERVICES INC (10625 FRANKLIN AVE; small business)
$143,800 with Navy for Facilities Operations Support Services. Signed on 2002-06-04. Completion date: 2002-07-04.
CONSOLIDATED ELECTRONIC WIRE & (11044 KING ST; small business) : $133,668 in 2 contractsin 2005
$102,200 with Department of Defense for Miscellaneous Electrical and Electronic Components. Signed on 2005-03-31. Completion date: 2005-06-08.
$31,468, same as above.Signed on 2005-09-07. Completion date: 2005-11-16.
AERO APMC, INC (411 S COUNTY LINE RD; small business) : $85,723 in 2 contractsfrom 2002 to 2005
$53,820 with Defense Logistics Agency for Chain and Wire Rope. Signed on 2002-09-30. Completion date: 2002-12-29.
$31,903 with Defense Logistics Agency for Aircraft Landing Gear Components. Signed on 2005-06-30. Completion date: 2005-08-14.
AERO APMC, INC (411 S COUNTY LINE RD; small business) : $82,405 in 6 contractsfrom 1999 to 2006
Contracts for Aircraft Landing Gear Components, Hand Tools, Nonedged, Nonpowered, Aircraft Wheel and Brake Systems, Hardware, Commercial by Defense Logistics Agency Signed by year:2000: $0; 2001: $0; 2002: $0; 2003: $0; 2004: $3,562; 2005: $25,760; 2006: $13,583.
Biggest contracts:
$39,500 with Defense Logistics Agency for Aircraft Landing Gear Components. Signed on 1999-10-20. Completion date: 2000-02-08.
$13,583, same as above.Signed on 2006-03-24. Completion date: 2006-06-20.
$10,620, same as above.Signed on 2005-01-26. Completion date: 2005-04-28.
$10,500 with Defense Logistics Agency for Hand Tools, Nonedged, Nonpowered. Signed on 2005-04-25. Completion date: 2005-05-25.
WASTE MANAGEMENT HOLDINGS INC (1021 E GREEN ST) : $45,574 in 3 contractsin 2004
$38,000 with Navy for Trash/Garbage Collection Services - Including Portable Sanitation Services. Signed on 2004-07-29. Completion date: 2004-09-30.
$5,322 with Forest Service for Trash/Garbage Collection Services - Including Portable Sanitation Services. Signed on 2004-03-08. Completion date: 2004-09-30.
$2,252, same as above.Signed on 2004-07-20. Completion date: 2004-09-30.
OMNI-PUMP REPAIRS, INC (9224 CHESTNUT AVENUE; small business) : $42,500 in 3 contractsfrom 2001 to 2003
$22,750 with Navy for Maintenance, Repair or Alteration of Real Property -- Other Non-Building Facilities. Signed on 2003-10-01. Completion date: 2001-10-25.
$22,750 with Navy for Maintenance, Repair or Alteration of Real Property -- Miscellaneous Buildings. Signed on 2001-09-24. Completion date: 2001-10-25.
-$3,000 with Navy for Maintenance, Repair or Alteration of Real Property -- Other Non-Building Facilities. Signed on 2003-10-01. Completion date: 2004-08-09.
Top industries in this zip code by the number of employees in 2005:
Administrative and Support and Waste Management and Remediation Services: Temporary Help Services (250-499 employees: 1 establishment, 100-249 employees: 4 establishments, 5-9 employees: 2 establishments, 1-4 employees: 3 establishments)
Wholesale Trade: Metal Service Centers and Other Metal Merchant Wholesalers (250-499: 1, 100-249: 1, 50-99: 5, 20-49: 2, 10-19: 1, 5-9: 1, 1-4: 3)
People in group quarters in 2010:
13 people in other noninstitutional facilities
4 people in group homes intended for adults
People in group quarters in 2000:
125 people in nursing homes
16 people in other noninstitutional group quarters
7 people in religious group quarters
Fatal accident statistics in 2012:
Fatal accident count: 1
Vehicles involved in fatal accidents: 1
Fatal accidents caused by drunken drivers: 1
Fatalities: 1
Persons involved in fatal accidents: 2
Pedestrians involved in fatal accidents: 1
Fatal accident statistics in 2010:
Fatal accident count: 2
Vehicles involved in fatal accidents: 3
Fatal accidents caused by drunken drivers: 0
Fatalities: 2
Persons involved in fatal accidents: 4
Pedestrians involved in fatal accidents: 0
Home Mortgage Disclosure Act Aggregated Statistics For Year 2009 (Based on 5 full and 6 partial tracts)
A) FHA, FSA/RHS & VA Home Purchase Loans
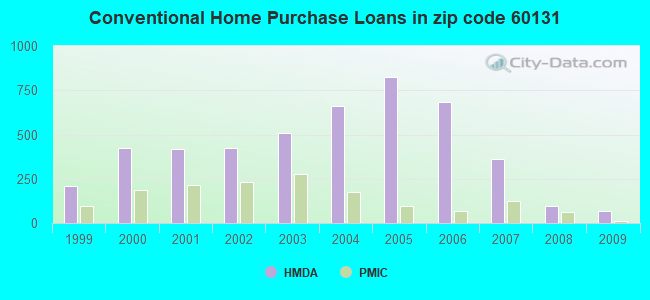
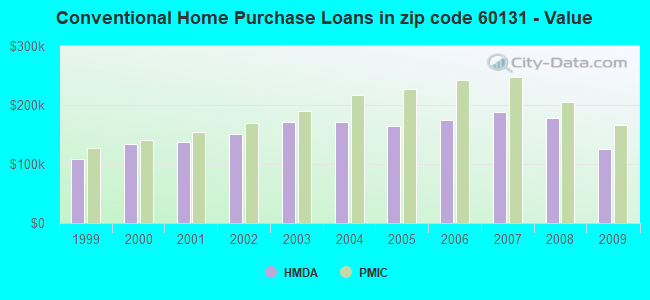
B) Conventional Home Purchase Loans
C) Refinancings
D) Home Improvement Loans
E) Loans on Dwellings For 5+ Families
F) Non-occupant Loans on < 5 Family Dwellings (A B C & D)
Number
Average Value
Number
Average Value
Number
Average Value
Number
Average Value
Number
Average Value
Number
Average Value
LOANS ORIGINATED
136
$170,274
66
$125,838
481
$169,462
24
$66,354
8
$483,579
19
$114,827
APPLICATIONS APPROVED, NOT ACCEPTED
9
$122,360
9
$132,129
67
$198,257
2
$178,980
0
$0
2
$123,840
APPLICATIONS DENIED
41
$147,151
26
$145,759
293
$196,326
22
$73,120
2
$302,515
12
$153,227
APPLICATIONS WITHDRAWN
17
$148,582
8
$80,535
132
$180,069
6
$141,413
0
$0
2
$173,435
FILES CLOSED FOR INCOMPLETENESS
6
$164,245
1
$68,800
31
$183,036
3
$56,257
0
$0
0
$0
Aggregated Statistics For Year 2008 (Based on 5 full and 6 partial tracts)
A) FHA, FSA/RHS & VA Home Purchase Loans
B) Conventional Home Purchase Loans
C) Refinancings
D) Home Improvement Loans
E) Loans on Dwellings For 5+ Families
F) Non-occupant Loans on < 5 Family Dwellings (A B C & D)
Number
Average Value
Number
Average Value
Number
Average Value
Number
Average Value
Number
Average Value
Number
Average Value
LOANS ORIGINATED
64
$195,285
95
$178,100
430
$192,839
43
$80,348
12
$951,670
14
$192,947
APPLICATIONS APPROVED, NOT ACCEPTED
4
$246,148
14
$212,369
76
$202,997
10
$89,234
0
$0
4
$231,970
APPLICATIONS DENIED
30
$204,295
44
$198,207
498
$214,439
76
$113,647
4
$418,442
21
$220,694
APPLICATIONS WITHDRAWN
16
$228,306
18
$196,253
137
$212,431
14
$184,776
0
$0
8
$181,061
FILES CLOSED FOR INCOMPLETENESS
3
$181,807
11
$164,859
49
$216,670
9
$158,669
0
$0
6
$192,052
Aggregated Statistics For Year 2007 (Based on 5 full and 6 partial tracts)
A) FHA, FSA/RHS & VA Home Purchase Loans
B) Conventional Home Purchase Loans
C) Refinancings
D) Home Improvement Loans
E) Loans on Dwellings For 5+ Families
F) Non-occupant Loans on < 5 Family Dwellings (A B C & D)
G) Loans On Manufactured Home Dwelling (A B C & D)
Number
Average Value
Number
Average Value
Number
Average Value
Number
Average Value
Number
Average Value
Number
Average Value
Number
Average Value
LOANS ORIGINATED
2
$344,735
360
$188,660
905
$193,372
138
$100,510
7
$383,550
40
$210,072
2
$14,130
APPLICATIONS APPROVED, NOT ACCEPTED
0
$0
51
$214,857
181
$189,308
26
$108,979
0
$0
7
$139,867
0
$0
APPLICATIONS DENIED
2
$251,500
136
$185,687
588
$209,305
110
$101,948
2
$459,360
26
$184,859
1
$69,020
APPLICATIONS WITHDRAWN
0
$0
49
$149,838
223
$209,726
25
$153,084
0
$0
12
$132,302
0
$0
FILES CLOSED FOR INCOMPLETENESS
0
$0
18
$221,408
84
$236,640
9
$34,497
0
$0
2
$264,565
0
$0
Aggregated Statistics For Year 2006 (Based on 5 full and 6 partial tracts)
A) FHA, FSA/RHS & VA Home Purchase Loans
B) Conventional Home Purchase Loans
C) Refinancings
D) Home Improvement Loans
E) Loans on Dwellings For 5+ Families
F) Non-occupant Loans on < 5 Family Dwellings (A B C & D)
G) Loans On Manufactured Home Dwelling (A B C & D)
Number
Average Value
Number
Average Value
Number
Average Value
Number
Average Value
Number
Average Value
Number
Average Value
Number
Average Value
LOANS ORIGINATED
5
$214,534
683
$174,427
1,063
$186,442
140
$94,662
19
$557,495
58
$262,683
0
$0
APPLICATIONS APPROVED, NOT ACCEPTED
0
$0
128
$177,320
207
$191,273
41
$83,309
2
$554,835
19
$148,343
0
$0
APPLICATIONS DENIED
0
$0
267
$168,608
537
$193,858
112
$81,682
4
$390,555
41
$167,270
2
$29,675
APPLICATIONS WITHDRAWN
3
$190,840
83
$168,691
261
$196,452
31
$142,041
0
$0
21
$146,270
0
$0
FILES CLOSED FOR INCOMPLETENESS
0
$0
20
$163,737
101
$211,916
3
$14,230
0
$0
3
$254,843
0
$0
Aggregated Statistics For Year 2005 (Based on 5 full and 6 partial tracts)
A) FHA, FSA/RHS & VA Home Purchase Loans
B) Conventional Home Purchase Loans
C) Refinancings
D) Home Improvement Loans
E) Loans on Dwellings For 5+ Families
F) Non-occupant Loans on < 5 Family Dwellings (A B C & D)
G) Loans On Manufactured Home Dwelling (A B C & D)
Number
Average Value
Number
Average Value
Number
Average Value
Number
Average Value
Number
Average Value
Number
Average Value
Number
Average Value
LOANS ORIGINATED
9
$249,157
825
$165,250
1,251
$178,123
142
$93,530
31
$693,353
94
$162,995
0
$0
APPLICATIONS APPROVED, NOT ACCEPTED
0
$0
136
$150,338
154
$194,273
32
$81,735
0
$0
15
$145,221
0
$0
APPLICATIONS DENIED
2
$181,670
197
$155,477
585
$182,622
81
$63,723
5
$1,042,796
17
$174,129
2
$40,695
APPLICATIONS WITHDRAWN
0
$0
109
$161,058
362
$175,269
57
$173,908
8
$463,265
19
$172,431
0
$0
FILES CLOSED FOR INCOMPLETENESS
2
$234,490
30
$156,864
86
$194,936
9
$70,501
0
$0
3
$156,700
0
$0
Aggregated Statistics For Year 2004 (Based on 5 full and 6 partial tracts)
A) FHA, FSA/RHS & VA Home Purchase Loans
B) Conventional Home Purchase Loans
C) Refinancings
D) Home Improvement Loans
E) Loans on Dwellings For 5+ Families
F) Non-occupant Loans on < 5 Family Dwellings (A B C & D)
G) Loans On Manufactured Home Dwelling (A B C & D)
Number
Average Value
Number
Average Value
Number
Average Value
Number
Average Value
Number
Average Value
Number
Average Value
Number
Average Value
LOANS ORIGINATED
36
$211,652
662
$170,636
1,269
$160,776
102
$89,690
26
$672,769
69
$146,704
0
$0
APPLICATIONS APPROVED, NOT ACCEPTED
2
$184,960
90
$156,928
223
$163,835
28
$102,807
2
$390,535
14
$172,420
0
$0
APPLICATIONS DENIED
7
$211,881
155
$172,373
575
$166,155
114
$84,254
5
$531,488
26
$192,521
1
$20,020
APPLICATIONS WITHDRAWN
7
$198,711
53
$153,335
326
$171,869
30
$97,462
0
$0
9
$158,871
0
$0
FILES CLOSED FOR INCOMPLETENESS
3
$195,770
18
$143,193
102
$185,152
5
$34,888
0
$0
0
$0
0
$0
Aggregated Statistics For Year 2003 (Based on 5 full and 6 partial tracts)
A) FHA, FSA/RHS & VA Home Purchase Loans
B) Conventional Home Purchase Loans
C) Refinancings
D) Home Improvement Loans
E) Loans on Dwellings For 5+ Families
F) Non-occupant Loans on < 5 Family Dwellings (A B C & D)
Number
Average Value
Number
Average Value
Number
Average Value
Number
Average Value
Number
Average Value
Number
Average Value
LOANS ORIGINATED
59
$202,310
507
$171,753
2,219
$132,548
83
$35,026
21
$380,986
64
$137,164
APPLICATIONS APPROVED, NOT ACCEPTED
0
$0
42
$163,192
304
$141,995
22
$33,195
2
$473,115
6
$132,523
APPLICATIONS DENIED
9
$187,499
63
$163,107
628
$135,528
80
$39,456
0
$0
13
$129,896
APPLICATIONS WITHDRAWN
5
$185,918
46
$185,673
465
$144,387
12
$73,886
0
$0
8
$161,739
FILES CLOSED FOR INCOMPLETENESS
8
$171,678
9
$169,394
75
$141,624
2
$19,800
0
$0
3
$82,537
Aggregated Statistics For Year 2002 (Based on 5 full and 6 partial tracts)
A) FHA, FSA/RHS & VA Home Purchase Loans
B) Conventional Home Purchase Loans
C) Refinancings
D) Home Improvement Loans
E) Loans on Dwellings For 5+ Families
F) Non-occupant Loans on < 5 Family Dwellings (A B C & D)
Number
Average Value
Number
Average Value
Number
Average Value
Number
Average Value
Number
Average Value
Number
Average Value
LOANS ORIGINATED
111
$182,353
425
$150,293
1,401
$125,786
77
$35,726
35
$505,346
37
$110,544
APPLICATIONS APPROVED, NOT ACCEPTED
7
$227,479
61
$149,396
230
$126,534
24
$20,690
7
$283,834
11
$136,088
APPLICATIONS DENIED
8
$198,872
57
$131,251
354
$141,061
58
$27,380
1
$224,000
10
$149,567
APPLICATIONS WITHDRAWN
12
$153,823
24
$133,464
308
$131,163
14
$24,607
2
$380,695
2
$61,625
FILES CLOSED FOR INCOMPLETENESS
2
$163,200
6
$125,598
113
$251,393
6
$44,105
2
$196,075
1
$193,690
Aggregated Statistics For Year 2001 (Based on 5 full and 6 partial tracts)
A) FHA, FSA/RHS & VA Home Purchase Loans
B) Conventional Home Purchase Loans
C) Refinancings
D) Home Improvement Loans
E) Loans on Dwellings For 5+ Families
F) Non-occupant Loans on < 5 Family Dwellings (A B C & D)
Number
Average Value
Number
Average Value
Number
Average Value
Number
Average Value
Number
Average Value
Number
Average Value
LOANS ORIGINATED
115
$166,039
420
$137,238
1,301
$119,909
78
$21,133
24
$239,343
30
$105,863
APPLICATIONS APPROVED, NOT ACCEPTED
3
$139,340
43
$137,547
148
$109,446
20
$30,030
2
$179,395
3
$88,140
APPLICATIONS DENIED
20
$150,317
32
$121,791
398
$111,402
79
$20,578
0
$0
2
$165,865
APPLICATIONS WITHDRAWN
7
$174,954
27
$140,566
232
$115,222
20
$18,440
2
$630,010
5
$103,112
FILES CLOSED FOR INCOMPLETENESS
2
$211,380
7
$117,651
69
$117,107
5
$23,002
0
$0
0
$0
Aggregated Statistics For Year 2000 (Based on 5 full and 6 partial tracts)
A) FHA, FSA/RHS & VA Home Purchase Loans
B) Conventional Home Purchase Loans
C) Refinancings
D) Home Improvement Loans
E) Loans on Dwellings For 5+ Families
F) Non-occupant Loans on < 5 Family Dwellings (A B C & D)
Number
Average Value
Number
Average Value
Number
Average Value
Number
Average Value
Number
Average Value
Number
Average Value
LOANS ORIGINATED
157
$145,171
423
$133,275
362
$94,373
89
$17,622
28
$213,908
18
$100,949
APPLICATIONS APPROVED, NOT ACCEPTED
4
$128,680
26
$110,988
93
$93,119
26
$22,573
0
$0
4
$107,248
APPLICATIONS DENIED
14
$150,229
33
$95,106
287
$96,591
84
$18,116
3
$265,040
6
$134,340
APPLICATIONS WITHDRAWN
13
$134,896
25
$122,832
133
$95,272
19
$15,700
0
$0
6
$128,935
FILES CLOSED FOR INCOMPLETENESS
2
$161,990
6
$124,997
76
$117,216
1
$17,270
0
$0
0
$0
Aggregated Statistics For Year 1999 (Based on 3 full and 3 partial tracts)
A) FHA, FSA/RHS & VA Home Purchase Loans
B) Conventional Home Purchase Loans
C) Refinancings
D) Home Improvement Loans
E) Loans on Dwellings For 5+ Families
F) Non-occupant Loans on < 5 Family Dwellings (A B C & D)
2002 - 2018 National Fire Incident Reporting System (NFIRS) incidents
According to the data from the years 2002 - 2018 the average number of fire incidents per year is 114. The highest number of reported fires - 150 took place in 2008, and the least - 60 in 2015. The data has a declining trend.
When looking into fire subcategories, the most reports belonged to: Structure Fires (56.1%), and Outside Fires (19.4%).
Fire incident types reported to NFIRS in Zip Code 60131

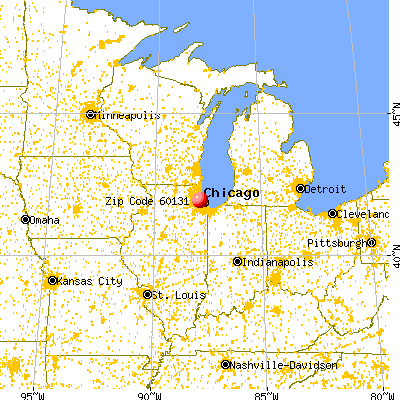


 Nearest zip codes: 60176, 60164, 60165, 60160, 60171, 60018.
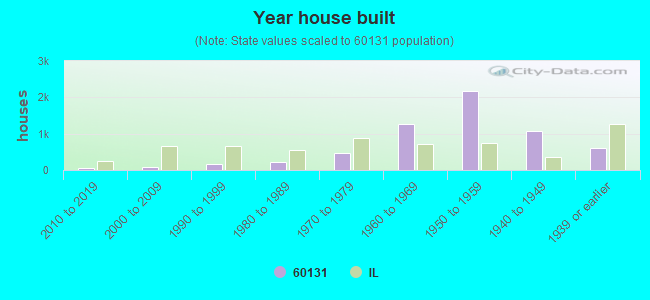


 According to the data from the years 2002 - 2018 the average number of fire incidents per year is 114. The highest number of reported fires - 150 took place in 2008, and the least - 60 in 2015. The data has a declining trend.
 When looking into fire subcategories, the most reports belonged to: Structure Fires (56.1%), and Outside Fires (19.4%).