Estimated zip code population in 2022: 9,070 Zip code population in 2010: 9,020 Zip code population in 2000: 8,891
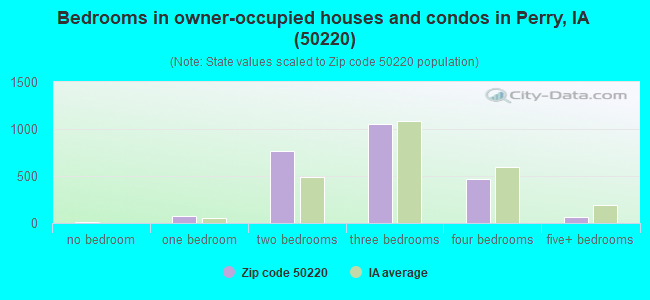
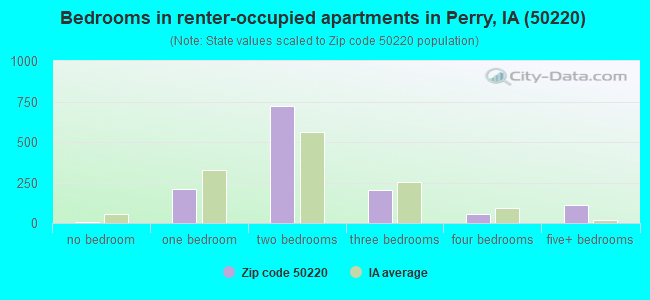
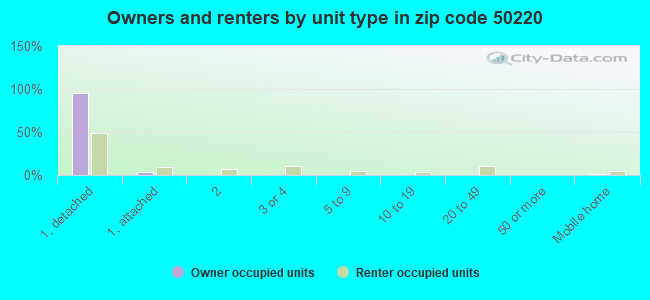
Houses and condos: 4,024 Renter-occupied apartments: 1,304
% of renters here:
35%
State:
28%
March 2022 cost of living index in zip code 50220: 88.4 (less than average, U.S. average is 100)
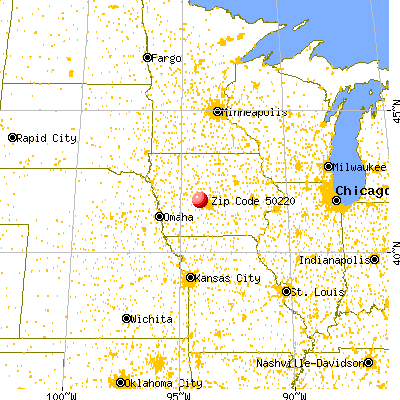
Land area: 103.0 sq. mi. Water area: 0.6 sq. mi.
Population density: 88 people per square mile
(very low).
OSM Map
General Map
Google Map
MSN Map
OSM Map
General Map
Google Map
MSN Map
OSM Map
General Map
Google Map
MSN Map
OSM Map
General Map
Google Map
MSN Map
Please wait while loading the map...
Real estate property taxes paid for housing units in 2022:
This zip code:
1.6% ($2,172)
Iowa:
1.4% ($2,724)
Median real estate property taxes paid for housing units with mortgages in 2022: $2,458 (1.6%) Median real estate property taxes paid for housing units with no mortgage in 2022: $1,661 (1.6%)
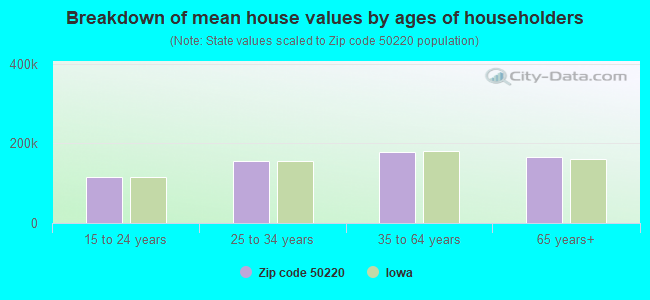
Estimated median house/condo value in 2022: $132,769
50220:
$132,769
Iowa:
$194,600
According to our research of Iowa and other state lists, there were 17 registered sex offenders living in 50220 zip code as of June 08, 2024. The ratio of all residents to sex offenders in zip code 50220 is 545 to 1. The ratio of registered sex offenders to all residents in this zip code is near the state average.
Median resident age:
This zip code:
40.9 years
Iowa median age:
38.9 years
Average household size:
This zip code:
2.4 people
Iowa:
2.3 people
Averages for the 2020 tax year for zip code 50220, filed in 2021:
Average Adjusted Gross Income (AGI) in 2020: $53,715 (Individual Income Tax Returns)
Here:
$53,715
State:
$71,087
Salary/wage: $46,319 (reported on 86.6% of returns)
Here:
$46,319
State:
$57,361
(% of AGI for various income ranges: 1208.1% for AGIs below $25k, 3864.2% for AGIs $25k-50k, 6844.3% for AGIs $50k-75k, 9747.0% for AGIs $75k-100k, 14953.3% for AGIs $100k-200k)
Taxable interest for individuals: $1,607 (reported on 22.5% of returns)
This zip code:
$1,607
Iowa:
$1,633
(% of AGI for various income ranges: 18.6% for AGIs below $25k, 20.9% for AGIs $25k-50k, 30.5% for AGIs $50k-75k, 33.0% for AGIs $75k-100k, 91.5% for AGIs $100k-200k)
Ordinary dividends: $3,651 (reported on 13.2% of returns)
Here:
$3,651
State:
$5,432
(% of AGI for various income ranges: 9.8% for AGIs below $25k, 17.4% for AGIs $25k-50k, 42.0% for AGIs $50k-75k, 85.0% for AGIs $75k-100k, 203.0% for AGIs $100k-200k)
Net capital gain/loss in AGI: +$12,857 (reported on 11.2% of returns)
Here:
+$12,857
State:
+$15,243
(% of AGI for various income ranges: 3.4% for AGIs below $25k, 20.7% for AGIs $25k-50k, 32.5% for AGIs $50k-75k, 158.3% for AGIs $75k-100k, 447.0% for AGIs $100k-200k)
Profit/loss from business: +$6,347 (reported on 11.2% of returns)
Here:
+$6,347
State:
+$11,763
(% of AGI for various income ranges: 85.7% for AGIs below $25k, 77.6% for AGIs $25k-50k, 90.7% for AGIs $50k-75k, 98.3% for AGIs $75k-100k, 222.6% for AGIs $100k-200k)
Taxable individual retirement arrangement distribution: $13,039 (reported on 7.9% of returns)
50220:
$13,039
Iowa:
$17,324
(% of AGI for various income ranges: 39.8% for AGIs below $25k, 73.2% for AGIs $25k-50k, 124.6% for AGIs $50k-75k, 267.7% for AGIs $75k-100k, 624.4% for AGIs $100k-200k)
Total itemized deductions: $29,594 (reported on 4.1% of returns)
Here:
$29,594
State:
$33,775
(% of AGI for various income ranges: 113.7% for AGIs $25k-50k, 159.3% for AGIs $50k-75k, 172.0% for AGIs $75k-100k, 567.4% for AGIs $100k-200k)
Charity contributions: $10,018 (reported on 2.6% of returns)
Here:
$10,018
State:
$13,075
(% of AGI for various income ranges: 13.9% for AGIs $25k-50k, 46.2% for AGIs $50k-75k, 259.3% for AGIs $100k-200k)
Taxes paid: $6,520 (reported on 3.6% of returns)
50220:
$6,520
State:
$7,704
(% of AGI for various income ranges: 9.6% for AGIs $25k-50k, 52.5% for AGIs $50k-75k, 139.6% for AGIs $100k-200k)
Earned income credit: $2,320 (reported on 16.5% of returns)
Here:
$2,320
State:
$2,195
(% of AGI for various income ranges: 101.5% for AGIs below $25k, 65.7% for AGIs $25k-50k)
Percentage of individuals using paid preparers for their 2020 taxes: 94.5%
Here:
94%
State:
95%
(% for various income ranges: 93.4% for AGIs below $25k, 93.7% for AGIs $25k-50k, 94.8% for AGIs $50k-75k, 95.3% for AGIs $75k-100k, 97.6% for AGIs $100k-200k, 100.0% for AGIs over 200k)
Averages for the 2012 tax year for zip code 50220, filed in 2013:
Average Adjusted Gross Income (AGI) in 2012: $50,797 (Individual Income Tax Returns)
Here:
$50,797
State:
$58,860
Salary/wage: $39,839 (reported on 87.7% of returns)
Here:
$39,839
State:
$46,659
(% of AGI for various income ranges: 79.0% for AGIs below $25k, 86.5% for AGIs $25k-50k, 79.4% for AGIs $50k-75k, 76.7% for AGIs $75k-100k, 69.6% for AGIs $100k-200k, 29.2% for AGIs over 200k)
Taxable interest for individuals: $1,446 (reported on 28.8% of returns)
This zip code:
$1,446
Iowa:
$1,537
(% of AGI for various income ranges: 1.3% for AGIs below $25k, 0.6% for AGIs $25k-50k, 0.9% for AGIs $50k-75k, 0.7% for AGIs $75k-100k, 0.7% for AGIs $100k-200k, 0.9% for AGIs over 200k)
Ordinary dividends: $2,971 (reported on 14.9% of returns)
Here:
$2,971
State:
$4,542
(% of AGI for various income ranges: 0.9% for AGIs below $25k, 0.4% for AGIs $25k-50k, 0.7% for AGIs $50k-75k, 0.8% for AGIs $75k-100k, 1.0% for AGIs $100k-200k, 1.5% for AGIs over 200k)
Net capital gain/loss in AGI: +$12,589 (reported on 11.3% of returns)
Here:
+$12,589
State:
+$11,802
(% of AGI for various income ranges: 0.6% for AGIs $50k-75k, 0.2% for AGIs $75k-100k, 2.1% for AGIs $100k-200k, 11.4% for AGIs over 200k)
Profit/loss from business: +$5,833 (reported on 12.3% of returns)
Here:
+$5,833
State:
+$10,509
(% of AGI for various income ranges: 5.2% for AGIs below $25k, 1.3% for AGIs $25k-50k, 1.5% for AGIs $50k-75k, 1.0% for AGIs $75k-100k, 1.4% for AGIs $100k-200k)
Taxable individual retirement arrangement distribution: $9,142 (reported on 8.5% of returns)
50220:
$9,142
Iowa:
$11,773
(% of AGI for various income ranges: 2.5% for AGIs below $25k, 1.3% for AGIs $25k-50k, 1.3% for AGIs $50k-75k, 1.8% for AGIs $75k-100k, 3.2% for AGIs $100k-200k)
Total itemized deductions: $19,837 (19% of AGI, reported on 24.4% of returns)
Here:
$19,837
State:
$21,278
Here:
18.7% of AGI
State:
18.9% of AGI
(% of AGI for various income ranges: 8.4% for AGIs below $25k, 7.3% for AGIs $25k-50k, 9.9% for AGIs $50k-75k, 12.1% for AGIs $75k-100k, 14.8% for AGIs $100k-200k, 6.4% for AGIs over 200k)
Charity contributions: $3,722 (reported on 19.5% of returns)
Here:
$3,722
State:
$4,044
(% of AGI for various income ranges: 0.8% for AGIs below $25k, 0.7% for AGIs $25k-50k, 1.1% for AGIs $50k-75k, 1.8% for AGIs $75k-100k, 2.7% for AGIs $100k-200k, 1.6% for AGIs over 200k)
Taxes paid: $7,162 (reported on 24.2% of returns)
50220:
$7,162
State:
$8,846
(% of AGI for various income ranges: 1.5% for AGIs below $25k, 1.9% for AGIs $25k-50k, 2.9% for AGIs $50k-75k, 4.0% for AGIs $75k-100k, 6.1% for AGIs $100k-200k, 3.9% for AGIs over 200k)
Earned income credit: $2,361 (reported on 21.3% of returns)
Here:
$2,361
State:
$2,098
(% of AGI for various income ranges: 6.5% for AGIs below $25k, 1.6% for AGIs $25k-50k)
Percentage of individuals using paid preparers for their 2012 taxes: 68.6%
Here:
69%
State:
65%
(% for various income ranges: 64.4% for AGIs below $25k, 67.2% for AGIs $25k-50k, 71.2% for AGIs $50k-75k, 76.7% for AGIs $75k-100k, 83.3% for AGIs $100k-200k, 80.0% for AGIs over 200k)
Averages for the 2004 tax year for zip code 50220, filed in 2005:
Average Adjusted Gross Income (AGI) in 2004: $38,785 (Individual Income Tax Returns)
Here:
$38,785
State:
$43,875
Salary/wage: $33,574 (reported on 86.4% of returns)
Here:
$33,574
State:
$38,265
(% of AGI for various income ranges: 95.4% for AGIs below $10k, 81.0% for AGIs $10k-25k, 84.1% for AGIs $25k-50k, 85.1% for AGIs $50k-75k, 77.3% for AGIs $75k-100k, 46.9% for AGIs over 100k)
Taxable interest for individuals: $2,130 (reported on 39.8% of returns)
This zip code:
$2,130
Iowa:
$1,768
(% of AGI for various income ranges: 6.6% for AGIs below $10k, 3.2% for AGIs $10k-25k, 1.8% for AGIs $25k-50k, 1.5% for AGIs $50k-75k, 2.3% for AGIs $75k-100k, 2.2% for AGIs over 100k)
Taxable dividends: $1,827 (reported on 19.6% of returns)
Here:
$1,827
State:
$2,510
(% of AGI for various income ranges: 1.7% for AGIs below $10k, 1.0% for AGIs $10k-25k, 0.5% for AGIs $25k-50k, 0.5% for AGIs $50k-75k, 0.9% for AGIs $75k-100k, 1.8% for AGIs over 100k)
Net capital gain/loss: +$9,455 (reported on 14.9% of returns)
Here:
+$9,455
State:
+$6,139
(% of AGI for various income ranges: -1.2% for AGIs below $10k, 0.6% for AGIs $10k-25k, 0.8% for AGIs $25k-50k, 0.7% for AGIs $50k-75k, 1.9% for AGIs $75k-100k, 13.1% for AGIs over 100k)
Profit/loss from business: +$4,504 (reported on 12.2% of returns)
Here:
+$4,504
State:
+$8,574
(% of AGI for various income ranges: 6.5% for AGIs below $10k, 1.3% for AGIs $10k-25k, 1.3% for AGIs $25k-50k, 1.2% for AGIs $50k-75k, 0.2% for AGIs $75k-100k, 2.0% for AGIs over 100k)
Profit/loss from farming: +$101 (reported on 3.0% of returns)
Here:
+$101
State:
-$74
(% of AGI for various income ranges: 0.2% for AGIs below $10k, 0.3% for AGIs $10k-25k, -0.2% for AGIs $25k-50k, -0.2% for AGIs $50k-75k, -0.1% for AGIs $75k-100k, 0.3% for AGIs over 100k)
IRA payment deduction: $2,822 (reported on 2.7% of returns)
50220:
$2,822
Iowa:
$2,970
(% of AGI for various income ranges: 0.3% for AGIs $10k-25k, 0.2% for AGIs $25k-50k, 0.3% for AGIs $50k-75k, 0.2% for AGIs over 100k)
Self-employed pension: $11,429 (reported on 0.4% of returns)
Here:
$11,429
Iowa:
$11,928
Total itemized deductions: $15,201 (21% of AGI, reported on 25.7% of returns)
Here:
$15,201
State:
$16,976
Here:
20.5% of AGI
State:
20.8% of AGI
(% of AGI for various income ranges: 7.1% for AGIs below $10k, 7.8% for AGIs $10k-25k, 8.9% for AGIs $25k-50k, 10.4% for AGIs $50k-75k, 14.4% for AGIs $75k-100k, 10.4% for AGIs over 100k)
Charity contributions deductions: $2,442 (3% of AGI, reported on 21.9% of returns)
Here:
$2,442
State:
$3,089
Here:
3.1% of AGI
State:
3.6% of AGI
(% of AGI for various income ranges: 0.6% for AGIs below $10k, 0.7% for AGIs $10k-25k, 0.9% for AGIs $25k-50k, 1.3% for AGIs $50k-75k, 1.9% for AGIs $75k-100k, 2.3% for AGIs over 100k)
Total tax: $5,217 (reported on 70.3% of returns)
50220:
$5,217
State:
$6,177
(% of AGI for various income ranges: 2.5% for AGIs below $10k, 3.2% for AGIs $10k-25k, 5.8% for AGIs $25k-50k, 7.4% for AGIs $50k-75k, 9.9% for AGIs $75k-100k, 19.9% for AGIs over 100k)
Earned income credit: $1,673 (reported on 19.0% of returns)
Here:
$1,673
State:
$1,540
Percentage of individuals using paid preparers for their 2004 taxes: 72.1%
Here:
72%
State:
70%
(% for various income ranges: 62.4% for AGIs below $10k, 75.4% for AGIs $10k-25k, 71.2% for AGIs $25k-50k, 74.9% for AGIs $50k-75k, 80.6% for AGIs $75k-100k, 77.1% for AGIs over 100k)
Likely homosexual households (counted as self-reported same-sex unmarried-partner households)
Lesbian couples: 0.2% of all households
Gay men: 0.0% of all households
Household received Food Stamps/SNAP in the past 12 months: 375 Household did not receive Food Stamps/SNAP in the past 12 months: 3,369
Women who had a birth in the past 12 months: 314 (238 now married, 77 unmarried) Women who did not have a birth in the past 12 months: 1,585 (528 now married, 1,058 unmarried)
Housing units in zip code 50220 with a mortgage: 1,301 (58 second mortgage, 27 both second mortgage and home equity loan) Houses without a mortgage: 13
Median monthly owner costs for units with a mortgage: $1,127 Median monthly owner costs for units without a mortgage: $499
Residents with income below the poverty level in 2022:
This zip code:
12.4%
Whole state:
11.0%
Residents with income below 50% of the poverty level in 2022:
This zip code:
9.6%
Whole state:
5.5%
Median number of rooms in houses and condos:
Here:
6.5
State:
6.8
Median number of rooms in apartments:
Here:
4.8
State:
4.2
Notable locations in this zip code not listed on our city pages
Notable locations in zip code 50220: Surry (A), Perry Wastewater Treatment Plant (B), Snyder Access (C), Perry Country Club (D), Spring Valley Public Access (E), Perry (F), Dallas County Emergency Medical Services (G), Forest Park Museum (H), Perry Police Department (I), Perry Volunteer Fire Department (J), Perry Public Library (K), McCreary Community Building (L). Display/hide their locations on the map
Churches in zip code 50220 include: First United Methodist Church (A), Assembly of God Church (B), Saint Patricks Catholic Church (C), First Presbyterian Church (D), Saint Martins Episcopal Church (E), Perry Bible Church (F), Mount Olivet Lutheran Church (G), First Christian Church (H), New Bethel Baptist Church (I). Display/hide their locations on the map
Cemeteries: Bower Cemetery (1), Fairview Cemetery (2), Saint Patrick's Cemetery (3), Highview Memorial Gardens (4), Moore Cemetery (5), Angus Cemetery (6), Violet Hill Cemetery (7). Display/hide their locations on the map
Streams, rivers, and creeks: Beaver Branch (A), Bucks Branch (B), Swan Lake Branch (C), Frog Creek (D), Jim Creek (E), Elm Branch (F). Display/hide their locations on the map
1,006 married couples with children.
703 single-parent households (257 men, 446 women).
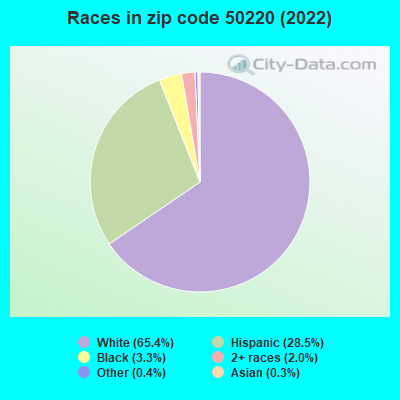
72.4% of residents of 50220 zip code speak English at home.
24.6% of residents speak Spanish at home (38% very well, 27% well, 29% not well, 6% not at all).
1.2% of residents speak other Indo-European language at home (100% very well).
0.3% of residents speak Asian or Pacific Island language at home (100% very well).
3.8% of residents speak other language at home (57% very well, 34% well, 9% not well).
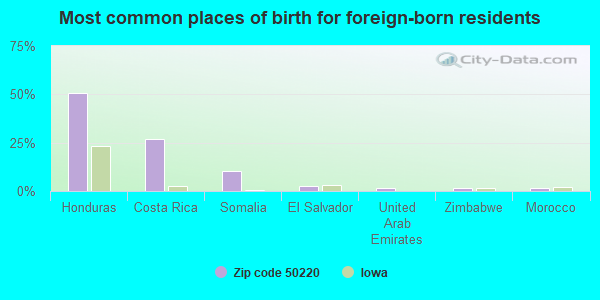
Foreign born population: 1,601 (17.7%) (45.7% of them are naturalized citizens)
This zip code:
17.7%
Whole state:
6.0%
51%Honduras
27%Costa Rica
11%Somalia
2%El Salvador
2%United Arab Emirates
2%Zimbabwe
2%Morocco
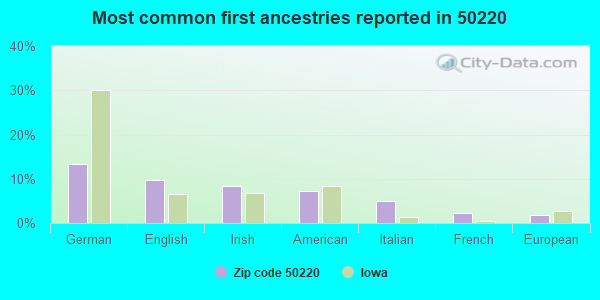
13%German
10%English
8%Irish
7%American
5%Italian
2%French
2%European
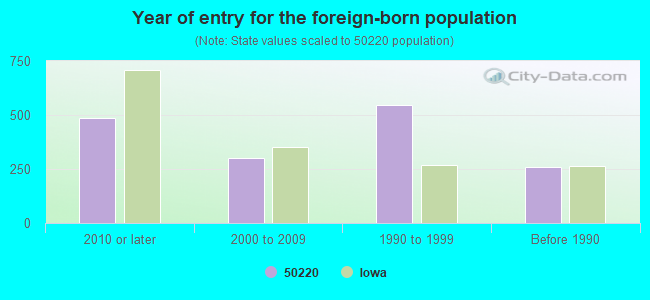
Year of entry for the foreign-born population
4862010 or later
3032000 to 2009
5461990 to 1999
261Before 1990
Major facilities with environmental interests located in this zip code:
TYSON FRESH MEATS INC PERRY PLANT (1350 I COURT in PERRY, IA)
AIR SYNTHETIC MINOR (AIRS/AFS) (Integrated Compliance Information System) - ICIS-07-2003-0326, FORMAL ENFORCEMENT ACTION, ICIS-07-2003-0076, STATE MASTER (Iowa emission factors information) STATE MASTER (Iowa emission factors information) - SDWIS-IA2561101, DRINKING WATER SYSTEM CRITERIA AND HAZARDOUS AIR POLLUTANT INVENTORY (Inventory of air pollution sources) National Pollutant Discharge Elimination System MAJOR (Tracking pollutant discharge elimination systems) - permit Small Quantity Generators, between 100 kg and 1000 kg of hazardous waste/month (Resource Conservation and Recovery Act (tracking hazardous waste)) - notification (Resource Conservation and Recovery Act (tracking hazardous waste)) TRI REPORTER (Tracking of toxic chemicals releasing facilities) Business SIC classification: MEAT PACKING PLANTS; ANIMAL AND MARINE FATS AND OILS Business NAICS classification: ANIMAL (EXCEPT POULTRY) SLAUGHTERING.; ANIMAL (EXCEPT POULTRY) SLAUGHTERING.; ANIMAL (EXCEPT POULTRY) SLAUGHTERING. Organizations: TYSON FRESH MEATS INC - PERRY (CONTACT/OPERATOR)
, TYSON FRESH MEATS, INC (CONTACT/OPERATOR)
, TYSON FOODS INC (CONTACT/OWNER)
, TYSON FOODS, INC. (CONTACT/OWNER)
, TYSON FOODS (LEGALLY RESPONSIBLE ENTITY)
Alternative names: I B P INC - DUPLICATE ID#, IBP INC, IBP, INC. - PERRY, OSCAR MEYER & CO. INC.
PROGRESSIVE FOUNDRY INCORPORATED (1518 1ST AVENUE in PERRY, IA)
AIR SYNTHETIC MINOR (AIRS/AFS) COMPLIANCE ACTIVITY (Tracking inspections of insecticide, fungicide, and rodenticide, and toxic substances) Conditionally Exempt Small Quantity Generators, less than 100 kg/month of hazardous waste (Resource Conservation and Recovery Act (tracking hazardous waste)) - ICIS-, ENFORCEMENT/COMPLIANCE ACTIVITY TSD (Resource Conservation and Recovery Act (tracking hazardous waste)) - ICIS-, ENFORCEMENT/COMPLIANCE ACTIVITY Business SIC classification: GRAY AND DUCTILE IRON FOUNDRIES Business NAICS classification: GLASS CONTAINER MANUFACTURING.
DALLAS COUNTY HOSPITAL (610 10TH STREET in PERRY, IA)
AIR SYNTHETIC MINOR (AIRS/AFS) - ICIS-, ENFORCEMENT/COMPLIANCE ACTIVITY COMPLIANCE ACTIVITY (Tracking inspections of insecticide, fungicide, and rodenticide, and toxic substances) (Resource Conservation and Recovery Act (tracking hazardous waste)) Business SIC classification: COMBINATION UTILITIES; GENERAL MEDICAL AND SURGICAL HOSPITALS
PERRY COMMUNITY SCHOOL (2700 WARFORD ST in PERRY, IA)
(Integrated Compliance Information System) - ICIS-07-1992-0155, FORMAL ENFORCEMENT ACTION Conditionally Exempt Small Quantity Generators, less than 100 kg/month of hazardous waste (Resource Conservation and Recovery Act (tracking hazardous waste)) Business SIC classification: ELEMENTARY AND SECONDARY SCHOOLS Organizations: PERRY COMMUNITY SCHOOL DISTRICT (CONTACT/OPERATOR)
PERRY MIDDLE SCHOOL (1200 18TH STREET in PERRY, IA)
(Geographic Names Information System) (National Center for Education Statistics) - STATE ID-255184 209 Organizations: PERRY COMM SCHOOL DISTRICT (SCHOOL DISTRICT)
PERRY HIGH SCHOOL (1200 18TH STREET in PERRY, IA)
(Geographic Names Information System) (National Center for Education Statistics) - STATE ID-255184 109 Organizations: PERRY COMM SCHOOL DISTRICT (SCHOOL DISTRICT)
PERRY ELEMENTARY (1600 8TH in PERRY, IA)
(National Center for Education Statistics) - STATE ID-255184 412 Organizations: PERRY COMM SCHOOL DISTRICT (SCHOOL DISTRICT)
AMERICAN CONCRETE PRODUCTS INCORPORATED (915 RAILROAD STREET in PERRY, IA)
AIR MINOR (AIRS/AFS) (Resource Conservation and Recovery Act (tracking hazardous waste)) Business SIC classification: READY-MIXED CONCRETE Organizations: BOONE CONTRUCTION (CONTACT/OWNER)
Alternative names: NUCKOLLS CONCRETE SERVICES
DEBS CONSTRUCTION (1907 S GATE DR in PERRY, IA)
(Integrated Compliance Information System) - ICIS-07-1986-0099, FORMAL ENFORCEMENT ACTION Business SIC classification: GENERAL CONTRACTORS-SINGLE-FAMILY HOUSES
SMITH TIRE II (124 W WILLIS AVE in PERRY, IA)
Conditionally Exempt Small Quantity Generators, less than 100 kg/month of hazardous waste (Resource Conservation and Recovery Act (tracking hazardous waste)) - ICIS-, ENFORCEMENT/COMPLIANCE ACTIVITY Business NAICS classification: ALL OTHER MOTOR VEHICLE DEALERS. Alternative names: K & K EXPRESS, MCKEE MOTORS
PERRY COMMUNITY SCHOOLS (1219 WARFORD STREET in PERRY, IA)
COMPLIANCE ACTIVITY (Tracking inspections of insecticide, fungicide, and rodenticide, and toxic substances) Alternative names: PERRY C S D, PERRY COMM SCHOOL DIST, PERRY CSD
R & R 66 AUTO SERVICE-FORMER SITE OF (2810 WILLIS AVE in PERRY, IA)
(Resource Conservation and Recovery Act (tracking hazardous waste)) Organizations: BILL SCHAAL (CONTACT/OWNER)
, MIKE BALZER (CONTACT/OWNER)
PERRY PIT (1235 FILMORE COURT in PERRY, IA)
National Pollutant Discharge Elimination System NON-MAJOR (Tracking pollutant discharge elimination systems) - permit Business SIC classification: CRUSHED AND BROKEN LIMESTONE Organizations: HALLETT MATERIALS (CONTACT/OWNER)
Alternative names: HALLETT MATERIALS
Housing units lacking complete plumbing facilities: 0.9% Housing units lacking complete kitchen facilities: 1.3%
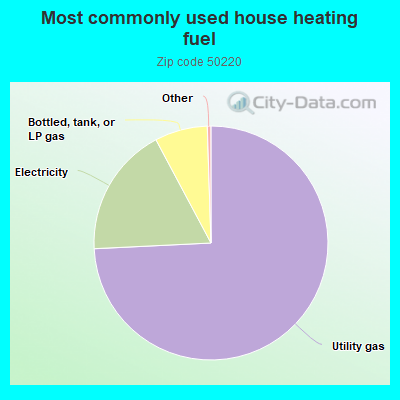
74.3%Utility gas
18.0%Electricity
7.3%Bottled, tank, or LP gas
Population in 1990: 7,918. Population change in the 1990s: +973 (+12.3%).
Place of birth for U.S.-born residents:
This state: 5,777
Northeast: 169
Midwest: 597
South: 415
West: 525
53% of the 50220 zip code residents lived in the same house 5 years ago. Out of people who lived in different houses, 48% lived in this county. Out of people who lived in different counties, 50% lived in Iowa.
90% of the 50220 zip code residents lived in the same house 1 year ago. Out of people who lived in different houses, 35% moved from this county. Out of people who lived in different houses, 63% moved from different county within same state. Out of people who lived in different houses, 5% moved from different state.
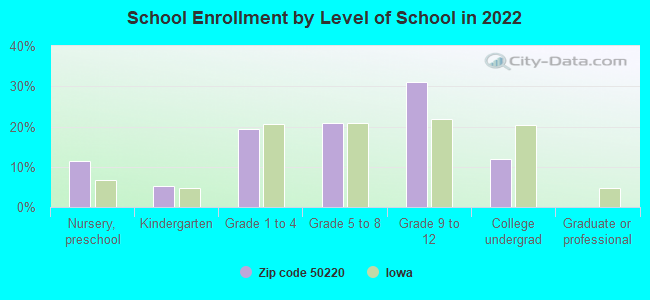
Private vs. public school enrollment:
Students in private schools in grades 1 to 8 (elementary and middle school): 52
Here:
6.8%
Iowa:
10.6%
Students in private schools in grades 9 to 12 (high school): 37
Here:
6.3%
Iowa:
7.9%
Students in private undergraduate colleges: 17
Here:
7.5%
Iowa:
23.9%
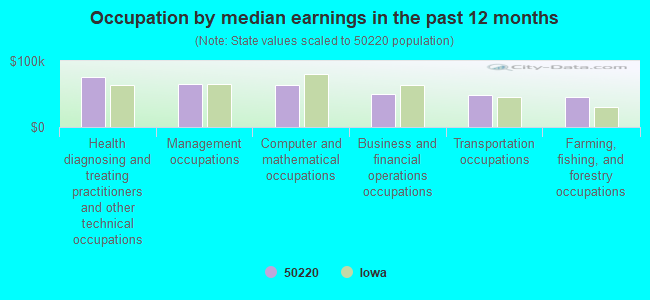
Occupation by median earnings in the past 12 months ($)
75,527Health diagnosing and treating practitioners and other technical occupations
64,633Management occupations
64,253Computer and mathematical occupations
50,680Business and financial operations occupations
48,572Transportation occupations
45,954Farming, fishing, and forestry occupations
Top industries in this zip code by the number of employees in 2005:
Health Care and Social Assistance: Nursing Care Facilities (100-249 employees: 1 establishment, 50-99 employees: 1 establishment, 20-49 employees: 1 establishment)
Accommodation and Food Services: Hotels (except Casino Hotels) and Motels (100-249: 1, 1-4: 1)
Health Care and Social Assistance: General Medical and Surgical Hospitals (100-249: 1)
Health Care and Social Assistance: Offices of Mental Health Practitioners (except Physicians) (100-249: 1)
Accommodation and Food Services: Limited-Service Restaurants (20-49: 3, 10-19: 2)
Finance and Insurance: Commercial Banking (50-99: 1, 10-19: 1)
People in group quarters in 2010:
121 people in nursing facilities/skilled-nursing facilities
16 people in emergency and transitional shelters (with sleeping facilities) for people experiencing homelessness
8 people in group homes intended for adults
People in group quarters in 2000:
155 people in nursing homes
4 people in homes for the mentally retarded
2 people in homes for the mentally ill
Fatal accident statistics in 2013:
Fatal accident count: 1
Vehicles involved in fatal accidents: 2
Fatal accidents caused by drunken drivers: 0
Fatalities: 1
Persons involved in fatal accidents: 2
Pedestrians involved in fatal accidents: 0
Fatal accident statistics in 2012:
Fatal accident count: 1
Vehicles involved in fatal accidents: 1
Fatal accidents caused by drunken drivers: 0
Fatalities: 1
Persons involved in fatal accidents: 1
Pedestrians involved in fatal accidents: 1
Home Mortgage Disclosure Act Aggregated Statistics For Year 2009 (Based on 1 full and 4 partial tracts)
A) FHA, FSA/RHS & VA Home Purchase Loans
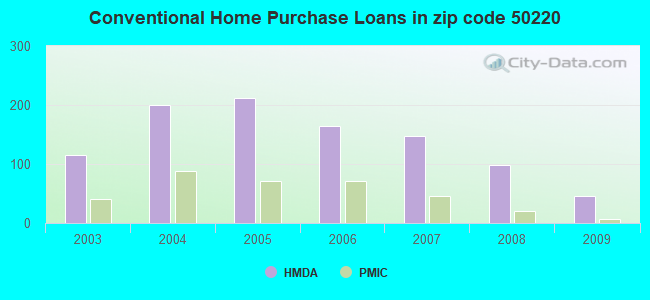
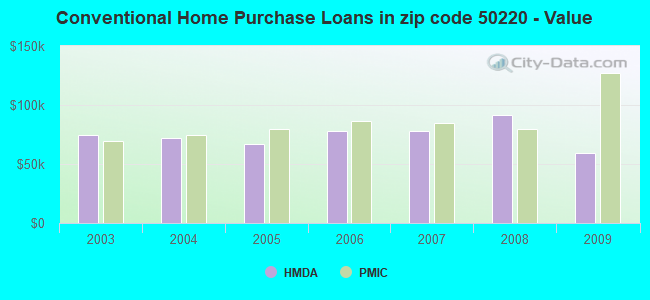
B) Conventional Home Purchase Loans
C) Refinancings
D) Home Improvement Loans
E) Loans on Dwellings For 5+ Families
F) Non-occupant Loans on < 5 Family Dwellings (A B C & D)
G) Loans On Manufactured Home Dwelling (A B C & D)
Number
Average Value
Number
Average Value
Number
Average Value
Number
Average Value
Number
Average Value
Number
Average Value
Number
Average Value
LOANS ORIGINATED
36
$86,513
46
$59,039
163
$101,381
33
$49,494
1
$95,000
41
$52,714
7
$41,180
APPLICATIONS APPROVED, NOT ACCEPTED
8
$56,574
4
$133,618
24
$89,508
6
$11,112
0
$0
4
$13,918
0
$0
APPLICATIONS DENIED
10
$55,651
4
$67,475
101
$97,909
10
$27,345
3
$164,233
9
$95,742
3
$83,817
APPLICATIONS WITHDRAWN
0
$0
4
$113,678
41
$74,121
5
$37,154
0
$0
8
$59,016
0
$0
FILES CLOSED FOR INCOMPLETENESS
1
$102,900
0
$0
5
$96,112
1
$10,000
0
$0
0
$0
0
$0
Aggregated Statistics For Year 2008 (Based on 1 full and 4 partial tracts)
A) FHA, FSA/RHS & VA Home Purchase Loans
B) Conventional Home Purchase Loans
C) Refinancings
D) Home Improvement Loans
E) Loans on Dwellings For 5+ Families
F) Non-occupant Loans on < 5 Family Dwellings (A B C & D)
G) Loans On Manufactured Home Dwelling (A B C & D)
Number
Average Value
Number
Average Value
Number
Average Value
Number
Average Value
Number
Average Value
Number
Average Value
Number
Average Value
LOANS ORIGINATED
20
$91,594
99
$91,862
131
$91,085
46
$30,404
4
$110,885
62
$78,267
10
$53,683
APPLICATIONS APPROVED, NOT ACCEPTED
5
$89,078
4
$71,400
30
$109,244
3
$23,193
0
$0
1
$63,270
3
$132,417
APPLICATIONS DENIED
9
$86,763
19
$74,538
122
$102,211
31
$59,947
0
$0
11
$38,285
7
$94,200
APPLICATIONS WITHDRAWN
0
$0
9
$72,778
52
$98,847
8
$68,529
0
$0
6
$39,080
4
$83,048
FILES CLOSED FOR INCOMPLETENESS
0
$0
3
$84,847
10
$95,177
3
$44,360
0
$0
0
$0
1
$100,000
Aggregated Statistics For Year 2007 (Based on 1 full and 4 partial tracts)
A) FHA, FSA/RHS & VA Home Purchase Loans
B) Conventional Home Purchase Loans
C) Refinancings
D) Home Improvement Loans
E) Loans on Dwellings For 5+ Families
F) Non-occupant Loans on < 5 Family Dwellings (A B C & D)
G) Loans On Manufactured Home Dwelling (A B C & D)
Number
Average Value
Number
Average Value
Number
Average Value
Number
Average Value
Number
Average Value
Number
Average Value
Number
Average Value
LOANS ORIGINATED
5
$79,000
147
$77,582
197
$74,697
31
$33,235
4
$139,185
68
$41,775
8
$72,266
APPLICATIONS APPROVED, NOT ACCEPTED
0
$0
22
$86,893
53
$79,230
8
$21,820
0
$0
3
$37,930
2
$106,170
APPLICATIONS DENIED
1
$72,580
41
$83,482
127
$76,102
37
$34,390
0
$0
6
$40,998
2
$4,915
APPLICATIONS WITHDRAWN
1
$72,000
12
$90,691
52
$80,638
16
$27,404
0
$0
2
$111,000
1
$64,000
FILES CLOSED FOR INCOMPLETENESS
0
$0
10
$84,553
9
$97,872
0
$0
0
$0
0
$0
0
$0
Aggregated Statistics For Year 2006 (Based on 1 full and 4 partial tracts)
A) FHA, FSA/RHS & VA Home Purchase Loans
B) Conventional Home Purchase Loans
C) Refinancings
D) Home Improvement Loans
E) Loans on Dwellings For 5+ Families
F) Non-occupant Loans on < 5 Family Dwellings (A B C & D)
G) Loans On Manufactured Home Dwelling (A B C & D)
Number
Average Value
Number
Average Value
Number
Average Value
Number
Average Value
Number
Average Value
Number
Average Value
Number
Average Value
LOANS ORIGINATED
11
$88,127
164
$78,262
199
$78,529
58
$23,149
1
$2,311,000
60
$55,928
5
$78,748
APPLICATIONS APPROVED, NOT ACCEPTED
0
$0
21
$73,095
48
$83,053
16
$29,177
0
$0
5
$54,692
2
$49,305
APPLICATIONS DENIED
4
$63,622
24
$69,998
119
$80,593
45
$29,164
0
$0
11
$63,419
5
$25,654
APPLICATIONS WITHDRAWN
5
$79,790
21
$70,978
60
$82,227
13
$61,183
0
$0
8
$63,320
0
$0
FILES CLOSED FOR INCOMPLETENESS
0
$0
7
$71,001
38
$86,102
1
$35,000
0
$0
2
$80,880
0
$0
Aggregated Statistics For Year 2005 (Based on 1 full and 4 partial tracts)
A) FHA, FSA/RHS & VA Home Purchase Loans
B) Conventional Home Purchase Loans
C) Refinancings
D) Home Improvement Loans
E) Loans on Dwellings For 5+ Families
F) Non-occupant Loans on < 5 Family Dwellings (A B C & D)
G) Loans On Manufactured Home Dwelling (A B C & D)
Number
Average Value
Number
Average Value
Number
Average Value
Number
Average Value
Number
Average Value
Number
Average Value
Number
Average Value
LOANS ORIGINATED
7
$84,270
212
$66,883
197
$67,427
54
$22,809
5
$187,164
42
$51,259
3
$61,600
APPLICATIONS APPROVED, NOT ACCEPTED
0
$0
38
$66,011
40
$60,792
7
$36,251
0
$0
1
$42,000
1
$41,000
APPLICATIONS DENIED
0
$0
42
$56,198
124
$78,379
37
$32,946
0
$0
10
$30,696
3
$90,373
APPLICATIONS WITHDRAWN
0
$0
42
$68,915
74
$81,687
12
$43,644
0
$0
2
$43,610
0
$0
FILES CLOSED FOR INCOMPLETENESS
2
$66,810
5
$88,498
29
$89,254
0
$0
0
$0
1
$84,000
0
$0
Aggregated Statistics For Year 2004 (Based on 1 full and 4 partial tracts)
A) FHA, FSA/RHS & VA Home Purchase Loans
B) Conventional Home Purchase Loans
C) Refinancings
D) Home Improvement Loans
E) Loans on Dwellings For 5+ Families
F) Non-occupant Loans on < 5 Family Dwellings (A B C & D)
G) Loans On Manufactured Home Dwelling (A B C & D)
Number
Average Value
Number
Average Value
Number
Average Value
Number
Average Value
Number
Average Value
Number
Average Value
Number
Average Value
LOANS ORIGINATED
26
$83,834
200
$71,982
248
$70,895
78
$20,123
10
$109,843
52
$53,858
6
$65,365
APPLICATIONS APPROVED, NOT ACCEPTED
3
$81,483
17
$67,531
40
$74,456
9
$24,656
0
$0
2
$60,315
0
$0
APPLICATIONS DENIED
5
$76,800
64
$67,482
154
$68,162
40
$17,309
0
$0
20
$59,938
6
$17,608
APPLICATIONS WITHDRAWN
2
$68,665
25
$70,354
73
$72,903
2
$47,295
0
$0
6
$33,713
4
$70,058
FILES CLOSED FOR INCOMPLETENESS
0
$0
5
$72,118
35
$88,001
2
$13,920
0
$0
3
$62,447
0
$0
Aggregated Statistics For Year 2003 (Based on 1 full and 4 partial tracts)
A) FHA, FSA/RHS & VA Home Purchase Loans
B) Conventional Home Purchase Loans
C) Refinancings
D) Home Improvement Loans
E) Loans on Dwellings For 5+ Families
F) Non-occupant Loans on < 5 Family Dwellings (A B C & D)
2002 - 2018 National Fire Incident Reporting System (NFIRS) incidents
According to the data from the years 2002 - 2018 the average number of fires per year is 8. The highest number of fire incidents - 44 took place in 2012, and the least - 0 in 2008. The data has a dropping trend.
When looking into fire subcategories, the most reports belonged to: Structure Fires (53.1%), and Outside Fires (23.8%).
Fire incident types reported to NFIRS in Zip Code 50220


+$101
-$74
(% of AGI for various income ranges: 0.2% for AGIs below $10k, 0.3% for AGIs $10k-25k, -0.2% for AGIs $25k-50k, -0.2% for AGIs $50k-75k, -0.1% for AGIs $75k-100k, 0.3% for AGIs over 100k)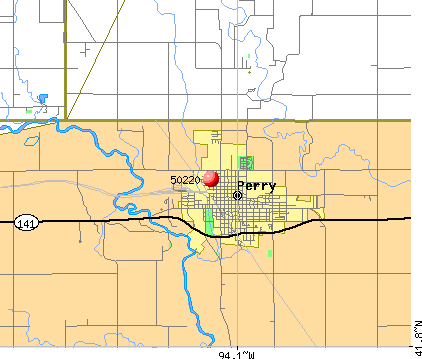 Nearest zip codes: 50066, 50167, 50039, 50235, 50128, 50146.


 According to the data from the years 2002 - 2018 the average number of fires per year is 8. The highest number of fire incidents - 44 took place in 2012, and the least - 0 in 2008. The data has a dropping trend.
 When looking into fire subcategories, the most reports belonged to: Structure Fires (53.1%), and Outside Fires (23.8%).