Estimated zip code population in 2022: 9,541 Zip code population in 2010: 5,387 Zip code population in 2000: 2,964
Houses and condos: 3,261 Renter-occupied apartments: 260
% of renters here:
8%
State:
28%
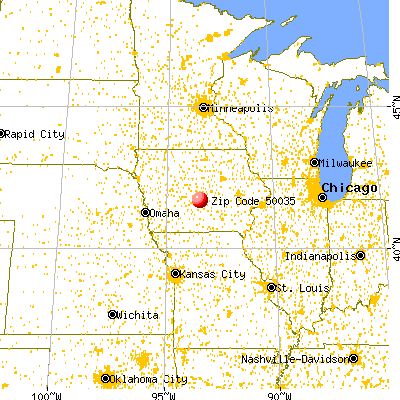
March 2022 cost of living index in zip code 50035: 89.3 (less than average, U.S. average is 100)
Land area: 45.1 sq. mi. Water area: 0.0 sq. mi.
Population density: 212 people per square mile
(very low).
OSM Map
General Map
Google Map
MSN Map
OSM Map
General Map
Google Map
MSN Map
OSM Map
General Map
Google Map
MSN Map
OSM Map
General Map
Google Map
MSN Map
Please wait while loading the map...
Real estate property taxes paid for housing units in 2022:
This zip code:
1.7% ($5,114)
Iowa:
1.4% ($2,724)
Median real estate property taxes paid for housing units with mortgages in 2022: $5,283 (1.7%) Median real estate property taxes paid for housing units with no mortgage in 2022: $3,820 (1.4%)
Estimated median house/condo value in 2022: $308,295
50035:
$308,295
Iowa:
$194,600
According to our research of Iowa and other state lists, there were 13 registered sex offenders living in 50035 zip code as of June 08, 2024. The ratio of all residents to sex offenders in zip code 50035 is 512 to 1. The ratio of registered sex offenders to all residents in this zip code is near the state average.
Median resident age:
This zip code:
33.7 years
Iowa median age:
38.9 years
Average household size:
This zip code:
3.0 people
Iowa:
2.3 people
Averages for the 2020 tax year for zip code 50035, filed in 2021:
Average Adjusted Gross Income (AGI) in 2020: $90,888 (Individual Income Tax Returns)
Here:
$90,888
State:
$71,087
Salary/wage: $79,270 (reported on 92.1% of returns)
Here:
$79,270
State:
$57,361
(% of AGI for various income ranges: 1213.5% for AGIs below $25k, 3679.2% for AGIs $25k-50k, 6606.5% for AGIs $50k-75k, 9675.2% for AGIs $75k-100k, 18673.0% for AGIs $100k-200k, 82993.3% for AGIs over 200k)
Taxable interest for individuals: $958 (reported on 31.4% of returns)
This zip code:
$958
Iowa:
$1,633
(% of AGI for various income ranges: 14.4% for AGIs below $25k, 10.9% for AGIs $25k-50k, 34.4% for AGIs $50k-75k, 35.2% for AGIs $75k-100k, 53.0% for AGIs $100k-200k, 570.0% for AGIs over 200k)
Ordinary dividends: $2,865 (reported on 17.6% of returns)
Here:
$2,865
State:
$5,432
(% of AGI for various income ranges: 10.8% for AGIs below $25k, 13.4% for AGIs $25k-50k, 28.5% for AGIs $50k-75k, 46.1% for AGIs $75k-100k, 71.8% for AGIs $100k-200k, 1671.7% for AGIs over 200k)
Net capital gain/loss in AGI: +$14,089 (reported on 16.3% of returns)
Here:
+$14,089
State:
+$15,243
(% of AGI for various income ranges: 12.1% for AGIs below $25k, 35.5% for AGIs $25k-50k, 36.7% for AGIs $50k-75k, 45.0% for AGIs $75k-100k, 178.4% for AGIs $100k-200k, 12146.7% for AGIs over 200k)
Profit/loss from business: +$9,831 (reported on 15.3% of returns)
Here:
+$9,831
State:
+$11,763
(% of AGI for various income ranges: 52.7% for AGIs below $25k, 103.2% for AGIs $25k-50k, 152.9% for AGIs $50k-75k, 278.4% for AGIs $75k-100k, 366.8% for AGIs $100k-200k, 730.0% for AGIs over 200k)
Taxable individual retirement arrangement distribution: $15,286 (reported on 6.9% of returns)
50035:
$15,286
Iowa:
$17,324
(% of AGI for various income ranges: 65.0% for AGIs below $25k, 76.4% for AGIs $25k-50k, 121.9% for AGIs $50k-75k, 197.5% for AGIs $75k-100k, 262.1% for AGIs $100k-200k)
Total itemized deductions: $29,715 (reported on 8.4% of returns)
Here:
$29,715
State:
$33,775
(% of AGI for various income ranges: 219.4% for AGIs $25k-50k, 260.2% for AGIs $50k-75k, 284.5% for AGIs $75k-100k, 416.1% for AGIs $100k-200k, 5391.7% for AGIs over 200k)
Charity contributions: $9,904 (reported on 5.7% of returns)
Here:
$9,904
State:
$13,075
(% of AGI for various income ranges: 20.9% for AGIs $25k-50k, 33.1% for AGIs $50k-75k, 32.7% for AGIs $75k-100k, 96.6% for AGIs $100k-200k, 1866.7% for AGIs over 200k)
Taxes paid: $8,162 (reported on 8.4% of returns)
50035:
$8,162
State:
$7,704
(% of AGI for various income ranges: 44.3% for AGIs $25k-50k, 88.8% for AGIs $50k-75k, 110.7% for AGIs $75k-100k, 134.2% for AGIs $100k-200k, 990.0% for AGIs over 200k)
Earned income credit: $2,282 (reported on 6.9% of returns)
Here:
$2,282
State:
$2,195
(% of AGI for various income ranges: 55.8% for AGIs below $25k, 55.3% for AGIs $25k-50k)
Percentage of individuals using paid preparers for their 2020 taxes: 95.3%
Here:
95%
State:
95%
(% for various income ranges: 92.8% for AGIs below $25k, 95.2% for AGIs $25k-50k, 95.1% for AGIs $50k-75k, 96.6% for AGIs $75k-100k, 95.8% for AGIs $100k-200k, 100.0% for AGIs over 200k)
Averages for the 2012 tax year for zip code 50035, filed in 2013:
Average Adjusted Gross Income (AGI) in 2012: $66,021 (Individual Income Tax Returns)
Here:
$66,021
State:
$58,860
Salary/wage: $59,930 (reported on 91.8% of returns)
Here:
$59,930
State:
$46,659
(% of AGI for various income ranges: 79.0% for AGIs below $25k, 86.5% for AGIs $25k-50k, 85.6% for AGIs $50k-75k, 87.8% for AGIs $75k-100k, 85.6% for AGIs $100k-200k, 62.9% for AGIs over 200k)
Taxable interest for individuals: $910 (reported on 36.7% of returns)
This zip code:
$910
Iowa:
$1,537
(% of AGI for various income ranges: 1.0% for AGIs below $25k, 0.6% for AGIs $25k-50k, 0.4% for AGIs $50k-75k, 0.2% for AGIs $75k-100k, 0.6% for AGIs $100k-200k, 0.6% for AGIs over 200k)
Ordinary dividends: $1,800 (reported on 19.1% of returns)
Here:
$1,800
State:
$4,542
(% of AGI for various income ranges: 0.5% for AGIs below $25k, 0.2% for AGIs $25k-50k, 0.4% for AGIs $50k-75k, 0.3% for AGIs $75k-100k, 0.6% for AGIs $100k-200k, 1.2% for AGIs over 200k)
Net capital gain/loss in AGI: +$6,159 (reported on 12.7% of returns)
Here:
+$6,159
State:
+$11,802
(% of AGI for various income ranges: 0.6% for AGIs $50k-75k, 0.8% for AGIs $100k-200k, 7.0% for AGIs over 200k)
Profit/loss from business: +$9,714 (reported on 16.5% of returns)
Here:
+$9,714
State:
+$10,509
(% of AGI for various income ranges: 7.7% for AGIs below $25k, 2.3% for AGIs $25k-50k, 2.5% for AGIs $50k-75k, 2.4% for AGIs $75k-100k, 2.5% for AGIs $100k-200k)
Taxable individual retirement arrangement distribution: $11,120 (reported on 7.5% of returns)
50035:
$11,120
Iowa:
$11,773
(% of AGI for various income ranges: 3.4% for AGIs below $25k, 1.7% for AGIs $25k-50k, 1.2% for AGIs $50k-75k, 1.2% for AGIs $75k-100k, 1.3% for AGIs $100k-200k)
Total itemized deductions: $19,000 (20% of AGI, reported on 49.8% of returns)
Here:
$19,000
State:
$21,278
Here:
19.8% of AGI
State:
18.9% of AGI
(% of AGI for various income ranges: 11.3% for AGIs below $25k, 11.5% for AGIs $25k-50k, 14.5% for AGIs $50k-75k, 15.1% for AGIs $75k-100k, 15.9% for AGIs $100k-200k, 12.1% for AGIs over 200k)
Charity contributions: $2,646 (reported on 38.6% of returns)
Here:
$2,646
State:
$4,044
(% of AGI for various income ranges: 0.9% for AGIs below $25k, 0.8% for AGIs $25k-50k, 1.4% for AGIs $50k-75k, 1.3% for AGIs $75k-100k, 1.9% for AGIs $100k-200k, 2.1% for AGIs over 200k)
Taxes paid: $8,060 (reported on 49.8% of returns)
50035:
$8,060
State:
$8,846
(% of AGI for various income ranges: 3.2% for AGIs below $25k, 3.4% for AGIs $25k-50k, 5.3% for AGIs $50k-75k, 6.1% for AGIs $75k-100k, 7.5% for AGIs $100k-200k, 6.8% for AGIs over 200k)
Earned income credit: $1,921 (reported on 10.9% of returns)
Here:
$1,921
State:
$2,098
(% of AGI for various income ranges: 4.7% for AGIs below $25k, 1.0% for AGIs $25k-50k)
Percentage of individuals using paid preparers for their 2012 taxes: 56.6%
Here:
57%
State:
65%
(% for various income ranges: 50.0% for AGIs below $25k, 53.8% for AGIs $25k-50k, 54.9% for AGIs $50k-75k, 61.4% for AGIs $75k-100k, 65.2% for AGIs $100k-200k, 66.7% for AGIs over 200k)
Averages for the 2004 tax year for zip code 50035, filed in 2005:
Average Adjusted Gross Income (AGI) in 2004: $52,373 (Individual Income Tax Returns)
Here:
$52,373
State:
$43,875
Salary/wage: $46,420 (reported on 91.7% of returns)
Here:
$46,420
State:
$38,265
(% of AGI for various income ranges: 100.6% for AGIs below $10k, 73.5% for AGIs $10k-25k, 87.9% for AGIs $25k-50k, 87.3% for AGIs $50k-75k, 87.8% for AGIs $75k-100k, 68.5% for AGIs over 100k)
Taxable interest for individuals: $739 (reported on 51.5% of returns)
This zip code:
$739
Iowa:
$1,768
(% of AGI for various income ranges: 2.1% for AGIs below $10k, 1.6% for AGIs $10k-25k, 0.7% for AGIs $25k-50k, 0.4% for AGIs $50k-75k, 0.4% for AGIs $75k-100k, 1.0% for AGIs over 100k)
Taxable dividends: $1,291 (reported on 25.1% of returns)
Here:
$1,291
State:
$2,510
(% of AGI for various income ranges: 2.4% for AGIs below $10k, 1.3% for AGIs $10k-25k, 0.4% for AGIs $25k-50k, 0.6% for AGIs $50k-75k, 0.3% for AGIs $75k-100k, 0.8% for AGIs over 100k)
Net capital gain/loss: +$4,773 (reported on 18.6% of returns)
Here:
+$4,773
State:
+$6,139
(% of AGI for various income ranges: 0.9% for AGIs below $10k, 1.0% for AGIs $10k-25k, 0.1% for AGIs $25k-50k, 0.5% for AGIs $50k-75k, 1.4% for AGIs $75k-100k, 4.0% for AGIs over 100k)
Profit/loss from business: +$7,982 (reported on 18.5% of returns)
Here:
+$7,982
State:
+$8,574
(% of AGI for various income ranges: 4.9% for AGIs below $10k, 6.9% for AGIs $10k-25k, 3.1% for AGIs $25k-50k, 3.0% for AGIs $50k-75k, 2.4% for AGIs $75k-100k, 1.9% for AGIs over 100k)
IRA payment deduction: $3,562 (reported on 1.8% of returns)
50035:
$3,562
Iowa:
$2,970
Self-employed pension: $6,400 (reported on 0.6% of returns)
Here:
$6,400
Iowa:
$11,928
Total itemized deductions: $16,243 (21% of AGI, reported on 49.8% of returns)
Here:
$16,243
State:
$16,976
Here:
21.1% of AGI
State:
20.8% of AGI
(% of AGI for various income ranges: 9.8% for AGIs below $10k, 14.9% for AGIs $10k-25k, 15.0% for AGIs $25k-50k, 15.5% for AGIs $50k-75k, 17.6% for AGIs $75k-100k, 14.5% for AGIs over 100k)
Charity contributions deductions: $2,227 (3% of AGI, reported on 42.6% of returns)
Here:
$2,227
State:
$3,089
Here:
2.8% of AGI
State:
3.6% of AGI
(% of AGI for various income ranges: 2.0% for AGIs $10k-25k, 1.7% for AGIs $25k-50k, 1.5% for AGIs $50k-75k, 1.7% for AGIs $75k-100k, 2.2% for AGIs over 100k)
Total tax: $6,584 (reported on 84.0% of returns)
50035:
$6,584
State:
$6,177
(% of AGI for various income ranges: 3.8% for AGIs below $10k, 5.0% for AGIs $10k-25k, 6.6% for AGIs $25k-50k, 7.7% for AGIs $50k-75k, 9.4% for AGIs $75k-100k, 17.5% for AGIs over 100k)
Earned income credit: $1,393 (reported on 7.6% of returns)
Here:
$1,393
State:
$1,540
Percentage of individuals using paid preparers for their 2004 taxes: 63.5%
Here:
63%
State:
70%
(% for various income ranges: 50.0% for AGIs below $10k, 64.0% for AGIs $10k-25k, 62.8% for AGIs $25k-50k, 65.7% for AGIs $50k-75k, 70.5% for AGIs $75k-100k, 71.6% for AGIs over 100k)
Likely homosexual households (counted as self-reported same-sex unmarried-partner households)
Lesbian couples: 0.0% of all households
Gay men: 0.6% of all households
Household received Food Stamps/SNAP in the past 12 months: 84 Household did not receive Food Stamps/SNAP in the past 12 months: 3,129
Women who had a birth in the past 12 months: 161 (165 now married, 0 unmarried) Women who did not have a birth in the past 12 months: 2,437 (1,272 now married, 1,163 unmarried)
Housing units in zip code 50035 with a mortgage: 2,628 (129 second mortgage, 91 both second mortgage and home equity loan) Houses without a mortgage: 51
Median monthly owner costs for units with a mortgage: $1,787 Median monthly owner costs for units without a mortgage: $581
Residents with income below the poverty level in 2022:
This zip code:
4.8%
Whole state:
11.0%
Residents with income below 50% of the poverty level in 2022:
This zip code:
4.5%
Whole state:
5.5%
Median number of rooms in houses and condos:
Here:
6.3
State:
6.8
Median number of rooms in apartments:
Here:
3.9
State:
4.2
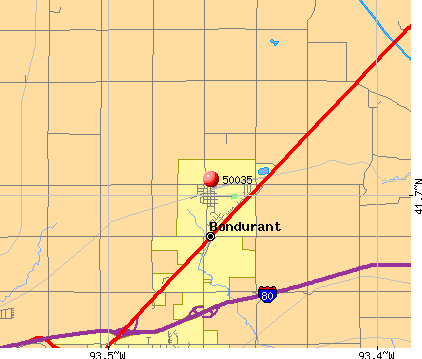
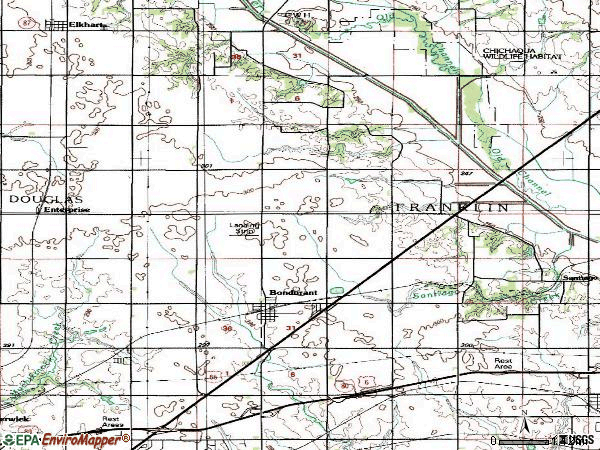
Notable locations in this zip code not listed on our city pages
Notable locations in zip code 50035: Bondurant (A), Enterprise (B), Bondurant Community Library (C), Bondurant City Hall (D), Bondurant Fire Department (E). Display/hide their locations on the map
Churches in zip code 50035 include: Cory Grove Church (A), Bondurant Christian Church (B), Federated Church (C), Bondurant Baptist Church (D). Display/hide their locations on the map
In group quarters: 10 (-1 institutionalized population)
Size of family households: 755 2-persons, 639 3-persons, 685 4-persons, 417 5-persons, 93 6-persons, 10 7-or-more-persons
Size of nonfamily households: 467 1-person, 78 2-persons
2,236 married couples with children.
654 single-parent households (134 men, 520 women).
95.6% of residents of 50035 zip code speak English at home.
1.4% of residents speak Spanish at home (34% very well, 29% well, 37% not at all).
0.8% of residents speak other Indo-European language at home (100% very well).
1.3% of residents speak other language at home (48% very well, 50% well, 2% not at all).
Foreign born population: 409 (4.3%) (90.5% of them are naturalized citizens)
This zip code:
4.3%
Whole state:
6.0%
47%Ivory Coast
22%Honduras
10%Cabo Verde
7%Romania
5%Japan
23%German
9%American
8%English
7%Liberian
6%Irish
6%Dutch
5%Norwegian
Year of entry for the foreign-born population
832010 or later
1952000 to 2009
501990 to 1999
53Before 1990
Facilities with environmental interests located in this zip code:
BONDURANT-FARRAR COMMUNITY SCHOOL DIST (300 GARFIELD ST SW in BONDURANT, IA)
(Integrated Compliance Information System) - ICIS-07-1999-0232, FORMAL ENFORCEMENT ACTION COMPLIANCE ACTIVITY (Tracking inspections of insecticide, fungicide, and rodenticide, and toxic substances) (Resource Conservation and Recovery Act (tracking hazardous waste)) Alternative names: BONDURANT-FARRAR C S D, BONDURANT FARRAR COM SCH DIST, BONDURANT-FARRAR CSD, BONDURANT-FARRAR SCHOOL DISTRICT, SITE ID 191530024
BONDURANT MUNI WATER SUPPLY (200 SECOND ST. NE in BONDURANT, IA)
STATE MASTER (Iowa emission factors information) - SDWIS-IA7717032, DRINKING WATER SYSTEM National Pollutant Discharge Elimination System NON-MAJOR (Tracking pollutant discharge elimination systems) - permit COMMUNITY WATER SYSTEM (SDWIS) Organizations: BONDURANT, CITY OF MS4 (CONTACT/OWNER)
, BONDURANT, CITY OF (LEGALLY RESPONSIBLE ENTITY)
Alternative names: BONDURANT, CITY OF MS4, BONDURANT WATER SUPPLY C/O CITY HALL, LONGS PEAK COUNCIL, INC.
ANDERSON ELEMENTARY SCHOOL (4TH AND GARFIELD in BONDURANT, IA)
(National Center for Education Statistics) - STATE ID-770720 409 Organizations: BONDURANT-FARRAR COMM SCHOOL DISTRICT (SCHOOL DISTRICT)
BONDURANT-FARRAR JR-SR HIGH SCHOOL (300 GARFIELD ST. SW in BONDURANT, IA)
(National Center for Education Statistics) - STATE ID-770720 172 Organizations: BONDURANT-FARRAR COMM SCHOOL DISTRICT (SCHOOL DISTRICT)
BONDURANT WWTP (SEC36 T80N R23W in BONDURANT, IA)
(Integrated Compliance Information System) - ICIS-07-1985-0018, FORMAL ENFORCEMENT ACTION Business SIC classification: SEWERAGE SYSTEMS
REGIONAL WASTE COLLECTION CENTER (225 PRAIRIE DRIVE in BONDURANT, IA)
AIR MINOR (AIRS/AFS) Conditionally Exempt Small Quantity Generators, less than 100 kg/month of hazardous waste (Resource Conservation and Recovery Act (tracking hazardous waste)) - notification USED OIL PROGRAM (Resource Conservation and Recovery Act (tracking hazardous waste)) Business SIC classification: REFUSE SYSTEMS Organizations: METRO WASTE AUTHORITY (CONTACT/OWNER)
Alternative names: METRO WASTE AUTHORITY REGIONAL COL CTR, METRO WASTE AUTHORITY REGNL COL CTR
BONDURANT CITY OF STP (UNKNOWN in BONDURANT, IA)
National Pollutant Discharge Elimination System NON-MAJOR (Tracking pollutant discharge elimination systems) - permit Business SIC classification: SEWERAGE SYSTEMS Organizations: CITY OF BONDURANT (CONTACT/OWNER)
CORYS PETROLEUM SERVICE INC (12216 NE 66TH ST in BONDURANT, IA)
(Resource Conservation and Recovery Act (tracking hazardous waste)) Organizations: MR & MRS JOHN CORY (CONTACT/OWNER)
COUNTRYWIDE GRAIN TERMINAL (1700 S PLEASANT HILL BOULEVARD in PLEASANT HILL, IA)
AIR SYNTHETIC MINOR (AIRS/AFS) Business SIC classification: GRAIN AND FIELD BEANS Alternative names: COUNTRYWIDE GRAIN TERMINAL LCL
CSI CHEMICAL CORP (10980 HUBBELL AVE in BONDURANT, IA)
COMPLIANCE ACTIVITY (Tracking inspections of insecticide, fungicide, and rodenticide, and toxic substances)
T S COLLISION CENTER (1601 GARFIELD SW in BONDURANT, IA)
AIR SYNTHETIC MINOR (AIRS/AFS) Business SIC classification: NONCLASSIFIABLE ESTABLISHMENTS Alternative names: CLOSED FACILITY -- T S COLLISION CENTER
TIMOTHY CARLSON PROPERTY (11965 NE 68 in BONDURANT, IA)
COMPLIANCE ACTIVITY (Tracking inspections of insecticide, fungicide, and rodenticide, and toxic substances)
Housing units lacking complete plumbing facilities: 0.3% Housing units lacking complete kitchen facilities: 0.8%
62.4%Utility gas
26.5%Electricity
10.1%Bottled, tank, or LP gas
0.8%Other fuel
Population in 1990: 2,666. Population change in the 1990s: +298 (+11.2%).
Place of birth for U.S.-born residents:
This state: 7,427
Northeast: 96
Midwest: 1,141
South: 125
West: 344
68% of the 50035 zip code residents lived in the same house 5 years ago. Out of people who lived in different houses, 66% lived in this county. Out of people who lived in different counties, 50% lived in Iowa.
92% of the 50035 zip code residents lived in the same house 1 year ago. Out of people who lived in different houses, 75% moved from this county. Out of people who lived in different houses, 18% moved from different county within same state. Out of people who lived in different houses, 6% moved from different state.
Private vs. public school enrollment:
Students in private schools in grades 1 to 8 (elementary and middle school): 139
Here:
10.3%
Iowa:
10.6%
Students in private schools in grades 9 to 12 (high school): 57
Here:
8.5%
Iowa:
7.9%
Students in private undergraduate colleges: 63
Here:
12.9%
Iowa:
23.9%
Occupation by median earnings in the past 12 months ($)
111,645Architecture and engineering occupations
97,267Computer and mathematical occupations
96,872Health technologists and technicians
95,102Management occupations
85,218Sales and related occupations
81,824Business and financial operations occupations
Companies with federal contracts located in this zip code:
MIDWEST UNDERGROUND SUPPLY LLC (6222 NE 62ND AVE in BONDURANT, IA; small business)
$9,000 with Army for Miscellaneous Construction Equipment. Signed on 2004-09-23. Completion date: 2004-10-25.
Top industries in this zip code by the number of employees in 2005:
Detailed PMIC statistics for the following Tracts:0101.02
2002 - 2018 National Fire Incident Reporting System (NFIRS) incidents
According to the data from the years 2002 - 2018 the average number of fires per year is 10. The highest number of reported fires - 21 took place in 2005, and the least - 1 in 2008. The data has a growing trend.
When looking into fire subcategories, the most reports belonged to: Outside Fires (44.6%), and Structure Fires (39.9%).
Fire incident types reported to NFIRS in Zip Code 50035


 Nearest zip codes: 50009, 50073, 50032, 50021, 50169, 50161.


 According to the data from the years 2002 - 2018 the average number of fires per year is 10. The highest number of reported fires - 21 took place in 2005, and the least - 1 in 2008. The data has a growing trend.
 When looking into fire subcategories, the most reports belonged to: Outside Fires (44.6%), and Structure Fires (39.9%).