Estimated zip code population in 2022: 24,818
Zip code population in 2010: 25,109
Zip code population in 2000: 25,726
Houses and condos: 12,056
Renter-occupied apartments: 3,152
% of renters here:
28%State:
33%
March 2022 cost of living index in zip code 44708: 90.1
(less than average, U.S. average is 100)
Land area: 10.2
sq. mi.
Water area: 0.4
sq. mi.
Population density: 2,424 people per square mile (low).
OSM Map
General Map
Google Map
MSN Map
OSM Map
General Map
Google Map
MSN Map
OSM Map
General Map
Google Map
MSN Map
OSM Map
General Map
Google Map
MSN Map
Please wait while loading the map...
Real estate property taxes paid for housing units in 2022:
This zip code:
1.3% ($2,247)Ohio:
1.3% ($2,639)
Median real estate property taxes paid for housing units with mortgages in 2022: $2,305 (1.4%)
Median real estate property taxes paid for housing units with no mortgage in 2022: $2,170 (1.3%)
Profiles of local businesses
Business Search - 14 Million verified businesses
Males: 11,736 Females: 13,080
For population 25 years and over in 44708:
High school or higher: 93.6%Bachelor's degree or higher: 27.4%Graduate or professional degree: 11.2%Unemployed: 2.7%Mean travel time to work (commute): 18.1 minutes
For population 15 years and over in 44708:
Never married: 32.9%Now married: 47.1%Separated: 0.5%Widowed: 6.6%Divorced: 12.9%
Zip code 44708 compared to state average:
Median age above state average. 20,310 81.8% White 1,984 8.0% Black 1,010 4.1% Two or more races 806 3.2% Asian 644 2.6% Hispanic or Latino 60 0.2% Some other race
Data:
Median household income ($)
Median household income (% change since 2000)
Household income diversity
Ratio of average income to average house value (%)
Ratio of average income to average rent
Median household income ($) - White
Median household income ($) - Black or African American
Median household income ($) - Asian
Median household income ($) - Hispanic or Latino
Median household income ($) - American Indian and Alaska Native
Median household income ($) - Multirace
Median household income ($) - Other Race
Median household income for houses/condos with a mortgage ($)
Median household income for apartments without a mortgage ($)
Races - White alone (%)
Races - White alone (% change since 2000)
Races - Black alone (%)
Races - Black alone (% change since 2000)
Races - American Indian alone (%)
Races - American Indian alone (% change since 2000)
Races - Asian alone (%)
Races - Asian alone (% change since 2000)
Races - Hispanic (%)
Races - Hispanic (% change since 2000)
Races - Native Hawaiian and Other Pacific Islander alone (%)
Races - Native Hawaiian and Other Pacific Islander alone (% change since 2000)
Races - Two or more races (%)
Races - Two or more races (% change since 2000)
Races - Other race alone (%)
Races - Other race alone (% change since 2000)
Racial diversity
Unemployment (%)
Unemployment (% change since 2000)
Unemployment (%) - White
Unemployment (%) - Black or African American
Unemployment (%) - Asian
Unemployment (%) - Hispanic or Latino
Unemployment (%) - American Indian and Alaska Native
Unemployment (%) - Multirace
Unemployment (%) - Other Race
Population density (people per square mile)
Population - Males (%)
Population - Females (%)
Population - Males (%) - White
Population - Males (%) - Black or African American
Population - Males (%) - Asian
Population - Males (%) - Hispanic or Latino
Population - Males (%) - American Indian and Alaska Native
Population - Males (%) - Multirace
Population - Males (%) - Other Race
Population - Females (%) - White
Population - Females (%) - Black or African American
Population - Females (%) - Asian
Population - Females (%) - Hispanic or Latino
Population - Females (%) - American Indian and Alaska Native
Population - Females (%) - Multirace
Population - Females (%) - Other Race
Coronavirus confirmed cases (Jun 08, 2024)
Deaths caused by coronavirus (Jun 08, 2024)
Coronavirus confirmed cases (per 100k population) (Jun 08, 2024)
Deaths caused by coronavirus (per 100k population) (Jun 08, 2024)
Daily increase in number of cases (Jun 08, 2024)
Weekly increase in number of cases (Jun 08, 2024)
Cases doubled (in days) (Jun 08, 2024)
Hospitalized patients (Apr 18, 2022)
Negative test results (Apr 18, 2022)
Total test results (Apr 18, 2022)
COVID Vaccine doses distributed (per 100k population) (Sep 19, 2023)
COVID Vaccine doses administered (per 100k population) (Sep 19, 2023)
COVID Vaccine doses distributed (Sep 19, 2023)
COVID Vaccine doses administered (Sep 19, 2023)
Likely homosexual households (%)
Likely homosexual households (% change since 2000)
Likely homosexual households - Lesbian couples (%)
Likely homosexual households - Lesbian couples (% change since 2000)
Likely homosexual households - Gay men (%)
Likely homosexual households - Gay men (% change since 2000)
Cost of living index
Median gross rent ($)
Median contract rent ($)
Median monthly housing costs ($)
Median house or condo value ($)
Median house or condo value ($ change since 2000)
Mean house or condo value by units in structure - 1, detached ($)
Mean house or condo value by units in structure - 1, attached ($)
Mean house or condo value by units in structure - 2 ($)
Mean house or condo value by units in structure by units in structure - 3 or 4 ($)
Mean house or condo value by units in structure - 5 or more ($)
Mean house or condo value by units in structure - Boat, RV, van, etc. ($)
Mean house or condo value by units in structure - Mobile home ($)
Median house or condo value ($) - White
Median house or condo value ($) - Black or African American
Median house or condo value ($) - Asian
Median house or condo value ($) - Hispanic or Latino
Median house or condo value ($) - American Indian and Alaska Native
Median house or condo value ($) - Multirace
Median house or condo value ($) - Other Race
Median resident age
Resident age diversity
Median resident age - Males
Median resident age - Females
Median resident age - White
Median resident age - Black or African American
Median resident age - Asian
Median resident age - Hispanic or Latino
Median resident age - American Indian and Alaska Native
Median resident age - Multirace
Median resident age - Other Race
Median resident age - Males - White
Median resident age - Males - Black or African American
Median resident age - Males - Asian
Median resident age - Males - Hispanic or Latino
Median resident age - Males - American Indian and Alaska Native
Median resident age - Males - Multirace
Median resident age - Males - Other Race
Median resident age - Females - White
Median resident age - Females - Black or African American
Median resident age - Females - Asian
Median resident age - Females - Hispanic or Latino
Median resident age - Females - American Indian and Alaska Native
Median resident age - Females - Multirace
Median resident age - Females - Other Race
Commute - mean travel time to work (minutes)
Travel time to work - Less than 5 minutes (%)
Travel time to work - Less than 5 minutes (% change since 2000)
Travel time to work - 5 to 9 minutes (%)
Travel time to work - 5 to 9 minutes (% change since 2000)
Travel time to work - 10 to 19 minutes (%)
Travel time to work - 10 to 19 minutes (% change since 2000)
Travel time to work - 20 to 29 minutes (%)
Travel time to work - 20 to 29 minutes (% change since 2000)
Travel time to work - 30 to 39 minutes (%)
Travel time to work - 30 to 39 minutes (% change since 2000)
Travel time to work - 40 to 59 minutes (%)
Travel time to work - 40 to 59 minutes (% change since 2000)
Travel time to work - 60 to 89 minutes (%)
Travel time to work - 60 to 89 minutes (% change since 2000)
Travel time to work - 90 or more minutes (%)
Travel time to work - 90 or more minutes (% change since 2000)
Marital status - Never married (%)
Marital status - Now married (%)
Marital status - Separated (%)
Marital status - Widowed (%)
Marital status - Divorced (%)
Median family income ($)
Median family income (% change since 2000)
Median non-family income ($)
Median non-family income (% change since 2000)
Median per capita income ($)
Median per capita income (% change since 2000)
Median family income ($) - White
Median family income ($) - Black or African American
Median family income ($) - Asian
Median family income ($) - Hispanic or Latino
Median family income ($) - American Indian and Alaska Native
Median family income ($) - Multirace
Median family income ($) - Other Race
Median year house/condo built
Median year apartment built
Year house built - Built 2005 or later (%)
Year house built - Built 2000 to 2004 (%)
Year house built - Built 1990 to 1999 (%)
Year house built - Built 1980 to 1989 (%)
Year house built - Built 1970 to 1979 (%)
Year house built - Built 1960 to 1969 (%)
Year house built - Built 1950 to 1959 (%)
Year house built - Built 1940 to 1949 (%)
Year house built - Built 1939 or earlier (%)
Average household size
Household density (households per square mile)
Average household size - White
Average household size - Black or African American
Average household size - Asian
Average household size - Hispanic or Latino
Average household size - American Indian and Alaska Native
Average household size - Multirace
Average household size - Other Race
Occupied housing units (%)
Vacant housing units (%)
Owner occupied housing units (%)
Renter occupied housing units (%)
Vacancy status - For rent (%)
Vacancy status - For sale only (%)
Vacancy status - Rented or sold, not occupied (%)
Vacancy status - For seasonal, recreational, or occasional use (%)
Vacancy status - For migrant workers (%)
Vacancy status - Other vacant (%)
Residents with income below the poverty level (%)
Residents with income below 50% of the poverty level (%)
Children below poverty level (%)
Poor families by family type - Married-couple family (%)
Poor families by family type - Male, no wife present (%)
Poor families by family type - Female, no husband present (%)
Poverty status for native-born residents (%)
Poverty status for foreign-born residents (%)
Poverty among high school graduates not in families (%)
Poverty among people who did not graduate high school not in families (%)
Residents with income below the poverty level (%) - White
Residents with income below the poverty level (%) - Black or African American
Residents with income below the poverty level (%) - Asian
Residents with income below the poverty level (%) - Hispanic or Latino
Residents with income below the poverty level (%) - American Indian and Alaska Native
Residents with income below the poverty level (%) - Multirace
Residents with income below the poverty level (%) - Other Race
Air pollution - Air Quality Index (AQI)
Air pollution - CO
Air pollution - NO2
Air pollution - SO2
Air pollution - Ozone
Air pollution - PM10
Air pollution - PM25
Air pollution - Pb
Crime - Murders per 100,000 population
Crime - Rapes per 100,000 population
Crime - Robberies per 100,000 population
Crime - Assaults per 100,000 population
Crime - Burglaries per 100,000 population
Crime - Thefts per 100,000 population
Crime - Auto thefts per 100,000 population
Crime - Arson per 100,000 population
Crime - City-data.com crime index
Crime - Violent crime index
Crime - Property crime index
Crime - Murders per 100,000 population (5 year average)
Crime - Rapes per 100,000 population (5 year average)
Crime - Robberies per 100,000 population (5 year average)
Crime - Assaults per 100,000 population (5 year average)
Crime - Burglaries per 100,000 population (5 year average)
Crime - Thefts per 100,000 population (5 year average)
Crime - Auto thefts per 100,000 population (5 year average)
Crime - Arson per 100,000 population (5 year average)
Crime - City-data.com crime index (5 year average)
Crime - Violent crime index (5 year average)
Crime - Property crime index (5 year average)
1996 Presidential Elections Results (%) - Democratic Party (Clinton)
1996 Presidential Elections Results (%) - Republican Party (Dole)
1996 Presidential Elections Results (%) - Other
2000 Presidential Elections Results (%) - Democratic Party (Gore)
2000 Presidential Elections Results (%) - Republican Party (Bush)
2000 Presidential Elections Results (%) - Other
2004 Presidential Elections Results (%) - Democratic Party (Kerry)
2004 Presidential Elections Results (%) - Republican Party (Bush)
2004 Presidential Elections Results (%) - Other
2008 Presidential Elections Results (%) - Democratic Party (Obama)
2008 Presidential Elections Results (%) - Republican Party (McCain)
2008 Presidential Elections Results (%) - Other
2012 Presidential Elections Results (%) - Democratic Party (Obama)
2012 Presidential Elections Results (%) - Republican Party (Romney)
2012 Presidential Elections Results (%) - Other
2016 Presidential Elections Results (%) - Democratic Party (Clinton)
2016 Presidential Elections Results (%) - Republican Party (Trump)
2016 Presidential Elections Results (%) - Other
2020 Presidential Elections Results (%) - Democratic Party (Biden)
2020 Presidential Elections Results (%) - Republican Party (Trump)
2020 Presidential Elections Results (%) - Other
Ancestries Reported - Arab (%)
Ancestries Reported - Czech (%)
Ancestries Reported - Danish (%)
Ancestries Reported - Dutch (%)
Ancestries Reported - English (%)
Ancestries Reported - French (%)
Ancestries Reported - French Canadian (%)
Ancestries Reported - German (%)
Ancestries Reported - Greek (%)
Ancestries Reported - Hungarian (%)
Ancestries Reported - Irish (%)
Ancestries Reported - Italian (%)
Ancestries Reported - Lithuanian (%)
Ancestries Reported - Norwegian (%)
Ancestries Reported - Polish (%)
Ancestries Reported - Portuguese (%)
Ancestries Reported - Russian (%)
Ancestries Reported - Scotch-Irish (%)
Ancestries Reported - Scottish (%)
Ancestries Reported - Slovak (%)
Ancestries Reported - Subsaharan African (%)
Ancestries Reported - Swedish (%)
Ancestries Reported - Swiss (%)
Ancestries Reported - Ukrainian (%)
Ancestries Reported - United States (%)
Ancestries Reported - Welsh (%)
Ancestries Reported - West Indian (%)
Ancestries Reported - Other (%)
Educational Attainment - No schooling completed (%)
Educational Attainment - Less than high school (%)
Educational Attainment - High school or equivalent (%)
Educational Attainment - Less than 1 year of college (%)
Educational Attainment - 1 or more years of college (%)
Educational Attainment - Associate degree (%)
Educational Attainment - Bachelor's degree (%)
Educational Attainment - Master's degree (%)
Educational Attainment - Professional school degree (%)
Educational Attainment - Doctorate degree (%)
School Enrollment - Nursery, preschool (%)
School Enrollment - Kindergarten (%)
School Enrollment - Grade 1 to 4 (%)
School Enrollment - Grade 5 to 8 (%)
School Enrollment - Grade 9 to 12 (%)
School Enrollment - College undergrad (%)
School Enrollment - Graduate or professional (%)
School Enrollment - Not enrolled in school (%)
School enrollment - Public schools (%)
School enrollment - Private schools (%)
School enrollment - Not enrolled (%)
Median number of rooms in houses and condos
Median number of rooms in apartments
Housing units lacking complete plumbing facilities (%)
Housing units lacking complete kitchen facilities (%)
Density of houses
Urban houses (%)
Rural houses (%)
Households with people 60 years and over (%)
Households with people 65 years and over (%)
Households with people 75 years and over (%)
Households with one or more nonrelatives (%)
Households with no nonrelatives (%)
Population in households (%)
Family households (%)
Nonfamily households (%)
Population in families (%)
Family households with own children (%)
Median number of bedrooms in owner occupied houses
Mean number of bedrooms in owner occupied houses
Median number of bedrooms in renter occupied houses
Mean number of bedrooms in renter occupied houses
Median number of vehichles in owner occupied houses
Mean number of vehichles in owner occupied houses
Median number of vehichles in renter occupied houses
Mean number of vehichles in renter occupied houses
Mortgage status - with mortgage (%)
Mortgage status - with second mortgage (%)
Mortgage status - with home equity loan (%)
Mortgage status - with both second mortgage and home equity loan (%)
Mortgage status - without a mortgage (%)
Average family size
Average family size - White
Average family size - Black or African American
Average family size - Asian
Average family size - Hispanic or Latino
Average family size - American Indian and Alaska Native
Average family size - Multirace
Average family size - Other Race
Geographical mobility - Same house 1 year ago (%)
Geographical mobility - Moved within same county (%)
Geographical mobility - Moved from different county within same state (%)
Geographical mobility - Moved from different state (%)
Geographical mobility - Moved from abroad (%)
Place of birth - Born in state of residence (%)
Place of birth - Born in other state (%)
Place of birth - Native, outside of US (%)
Place of birth - Foreign born (%)
Housing units in structures - 1, detached (%)
Housing units in structures - 1, attached (%)
Housing units in structures - 2 (%)
Housing units in structures - 3 or 4 (%)
Housing units in structures - 5 to 9 (%)
Housing units in structures - 10 to 19 (%)
Housing units in structures - 20 to 49 (%)
Housing units in structures - 50 or more (%)
Housing units in structures - Mobile home (%)
Housing units in structures - Boat, RV, van, etc. (%)
House/condo owner moved in on average (years ago)
Renter moved in on average (years ago)
Year householder moved into unit - Moved in 1999 to March 2000 (%)
Year householder moved into unit - Moved in 1995 to 1998 (%)
Year householder moved into unit - Moved in 1990 to 1994 (%)
Year householder moved into unit - Moved in 1980 to 1989 (%)
Year householder moved into unit - Moved in 1970 to 1979 (%)
Year householder moved into unit - Moved in 1969 or earlier (%)
Means of transportation to work - Drove car alone (%)
Means of transportation to work - Carpooled (%)
Means of transportation to work - Public transportation (%)
Means of transportation to work - Bus or trolley bus (%)
Means of transportation to work - Streetcar or trolley car (%)
Means of transportation to work - Subway or elevated (%)
Means of transportation to work - Railroad (%)
Means of transportation to work - Ferryboat (%)
Means of transportation to work - Taxicab (%)
Means of transportation to work - Motorcycle (%)
Means of transportation to work - Bicycle (%)
Means of transportation to work - Walked (%)
Means of transportation to work - Other means (%)
Working at home (%)
Industry diversity
Most Common Industries - Agriculture, forestry, fishing and hunting, and mining (%)
Most Common Industries - Agriculture, forestry, fishing and hunting (%)
Most Common Industries - Mining, quarrying, and oil and gas extraction (%)
Most Common Industries - Construction (%)
Most Common Industries - Manufacturing (%)
Most Common Industries - Wholesale trade (%)
Most Common Industries - Retail trade (%)
Most Common Industries - Transportation and warehousing, and utilities (%)
Most Common Industries - Transportation and warehousing (%)
Most Common Industries - Utilities (%)
Most Common Industries - Information (%)
Most Common Industries - Finance and insurance, and real estate and rental and leasing (%)
Most Common Industries - Finance and insurance (%)
Most Common Industries - Real estate and rental and leasing (%)
Most Common Industries - Professional, scientific, and management, and administrative and waste management services (%)
Most Common Industries - Professional, scientific, and technical services (%)
Most Common Industries - Management of companies and enterprises (%)
Most Common Industries - Administrative and support and waste management services (%)
Most Common Industries - Educational services, and health care and social assistance (%)
Most Common Industries - Educational services (%)
Most Common Industries - Health care and social assistance (%)
Most Common Industries - Arts, entertainment, and recreation, and accommodation and food services (%)
Most Common Industries - Arts, entertainment, and recreation (%)
Most Common Industries - Accommodation and food services (%)
Most Common Industries - Other services, except public administration (%)
Most Common Industries - Public administration (%)
Occupation diversity
Most Common Occupations - Management, business, science, and arts occupations (%)
Most Common Occupations - Management, business, and financial occupations (%)
Most Common Occupations - Management occupations (%)
Most Common Occupations - Business and financial operations occupations (%)
Most Common Occupations - Computer, engineering, and science occupations (%)
Most Common Occupations - Computer and mathematical occupations (%)
Most Common Occupations - Architecture and engineering occupations (%)
Most Common Occupations - Life, physical, and social science occupations (%)
Most Common Occupations - Education, legal, community service, arts, and media occupations (%)
Most Common Occupations - Community and social service occupations (%)
Most Common Occupations - Legal occupations (%)
Most Common Occupations - Education, training, and library occupations (%)
Most Common Occupations - Arts, design, entertainment, sports, and media occupations (%)
Most Common Occupations - Healthcare practitioners and technical occupations (%)
Most Common Occupations - Health diagnosing and treating practitioners and other technical occupations (%)
Most Common Occupations - Health technologists and technicians (%)
Most Common Occupations - Service occupations (%)
Most Common Occupations - Healthcare support occupations (%)
Most Common Occupations - Protective service occupations (%)
Most Common Occupations - Fire fighting and prevention, and other protective service workers including supervisors (%)
Most Common Occupations - Law enforcement workers including supervisors (%)
Most Common Occupations - Food preparation and serving related occupations (%)
Most Common Occupations - Building and grounds cleaning and maintenance occupations (%)
Most Common Occupations - Personal care and service occupations (%)
Most Common Occupations - Sales and office occupations (%)
Most Common Occupations - Sales and related occupations (%)
Most Common Occupations - Office and administrative support occupations (%)
Most Common Occupations - Natural resources, construction, and maintenance occupations (%)
Most Common Occupations - Farming, fishing, and forestry occupations (%)
Most Common Occupations - Construction and extraction occupations (%)
Most Common Occupations - Installation, maintenance, and repair occupations (%)
Most Common Occupations - Production, transportation, and material moving occupations (%)
Most Common Occupations - Production occupations (%)
Most Common Occupations - Transportation occupations (%)
Most Common Occupations - Material moving occupations (%)
People in Group quarters - Institutionalized population (%)
People in Group quarters - Correctional institutions (%)
People in Group quarters - Federal prisons and detention centers (%)
People in Group quarters - Halfway houses (%)
People in Group quarters - Local jails and other confinement facilities (including police lockups) (%)
People in Group quarters - Military disciplinary barracks (%)
People in Group quarters - State prisons (%)
People in Group quarters - Other types of correctional institutions (%)
People in Group quarters - Nursing homes (%)
People in Group quarters - Hospitals/wards, hospices, and schools for the handicapped (%)
People in Group quarters - Hospitals/wards and hospices for chronically ill (%)
People in Group quarters - Hospices or homes for chronically ill (%)
People in Group quarters - Military hospitals or wards for chronically ill (%)
People in Group quarters - Other hospitals or wards for chronically ill (%)
People in Group quarters - Hospitals or wards for drug/alcohol abuse (%)
People in Group quarters - Mental (Psychiatric) hospitals or wards (%)
People in Group quarters - Schools, hospitals, or wards for the mentally retarded (%)
People in Group quarters - Schools, hospitals, or wards for the physically handicapped (%)
People in Group quarters - Institutions for the deaf (%)
People in Group quarters - Institutions for the blind (%)
People in Group quarters - Orthopedic wards and institutions for the physically handicapped (%)
People in Group quarters - Wards in general hospitals for patients who have no usual home elsewhere (%)
People in Group quarters - Wards in military hospitals for patients who have no usual home elsewhere (%)
People in Group quarters - Juvenile institutions (%)
People in Group quarters - Long-term care (%)
People in Group quarters - Homes for abused, dependent, and neglected children (%)
People in Group quarters - Residential treatment centers for emotionally disturbed children (%)
People in Group quarters - Training schools for juvenile delinquents (%)
People in Group quarters - Short-term care, detention or diagnostic centers for delinquent children (%)
People in Group quarters - Type of juvenile institution unknown (%)
People in Group quarters - Noninstitutionalized population (%)
People in Group quarters - College dormitories (includes college quarters off campus) (%)
People in Group quarters - Military quarters (%)
People in Group quarters - On base (%)
People in Group quarters - Barracks, unaccompanied personnel housing (UPH), (Enlisted/Officer), ;and similar group living quarters for military personnel (%)
People in Group quarters - Transient quarters for temporary residents (%)
People in Group quarters - Military ships (%)
People in Group quarters - Group homes (%)
People in Group quarters - Homes or halfway houses for drug/alcohol abuse (%)
People in Group quarters - Homes for the mentally ill (%)
People in Group quarters - Homes for the mentally retarded (%)
People in Group quarters - Homes for the physically handicapped (%)
People in Group quarters - Other group homes (%)
People in Group quarters - Religious group quarters (%)
People in Group quarters - Dormitories (%)
People in Group quarters - Agriculture workers' dormitories on farms (%)
People in Group quarters - Job Corps and vocational training facilities (%)
People in Group quarters - Other workers' dormitories (%)
People in Group quarters - Crews of maritime vessels (%)
People in Group quarters - Other nonhousehold living situations (%)
People in Group quarters - Other noninstitutional group quarters (%)
Residents speaking English at home (%)
Residents speaking English at home - Born in the United States (%)
Residents speaking English at home - Native, born elsewhere (%)
Residents speaking English at home - Foreign born (%)
Residents speaking Spanish at home (%)
Residents speaking Spanish at home - Born in the United States (%)
Residents speaking Spanish at home - Native, born elsewhere (%)
Residents speaking Spanish at home - Foreign born (%)
Residents speaking other language at home (%)
Residents speaking other language at home - Born in the United States (%)
Residents speaking other language at home - Native, born elsewhere (%)
Residents speaking other language at home - Foreign born (%)
Class of Workers - Employee of private company (%)
Class of Workers - Self-employed in own incorporated business (%)
Class of Workers - Private not-for-profit wage and salary workers (%)
Class of Workers - Local government workers (%)
Class of Workers - State government workers (%)
Class of Workers - Federal government workers (%)
Class of Workers - Self-employed workers in own not incorporated business and Unpaid family workers (%)
House heating fuel used in houses and condos - Utility gas (%)
House heating fuel used in houses and condos - Bottled, tank, or LP gas (%)
House heating fuel used in houses and condos - Electricity (%)
House heating fuel used in houses and condos - Fuel oil, kerosene, etc. (%)
House heating fuel used in houses and condos - Coal or coke (%)
House heating fuel used in houses and condos - Wood (%)
House heating fuel used in houses and condos - Solar energy (%)
House heating fuel used in houses and condos - Other fuel (%)
House heating fuel used in houses and condos - No fuel used (%)
House heating fuel used in apartments - Utility gas (%)
House heating fuel used in apartments - Bottled, tank, or LP gas (%)
House heating fuel used in apartments - Electricity (%)
House heating fuel used in apartments - Fuel oil, kerosene, etc. (%)
House heating fuel used in apartments - Coal or coke (%)
House heating fuel used in apartments - Wood (%)
House heating fuel used in apartments - Solar energy (%)
House heating fuel used in apartments - Other fuel (%)
House heating fuel used in apartments - No fuel used (%)
Armed forces status - In Armed Forces (%)
Armed forces status - Civilian (%)
Armed forces status - Civilian - Veteran (%)
Armed forces status - Civilian - Nonveteran (%)
Fatal accidents locations in years 2005-2021
Fatal accidents locations in 2005
Fatal accidents locations in 2006
Fatal accidents locations in 2007
Fatal accidents locations in 2008
Fatal accidents locations in 2009
Fatal accidents locations in 2010
Fatal accidents locations in 2011
Fatal accidents locations in 2012
Fatal accidents locations in 2013
Fatal accidents locations in 2014
Fatal accidents locations in 2015
Fatal accidents locations in 2016
Fatal accidents locations in 2017
Fatal accidents locations in 2018
Fatal accidents locations in 2019
Fatal accidents locations in 2020
Fatal accidents locations in 2021
Alcohol use - People drinking some alcohol every month (%)
Alcohol use - People not drinking at all (%)
Alcohol use - Average days/month drinking alcohol
Alcohol use - Average drinks/week
Alcohol use - Average days/year people drink much
Audiometry - Average condition of hearing (%)
Audiometry - People that can hear a whisper from across a quiet room (%)
Audiometry - People that can hear normal voice from across a quiet room (%)
Audiometry - Ears ringing, roaring, buzzing (%)
Audiometry - Had a job exposure to loud noise (%)
Audiometry - Had off-work exposure to loud noise (%)
Blood Pressure & Cholesterol - Has high blood pressure (%)
Blood Pressure & Cholesterol - Checking blood pressure at home (%)
Blood Pressure & Cholesterol - Frequently checking blood cholesterol (%)
Blood Pressure & Cholesterol - Has high cholesterol level (%)
Consumer Behavior - Money monthly spent on food at supermarket/grocery store
Consumer Behavior - Money monthly spent on food at other stores
Consumer Behavior - Money monthly spent on eating out
Consumer Behavior - Money monthly spent on carryout/delivered foods
Consumer Behavior - Income spent on food at supermarket/grocery store (%)
Consumer Behavior - Income spent on food at other stores (%)
Consumer Behavior - Income spent on eating out (%)
Consumer Behavior - Income spent on carryout/delivered foods (%)
Current Health Status - General health condition (%)
Current Health Status - Blood donors (%)
Current Health Status - Has blood ever tested for HIV virus (%)
Current Health Status - Left-handed people (%)
Dermatology - People using sunscreen (%)
Diabetes - Diabetics (%)
Diabetes - Had a blood test for high blood sugar (%)
Diabetes - People taking insulin (%)
Diet Behavior & Nutrition - Diet health (%)
Diet Behavior & Nutrition - Milk product consumption (# of products/month)
Diet Behavior & Nutrition - Meals not home prepared (#/week)
Diet Behavior & Nutrition - Meals from fast food or pizza place (#/week)
Diet Behavior & Nutrition - Ready-to-eat foods (#/month)
Diet Behavior & Nutrition - Frozen meals/pizza (#/month)
Drug Use - People that ever used marijuana or hashish (%)
Drug Use - Ever used hard drugs (%)
Drug Use - Ever used any form of cocaine (%)
Drug Use - Ever used heroin (%)
Drug Use - Ever used methamphetamine (%)
Health Insurance - People covered by health insurance (%)
Kidney Conditions-Urology - Avg. # of times urinating at night
Medical Conditions - People with asthma (%)
Medical Conditions - People with anemia (%)
Medical Conditions - People with psoriasis (%)
Medical Conditions - People with overweight (%)
Medical Conditions - Elderly people having difficulties in thinking or remembering (%)
Medical Conditions - People who ever received blood transfusion (%)
Medical Conditions - People having trouble seeing even with glass/contacts (%)
Medical Conditions - People with arthritis (%)
Medical Conditions - People with gout (%)
Medical Conditions - People with congestive heart failure (%)
Medical Conditions - People with coronary heart disease (%)
Medical Conditions - People with angina pectoris (%)
Medical Conditions - People who ever had heart attack (%)
Medical Conditions - People who ever had stroke (%)
Medical Conditions - People with emphysema (%)
Medical Conditions - People with thyroid problem (%)
Medical Conditions - People with chronic bronchitis (%)
Medical Conditions - People with any liver condition (%)
Medical Conditions - People who ever had cancer or malignancy (%)
Mental Health - People who have little interest in doing things (%)
Mental Health - People feeling down, depressed, or hopeless (%)
Mental Health - People who have trouble sleeping or sleeping too much (%)
Mental Health - People feeling tired or having little energy (%)
Mental Health - People with poor appetite or overeating (%)
Mental Health - People feeling bad about themself (%)
Mental Health - People who have trouble concentrating on things (%)
Mental Health - People moving or speaking slowly or too fast (%)
Mental Health - People having thoughts they would be better off dead (%)
Oral Health - Average years since last visit a dentist
Oral Health - People embarrassed because of mouth (%)
Oral Health - People with gum disease (%)
Oral Health - General health of teeth and gums (%)
Oral Health - Average days a week using dental floss/device
Oral Health - Average days a week using mouthwash for dental problem
Oral Health - Average number of teeth
Pesticide Use - Households using pesticides to control insects (%)
Pesticide Use - Households using pesticides to kill weeds (%)
Physical Activity - People doing vigorous-intensity work activities (%)
Physical Activity - People doing moderate-intensity work activities (%)
Physical Activity - People walking or bicycling (%)
Physical Activity - People doing vigorous-intensity recreational activities (%)
Physical Activity - People doing moderate-intensity recreational activities (%)
Physical Activity - Average hours a day doing sedentary activities
Physical Activity - Average hours a day watching TV or videos
Physical Activity - Average hours a day using computer
Physical Functioning - People having limitations keeping them from working (%)
Physical Functioning - People limited in amount of work they can do (%)
Physical Functioning - People that need special equipment to walk (%)
Physical Functioning - People experiencing confusion/memory problems (%)
Physical Functioning - People requiring special healthcare equipment (%)
Prescription Medications - Average number of prescription medicines taking
Preventive Aspirin Use - Adults 40+ taking low-dose aspirin (%)
Reproductive Health - Vaginal deliveries (%)
Reproductive Health - Cesarean deliveries (%)
Reproductive Health - Deliveries resulted in a live birth (%)
Reproductive Health - Pregnancies resulted in a delivery (%)
Reproductive Health - Women breastfeeding newborns (%)
Reproductive Health - Women that had a hysterectomy (%)
Reproductive Health - Women that had both ovaries removed (%)
Reproductive Health - Women that have ever taken birth control pills (%)
Reproductive Health - Women taking birth control pills (%)
Reproductive Health - Women that have ever used Depo-Provera or injectables (%)
Reproductive Health - Women that have ever used female hormones (%)
Sexual Behavior - People 18+ that ever had sex (vaginal, anal, or oral) (%)
Sexual Behavior - Males 18+ that ever had vaginal sex with a woman (%)
Sexual Behavior - Males 18+ that ever performed oral sex on a woman (%)
Sexual Behavior - Males 18+ that ever had anal sex with a woman (%)
Sexual Behavior - Males 18+ that ever had any sex with a man (%)
Sexual Behavior - Females 18+ that ever had vaginal sex with a man (%)
Sexual Behavior - Females 18+ that ever performed oral sex on a man (%)
Sexual Behavior - Females 18+ that ever had anal sex with a man (%)
Sexual Behavior - Females 18+ that ever had any kind of sex with a woman (%)
Sexual Behavior - Average age people first had sex
Sexual Behavior - Average number of female sex partners in lifetime (males 18+)
Sexual Behavior - Average number of female vaginal sex partners in lifetime (males 18+)
Sexual Behavior - Average age people first performed oral sex on a woman (18+)
Sexual Behavior - Average number of woman performed oral sex on in lifetime (18+)
Sexual Behavior - Average number of male sex partners in lifetime (males 18+)
Sexual Behavior - Average number of male anal sex partners in lifetime (males 18+)
Sexual Behavior - Average age people first performed oral sex on a man (18+)
Sexual Behavior - Average number of male oral sex partners in lifetime (18+)
Sexual Behavior - People using protection when performing oral sex (%)
Sexual Behavior - Average number of times people have vaginal or anal sex a year
Sexual Behavior - People having sex without condom (%)
Sexual Behavior - Average number of male sex partners in lifetime (females 18+)
Sexual Behavior - Average number of male vaginal sex partners in lifetime (females 18+)
Sexual Behavior - Average number of female sex partners in lifetime (females 18+)
Sexual Behavior - Circumcised males 18+ (%)
Sleep Disorders - Average hours sleeping at night
Sleep Disorders - People that has trouble sleeping (%)
Smoking-Cigarette Use - People smoking cigarettes (%)
Taste & Smell - People 40+ having problems with smell (%)
Taste & Smell - People 40+ having problems with taste (%)
Taste & Smell - People 40+ that ever had wisdom teeth removed (%)
Taste & Smell - People 40+ that ever had tonsils teeth removed (%)
Taste & Smell - People 40+ that ever had a loss of consciousness because of a head injury (%)
Taste & Smell - People 40+ that ever had a broken nose or other serious injury to face or skull (%)
Taste & Smell - People 40+ that ever had two or more sinus infections (%)
Weight - Average height (inches)
Weight - Average weight (pounds)
Weight - Average BMI
Weight - People that are obese (%)
Weight - People that ever were obese (%)
Weight - People trying to lose weight (%)
100%
urban population.
Estimated median house/condo value in 2022: $168,357
44708:
$168,357Ohio:
$204,100
Median resident age: This zip code:
45.3 yearsOhio median age:
39.9 years
Average household size: This zip code:
2.2 peopleOhio:
2.4 people
Averages for the 2020 tax year for zip code 44708, filed in 2021:
Average Adjusted Gross Income (AGI) in 2020: $59,405 (Individual Income Tax Returns) Here:
$59,405State:
$67,288
Salary/wage: $47,043 (reported on 79.8% of returns )Here:
$47,043State:
$55,628
(% of AGI for various income ranges: 1148.9% for AGIs below $25k , 3373.3% for AGIs $25k-50k , 6050.8% for AGIs $50k-75k , 8680.7% for AGIs $75k-100k , 15661.5% for AGIs $100k-200k , 75167.3% for AGIs over 200k ) Taxable interest for individuals: $1,834 (reported on 25.4% of returns )This zip code:
$1,834Ohio:
$1,518
(% of AGI for various income ranges: 15.2% for AGIs below $25k , 18.6% for AGIs $25k-50k , 39.4% for AGIs $50k-75k , 66.8% for AGIs $75k-100k , 149.4% for AGIs $100k-200k , 2611.8% for AGIs over 200k ) Ordinary dividends: $8,864 (reported on 18.2% of returns )(% of AGI for various income ranges: 25.0% for AGIs below $25k , 42.0% for AGIs $25k-50k , 97.6% for AGIs $50k-75k , 190.9% for AGIs $75k-100k , 474.5% for AGIs $100k-200k , 11578.2% for AGIs over 200k ) Net capital gain/loss in AGI: +$13,090 (reported on 15.9% of returns )Here:
+$13,090State:
+$18,919
(% of AGI for various income ranges: 8.4% for AGIs below $25k , 27.5% for AGIs $25k-50k , 79.1% for AGIs $50k-75k , 181.2% for AGIs $75k-100k , 668.3% for AGIs $100k-200k , 17000.0% for AGIs over 200k ) Profit/loss from business: +$12,755 (reported on 13.2% of returns )Here:
+$12,755State:
+$13,744
(% of AGI for various income ranges: 86.6% for AGIs below $25k , 98.9% for AGIs $25k-50k , 159.3% for AGIs $50k-75k , 259.2% for AGIs $75k-100k , 715.1% for AGIs $100k-200k , 6065.5% for AGIs over 200k ) Taxable individual retirement arrangement distribution: $16,241 (reported on 11.6% of returns )44708:
$16,241Ohio:
$18,876
(% of AGI for various income ranges: 67.3% for AGIs below $25k , 117.7% for AGIs $25k-50k , 296.9% for AGIs $50k-75k , 534.1% for AGIs $75k-100k , 839.4% for AGIs $100k-200k , 3935.5% for AGIs over 200k ) Self-employed (Keogh) retirement plans: $19,975 (reported on 0.3% of returns )44708:
$19,975Ohio:
$24,898
(% of AGI for various income ranges: 20.5% for AGIs $50k-75k , 448.2% for AGIs over 200k ) Total itemized deductions: $36,174 (reported on 4.1% of returns )Here:
$36,174State:
$33,869
(% of AGI for various income ranges: 29.5% for AGIs below $25k , 76.5% for AGIs $25k-50k , 145.3% for AGIs $50k-75k , 227.3% for AGIs $75k-100k , 615.6% for AGIs $100k-200k , 7265.5% for AGIs over 200k ) Charity contributions: $15,807 (reported on 3.4% of returns )Here:
$15,807State:
$14,577
(% of AGI for various income ranges: 2.8% for AGIs below $25k , 9.6% for AGIs $25k-50k , 30.5% for AGIs $50k-75k , 48.3% for AGIs $75k-100k , 202.5% for AGIs $100k-200k , 4067.3% for AGIs over 200k ) Taxes paid: $7,063 (reported on 4.1% of returns )(% of AGI for various income ranges: 3.8% for AGIs below $25k , 10.6% for AGIs $25k-50k , 32.1% for AGIs $50k-75k , 53.7% for AGIs $75k-100k , 164.4% for AGIs $100k-200k , 1198.2% for AGIs over 200k ) Earned income credit: $2,280 (reported on 15.8% of returns )(% of AGI for various income ranges: 92.6% for AGIs below $25k , 53.1% for AGIs $25k-50k , 1.1% for AGIs $50k-75k ) Percentage of individuals using paid preparers for their 2020 taxes: 93.9%(% for various income ranges: 93.3% for AGIs below $25k , 94.5% for AGIs $25k-50k , 93.8% for AGIs $50k-75k , 95.4% for AGIs $75k-100k , 94.2% for AGIs $100k-200k , 91.7% for AGIs over 200k )
Averages for the 2012 tax year for zip code 44708, filed in 2013:
Average Adjusted Gross Income (AGI) in 2012: $52,383 (Individual Income Tax Returns) Here:
$52,383State:
$54,926
Salary/wage: $43,737 (reported on 80.7% of returns )Here:
$43,737State:
$45,869
(% of AGI for various income ranges: 70.3% for AGIs below $25k , 75.0% for AGIs $25k-50k , 74.3% for AGIs $50k-75k , 73.6% for AGIs $75k-100k , 71.1% for AGIs $100k-200k , 49.6% for AGIs over 200k ) Taxable interest for individuals: $1,341 (reported on 33.6% of returns )This zip code:
$1,341Ohio:
$1,297
(% of AGI for various income ranges: 1.2% for AGIs below $25k , 0.7% for AGIs $25k-50k , 0.6% for AGIs $50k-75k , 0.9% for AGIs $75k-100k , 0.7% for AGIs $100k-200k , 1.1% for AGIs over 200k ) Ordinary dividends: $6,972 (reported on 21.2% of returns )(% of AGI for various income ranges: 1.9% for AGIs below $25k , 1.3% for AGIs $25k-50k , 1.3% for AGIs $50k-75k , 1.9% for AGIs $75k-100k , 2.7% for AGIs $100k-200k , 6.0% for AGIs over 200k ) Net capital gain/loss in AGI: +$8,856 (reported on 16.0% of returns )Here:
+$8,856State:
+$11,232
(% of AGI for various income ranges: 0.5% for AGIs $50k-75k , 0.7% for AGIs $75k-100k , 2.4% for AGIs $100k-200k , 8.9% for AGIs over 200k ) Profit/loss from business: +$14,302 (reported on 12.0% of returns )Here:
+$14,302State:
+$12,773
(% of AGI for various income ranges: 5.6% for AGIs below $25k , 2.3% for AGIs $25k-50k , 2.2% for AGIs $50k-75k , 3.3% for AGIs $75k-100k , 3.7% for AGIs $100k-200k , 3.6% for AGIs over 200k ) Taxable individual retirement arrangement distribution: $13,859 (reported on 13.2% of returns )44708:
$13,859Ohio:
$14,511
(% of AGI for various income ranges: 4.3% for AGIs below $25k , 3.1% for AGIs $25k-50k , 3.0% for AGIs $50k-75k , 3.5% for AGIs $75k-100k , 4.0% for AGIs $100k-200k , 3.5% for AGIs over 200k ) Self-employment retirement plans: $28,880 (reported on 0.4% of returns )44708:
$28,880Ohio:
$20,257
(% of AGI for various income ranges: 1.3% for AGIs $100k-200k ) Total itemized deductions: $20,901 (19% of AGI, reported on 26.2% of returns )Here:
$20,901State:
$21,278
Here:
18.6% of AGIState:
18.8% of AGI
(% of AGI for various income ranges: 6.9% for AGIs below $25k , 8.0% for AGIs $25k-50k , 9.6% for AGIs $50k-75k , 11.1% for AGIs $75k-100k , 12.5% for AGIs $100k-200k , 12.6% for AGIs over 200k ) Charity contributions: $4,124 (reported on 20.7% of returns )(% of AGI for various income ranges: 0.6% for AGIs below $25k , 0.9% for AGIs $25k-50k , 1.3% for AGIs $50k-75k , 1.9% for AGIs $75k-100k , 2.0% for AGIs $100k-200k , 2.3% for AGIs over 200k ) Taxes paid: $8,866 (reported on 26.0% of returns )(% of AGI for various income ranges: 1.2% for AGIs below $25k , 2.3% for AGIs $25k-50k , 3.1% for AGIs $50k-75k , 4.0% for AGIs $75k-100k , 6.5% for AGIs $100k-200k , 7.1% for AGIs over 200k ) Earned income credit: $2,125 (reported on 17.2% of returns )(% of AGI for various income ranges: 5.7% for AGIs below $25k , 0.7% for AGIs $25k-50k ) Percentage of individuals using paid preparers for their 2012 taxes: 53.8%(% for various income ranges: 48.7% for AGIs below $25k , 53.2% for AGIs $25k-50k , 58.2% for AGIs $50k-75k , 59.2% for AGIs $75k-100k , 62.8% for AGIs $100k-200k , 84.6% for AGIs over 200k )
Averages for the 2004 tax year for zip code 44708, filed in 2005:
Average Adjusted Gross Income (AGI) in 2004: $43,268 (Individual Income Tax Returns) Here:
$43,268State:
$44,480
Salary/wage: $37,870 (reported on 80.5% of returns )Here:
$37,870State:
$39,198
(% of AGI for various income ranges: 121.1% for AGIs below $10k , 67.4% for AGIs $10k-25k , 76.9% for AGIs $25k-50k , 78.0% for AGIs $50k-75k , 77.1% for AGIs $75k-100k , 57.2% for AGIs over 100k ) Taxable interest for individuals: $1,901 (reported on 47.6% of returns )This zip code:
$1,901Ohio:
$1,532
(% of AGI for various income ranges: 11.0% for AGIs below $10k , 3.3% for AGIs $10k-25k , 1.7% for AGIs $25k-50k , 1.6% for AGIs $50k-75k , 1.3% for AGIs $75k-100k , 2.2% for AGIs over 100k ) Taxable dividends: $4,152 (reported on 28.1% of returns )(% of AGI for various income ranges: 9.5% for AGIs below $10k , 2.2% for AGIs $10k-25k , 1.2% for AGIs $25k-50k , 1.6% for AGIs $50k-75k , 1.5% for AGIs $75k-100k , 4.8% for AGIs over 100k ) Net capital gain/loss: +$8,429 (reported on 21.6% of returns )Here:
+$8,429State:
+$8,582
(% of AGI for various income ranges: 0.6% for AGIs below $10k , 0.9% for AGIs $10k-25k , 0.6% for AGIs $25k-50k , 1.0% for AGIs $50k-75k , 2.0% for AGIs $75k-100k , 11.2% for AGIs over 100k ) Profit/loss from business: +$11,952 (reported on 12.1% of returns )Here:
+$11,952State:
+$10,813
(% of AGI for various income ranges: 7.0% for AGIs below $10k , 3.1% for AGIs $10k-25k , 2.3% for AGIs $25k-50k , 2.4% for AGIs $50k-75k , 4.2% for AGIs $75k-100k , 4.3% for AGIs over 100k ) IRA payment deduction: $2,737 (reported on 2.2% of returns )(% of AGI for various income ranges: 0.5% for AGIs below $10k , 0.2% for AGIs $10k-25k , 0.1% for AGIs $25k-50k , 0.2% for AGIs $50k-75k , 0.2% for AGIs $75k-100k , 0.1% for AGIs over 100k ) Self-employed pension: $11,675 (reported on 0.6% of returns )(% of AGI for various income ranges: 0.0% for AGIs $25k-50k , 0.1% for AGIs $50k-75k , 0.3% for AGIs $75k-100k , 0.3% for AGIs over 100k ) Total itemized deductions: $16,352 (20% of AGI, reported on 31.4% of returns )Here:
$16,352State:
$17,503
Here:
19.8% of AGIState:
20.8% of AGI
(% of AGI for various income ranges: 11.0% for AGIs below $10k , 9.6% for AGIs $10k-25k , 10.5% for AGIs $25k-50k , 12.0% for AGIs $50k-75k , 13.9% for AGIs $75k-100k , 12.8% for AGIs over 100k ) Charity contributions deductions: $3,093 (3% of AGI, reported on 27.0% of returns )Here:
3.5% of AGIState:
3.4% of AGI
(% of AGI for various income ranges: 0.9% for AGIs below $10k , 1.0% for AGIs $10k-25k , 1.2% for AGIs $25k-50k , 1.8% for AGIs $50k-75k , 2.2% for AGIs $75k-100k , 2.8% for AGIs over 100k ) Total tax: $6,662 (reported on 77.8% of returns )(% of AGI for various income ranges: 3.0% for AGIs below $10k , 4.3% for AGIs $10k-25k , 7.6% for AGIs $25k-50k , 9.3% for AGIs $50k-75k , 11.0% for AGIs $75k-100k , 20.3% for AGIs over 100k ) Earned income credit: $1,612 (reported on 11.8% of returns )Percentage of individuals using paid preparers for their 2004 taxes: 57.3%(% for various income ranges: 49.9% for AGIs below $10k , 57.7% for AGIs $10k-25k , 58.5% for AGIs $25k-50k , 58.2% for AGIs $50k-75k , 58.8% for AGIs $75k-100k , 70.3% for AGIs over 100k )
Estimated median household income in 2022: This zip code:
$57,646Ohio:
$65,720
Nearest zip codes: 44710 ,
44718 ,
44703 ,
44709 ,
44646 ,
44702 .
Perry Heights Zip Code Map
Percentage of family households: This zip code:
39.3%Ohio:
43.3%
Percentage of households with unmarried partners: This zip code:
8.3%Ohio:
44.6%
Likely homosexual households (counted as self-reported same-sex unmarried-partner households)
Lesbian couples: 0.1% of all households Gay men: 0.4% of all households
Household received Food Stamps/SNAP in the past 12 months: 1,282Household did not receive Food Stamps/SNAP in the past 12 months: 9,788
Women who had a birth in the past 12 months: 260 (165 now married , 94 unmarried) Women who did not have a birth in the past 12 months: 4,660 (1,790 now married , 2,869 unmarried)
Housing units in zip code 44708 with a mortgage: 4,644 (505
second mortgage , 17
home equity loan , 473
both second mortgage and home equity loan )
Houses without a mortgage: 232
Median monthly owner costs for units with a mortgage: $1,197
Median monthly owner costs for units without a mortgage: $481
Residents with income below the poverty level in 2022:
This zip code:
11.3%Whole state:
13.4%
Residents with income below 50% of the poverty level in 2022:
This zip code:
5.1%Whole state:
7.0%
Median number of rooms in houses and condos: Median number of rooms in apartments: Notable locations in this zip code not listed on our city pages
Click to draw/clear zip code borders Notable locations in zip code 44708: (A) , Fawcett Stadium (B) , Stark County Fairgrounds (C) , Tam O'Shanter Golf Course (D) , Plain Township Fire Department Station 3 (E) , Canton Fire Department Station 5 (F) , Canton Township Fire Department Station 3 (G) , C T Branin Natatorium (H) , McKinley Monument Historical Center (I) , McKinley Monument Historical Society Planetarium (J) , National Pro Football Hall of Fame (K) . Display/hide their locations on the map
Shopping Centers: (1) , County Fair Shopping Center (2) . Display/hide their locations on the map
Churches in zip code 44708 include: (A) , First Evangelical United Brethren Church (B) , Saint Josephs Catholic Church (C) , Bethel Lutheran Church (D) , Lowell United Church of Christ (E) , Calvary Baptist Church (F) , Westminster Presbyterian Church (G) , Zion United Methodist Church (H) , Reedurban Community Church (I) . Display/hide their locations on the map
Cemetery: (1) . Display/hide its location on the map
Lakes and reservoirs: (A) , Spring Valley Lake (B) , Sippo Lake (C) . Display/hide their locations on the map
Parks in zip code 44708 include: (1) , Water Works Park (2) , Don Scott Field (3) , Grove Miller Park (4) , Sippo Lake Regional Park (5) , Westbrook Park (6) , McKinley Memorial Park (7) , Lawrence Playground (8) . Display/hide their locations on the map
Year house built (houses)
0 2020 or later351 2010 to 2019794 2000 to 2009975 1990 to 1999960 1980 to 19891,284 1970 to 19791,052 1960 to 19692,718 1950 to 19591,009 1940 to 19492,715 1939 or earlier
Zip code 44708 household income distribution in 2022 655 Less than $10,000361 $10,000 to $14,999386 $15,000 to $19,999750 $20,000 to $24,999589 $25,000 to $29,999426 $30,000 to $34,999452 $35,000 to $39,999382 $40,000 to $44,999562 $45,000 to $49,9991,110 $50,000 to $59,9991,208 $60,000 to $74,9991,257 $75,000 to $99,9991,041 $100,000 to $124,999578 $125,000 to $149,999673 $150,000 to $199,999616 $200,000 or moreEstimate of home value of owner-occupied houses/condos in 2022 in zip code 44708 63 Less than $10,00067 $10,000 to $14,99998 $15,000 to $19,999197 $20,000 to $24,99929 $25,000 to $29,999110 $30,000 to $34,99915 $35,000 to $39,99976 $40,000 to $49,999161 $50,000 to $59,999125 $60,000 to $69,999119 $70,000 to $79,999165 $80,000 to $89,999261 $90,000 to $99,999806 $100,000 to $124,9991,035 $125,000 to $149,999932 $150,000 to $174,999616 $175,000 to $199,999828 $200,000 to $249,999612 $250,000 to $299,999597 $300,000 to $399,999201 $400,000 to $499,999228 $500,000 to $749,999110 $750,000 to $999,99955 $1,000,000 to $1,499,9993 $2,000,000 or moreRent paid by renters in 2022 in zip code 44708 10 Less than $10034 $150 to $19945 $300 to $34929 $350 to $39958 $400 to $449117 $450 to $499315 $500 to $549268 $550 to $599189 $600 to $649392 $650 to $699337 $700 to $749127 $750 to $799189 $800 to $899124 $900 to $999365 $1,000 to $1,249255 $1,250 to $1,49934 $1,500 to $1,99916 $2,000 to $2,4999 $2,500 to $2,99993 $3,500 or more139 No cash rent
Median gross rent in 2022: $914.
Median price asked for vacant for-sale houses and condos in 2022: $101,403.
Estimated median house (or condo) value in 2022 for: White Non-Hispanic householders: $165,703Black or African American householders: $172,172American Indian or Alaska Native householders: $107,815Asian householders: $325,767Some other race householders: $97,531Two or more races householders: $136,510Hispanic or Latino householders: $197,052Estimated median house or condo value in 2022: $168,357
44708:
$168,357Ohio:
$204,100
Lower value quartile - upper value quartile: $115,898 - $251,299
Mean price in 2022: Detached houses: $225,725Here:
$225,725State:
$254,366
Townhouses or other attached units: $195,403Here:
$195,403State:
$225,733
In 2-unit structures: $48,212Here:
$48,212State:
$144,384
In 3-to-4-unit structures: $194,442Here:
$194,442State:
$203,002
In 5-or-more-unit structures: $89,351Here:
$89,351State:
$211,593
Mobile homes: $51,383Here:
$51,383State:
$62,719
Housing units in structures:
One, detached: 8,182One, attached: 871Two: 9993 or 4: 5895 to 9: 57510 to 19: 24820 to 49: 14250 or more: 387Mobile homes: 51Unemployment : 2.7%
Means of transportation to work in zip code 44708 77.8% 9,409 Drove a car alone7.7% 930 Carpooled0.0% 5 Bus or trolley bus0.1% 9 Bicycle1.3% 159 Walked1.5% 177 Other means11.1% 1,345 Worked at homeTravel time to work (commute) in zip code 44708 473 Less than 5 minutes1,391 5 to 9 minutes2,388 10 to 14 minutes2,328 15 to 19 minutes1,657 20 to 24 minutes526 25 to 29 minutes908 30 to 34 minutes195 35 to 39 minutes198 40 to 44 minutes397 45 to 59 minutes153 60 to 89 minutes61 90 or more minutes
Neighborhoods in zip code 44708: Percentage of zip code residents living and working in this county: 82.4%
Household type by relationship:
Households: 24,818
Male householders: 5,260 (1,639 living alone ), Female householders: 5,816 (2,165 living alone )4,523 spouses (4,482 opposite-sex spouses ), 941 unmarried partners , (839 opposite-sex unmarried partners ), 6,289 children (5,890 natural , 281 adopted , 131 stepchildren ), 420 grandchildren , 198 brothers or sisters , 358 parents , 69 foster children , 202 other relatives , 495 non-relatives In group quarters: 291 (-1 institutionalized population )
Size of family households: 3,515 2-persons , 1,347 3-persons , 1,037 4-persons , 440 5-persons , 192 6-persons , 86 7-or-more-persons
Size of nonfamily households: 3,806 1-person , 633 2-persons , 20 3-persons
2,571 married couples with children. single-parent households (512 men , 1,383 women ).
94.9% of residents of 44708 zip code speak English at home. of residents speak Spanish at home (74% very well, 18% well, 8% not at all ).of residents speak other Indo-European language at home (68% very well, 23% well, 8% not well, 1% not at all ).of residents speak Asian or Pacific Island language at home (82% very well, 18% well ).of residents speak other language at home (62% very well, 32% well, 6% not at all ).
Foreign born population: 1,071 (4.3%)
(65.8%
of them are naturalized citizens )
This zip code:
4.3%Whole state:
5.0%
27% Bhutan 12% Malaysia 9% Japan 6% Honduras 6% Poland 4% United Kingdom, excluding England and Scotland 4% Sweden 17% German 13% European 12% English 10% Italian 5% American 5% Irish 4% African
Year of entry for the foreign-born population
375 2010 or later 66 2000 to 2009 268 1990 to 1999 398 Before 1990
There are
386 Other Medical Specialists in Zip Code 44708.
Facilities with environmental interests located in this zip code:
BP OIL NO 5048 (2211 W TUSCARAWAS in CANTON, OH)
STATE MASTER (Ohio general info) - AIR MAJOR, -76-5541-168-13, EPCRA, RCRA-OHD987036779, HAZARDOUS WASTE PROGRAM Conditionally Exempt Small Quantity Generators, less than 100 kg/month of hazardous waste (Resource Conservation and Recovery Act (tracking hazardous waste)) - notification Organizations: BP OIL CO (CONTACT/OWNER)
, BP OIL COMPANY (CONTACT/OWNER)
Alternative names: BP OIL CO SITE 5048
CENTRAL CATHOLIC HIGH SCHOOL (4824 W TUSCARAWAS ST in CANTON, OH)
STATE MASTER (Ohio general info) - AIR MAJOR, RCRA-OHR000029637, HAZARDOUS WASTE PROGRAM Small Quantity Generators, between 100 kg and 1000 kg of hazardous waste/month (Resource Conservation and Recovery Act (tracking hazardous waste)) - notification Organizations: CANTON CENTRAL CATHOLIC HIGH SCHOOL (CONTACT/OWNER)
, CANTON CENTRAL CATHOLIC HIGH S (CONTACT/OWNER)
Alternative names: CANTON CENTRAL CATHOLIC HIGH SCHOOL
AVONDALE ELEMENTARY SCHOOL (3933 EATON RD NW in CANTON, OH)
(Geographic Names Information System) (National Center for Education Statistics) - STATE ID-001404 Organizations: PLAIN LOCAL SD (SCHOOL DISTRICT)
ASBESTOS MANAGEMENT INC (125 VALLEYVIEW AVE NORTHWEST in CANTON, OH)
COMPLIANCE ACTIVITY (Tracking inspections of insecticide, fungicide, and rodenticide, and toxic substances)
Housing units lacking complete plumbing facilities: 0.5%
Housing units lacking complete kitchen facilities: 2.2%
86.0% Utility gas 13.0% Electricity 1.0% Bottled, tank, or LP gas
Population in 1990: 25,891.
Place of birth for U.S.-born residents:
This state: 20,038Northeast: 744Midwest: 696South: 1,658West: 534
63% of the 44708 zip code residents lived in the same house 5 years ago.
Out of people who lived in different houses, 77% lived in this county.
Out of people who lived in different counties, 50% lived in Ohio.
85% of the 44708 zip code residents lived in the same house 1 year ago.
Out of people who lived in different houses, 70% moved from this county.
Out of people who lived in different houses, 9% moved from different county within same state.
Out of people who lived in different houses, 11% moved from different state.
Out of people who lived in different houses, 6% moved from abroad.
Private vs. public school enrollment:
Students in private schools in grades 1 to 8 (elementary and middle school): 316
Students in private schools in grades 9 to 12 (high school): 140
Students in private undergraduate colleges: 76
Occupation by median earnings in the past 12 months ($)
91,428 Legal occupations 81,810 Architecture and engineering occupations 69,465 Computer and mathematical occupations 65,706 Health diagnosing and treating practitioners and other technical occupations 59,378 Management occupations 55,683 Transportation occupations
Companies with federal contracts located in this zip code:
STARK COUNTY BOARD OF MENTAL R (2950 WHIPPLE AVE NW in CANTON, OH) in 15 contracts from 2003 to 2006
Contracts for Custodial Janitorial Services by ArmySigned by year: 2000: $0; 2001: $0; 2002: $0; 2003: $23,626; 2004: $25,500; 2005: $27,500; 2006: $6,875.
Biggest contracts: with Army for Custodial Janitorial Services. Signed on 2005-03-01. Completion date: 2006-02-28.
, same as above. Signed on 2004-03-01. Completion date: 2005-02-28.
, same as above. Signed on 2003-05-27. Completion date: 2004-02-28.
, same as above. Signed on 2005-03-01. Completion date: 2006-02-28.
Top industries in this zip code by the number of employees in 2005:
Health Care and Social Assistance: General Medical and Surgical Hospitals (over 1000 employees: 1 establishment)Health Care and Social Assistance: Offices of Physicians (except Mental Health Specialists) (100-249: 2, 50-99: 2, 20-49: 9, 10-19: 9, 5-9: 14, 1-4: 21)Accommodation and Food Services: Full-Service Restaurants (100-249: 1, 50-99: 4, 20-49: 7, 10-19: 5, 5-9: 3, 1-4: 4)Accommodation and Food Services: Limited-Service Restaurants (50-99: 3, 20-49: 8, 10-19: 4, 5-9: 4, 1-4: 6)Health Care and Social Assistance: Home Health Care Services (100-249: 2, 50-99: 1)Other Services (except Public Administration): Religious Organizations (50-99: 2, 20-49: 5, 5-9: 5, 1-4: 4)Health Care and Social Assistance: Nursing Care Facilities (100-249: 1, 50-99: 1)
People in group quarters in 2010:
218 people in nursing facilities/skilled-nursing facilities
21 people in group homes intended for adults
14 people in correctional residential facilities
3 people in residential treatment centers for adults
People in group quarters in 2000:
252 people in nursing homes
16 people in homes for the mentally retarded
11 people in other noninstitutional group quarters
2 people in religious group quarters
Fatal accident statistics in 2014:
Fatal accident count: 3Vehicles involved in fatal accidents: 4Fatal accidents caused by drunken drivers: 0Fatalities: 3Persons involved in fatal accidents: 3Pedestrians involved in fatal accidents: 1
Fatal accident statistics in 2012:
Fatal accident count: 4Vehicles involved in fatal accidents: 6Fatal accidents caused by drunken drivers: 1Fatalities: 5Persons involved in fatal accidents: 13Pedestrians involved in fatal accidents: 1
Home Mortgage Disclosure Act Aggregated Statistics For Year 2009(Based on 5 full and 12 partial tracts) A) FHA, FSA/RHS & VA B) Conventional C) Refinancings D) Home Improvement Loans E) Loans on Dwellings For 5+ Families F) Non-occupant Loans on G) Loans On Manufactured Number Average Value Number Average Value Number Average Value Number Average Value Number Average Value Number Average Value Number Average Value
LOANS ORIGINATED 254 $94,572 156 $116,562 576 $120,591 61 $24,959 1 $195,000 40 $80,860 0 $0 APPLICATIONS APPROVED, NOT ACCEPTED 8 $87,770 13 $129,550 70 $107,449 6 $30,783 0 $0 8 $58,924 1 $32,980 APPLICATIONS DENIED 24 $97,712 15 $75,789 312 $110,766 41 $22,740 1 $200,000 16 $57,302 0 $0 APPLICATIONS WITHDRAWN 15 $76,732 19 $106,126 149 $114,292 7 $55,527 0 $0 16 $84,966 0 $0 FILES CLOSED FOR INCOMPLETENESS 3 $75,393 2 $87,410 39 $124,213 2 $16,095 0 $0 1 $107,160 1 $96,000
Aggregated Statistics For Year 2008(Based on 5 full and 12 partial tracts) A) FHA, FSA/RHS & VA B) Conventional C) Refinancings D) Home Improvement Loans F) Non-occupant Loans on G) Loans On Manufactured Number Average Value Number Average Value Number Average Value Number Average Value Number Average Value Number Average Value
LOANS ORIGINATED 189 $102,105 270 $104,379 342 $105,527 101 $20,562 98 $76,698 0 $0 APPLICATIONS APPROVED, NOT ACCEPTED 12 $84,357 28 $106,175 83 $85,369 17 $27,581 7 $43,203 1 $14,110 APPLICATIONS DENIED 25 $77,782 58 $88,483 351 $110,381 125 $31,672 24 $81,378 11 $51,361 APPLICATIONS WITHDRAWN 12 $87,967 18 $127,129 101 $111,429 11 $71,693 9 $79,133 0 $0 FILES CLOSED FOR INCOMPLETENESS 2 $126,125 8 $80,404 24 $127,666 3 $21,653 6 $59,388 0 $0
Aggregated Statistics For Year 2007(Based on 5 full and 12 partial tracts) A) FHA, FSA/RHS & VA B) Conventional C) Refinancings D) Home Improvement Loans E) Loans on Dwellings For 5+ Families F) Non-occupant Loans on G) Loans On Manufactured Number Average Value Number Average Value Number Average Value Number Average Value Number Average Value Number Average Value Number Average Value
LOANS ORIGINATED 109 $103,998 476 $104,330 555 $102,451 90 $27,882 4 $380,045 130 $63,037 1 $105,370 APPLICATIONS APPROVED, NOT ACCEPTED 2 $71,030 23 $86,446 146 $98,043 12 $74,852 0 $0 11 $73,631 3 $59,357 APPLICATIONS DENIED 14 $103,744 76 $115,287 602 $107,879 160 $51,346 1 $572,530 78 $67,169 7 $56,209 APPLICATIONS WITHDRAWN 3 $87,403 39 $88,393 169 $142,714 19 $41,137 0 $0 26 $81,625 0 $0 FILES CLOSED FOR INCOMPLETENESS 0 $0 11 $103,428 72 $150,249 1 $9,410 0 $0 2 $129,590 0 $0
Aggregated Statistics For Year 2006(Based on 5 full and 12 partial tracts) A) FHA, FSA/RHS & VA B) Conventional C) Refinancings D) Home Improvement Loans E) Loans on Dwellings For 5+ Families F) Non-occupant Loans on G) Loans On Manufactured Number Average Value Number Average Value Number Average Value Number Average Value Number Average Value Number Average Value Number Average Value
LOANS ORIGINATED 99 $97,924 648 $91,851 790 $92,919 114 $39,046 2 $295,315 186 $72,270 0 $0 APPLICATIONS APPROVED, NOT ACCEPTED 4 $86,095 81 $82,510 206 $85,630 19 $31,652 0 $0 26 $76,902 2 $31,475 APPLICATIONS DENIED 6 $93,975 139 $86,326 710 $96,337 196 $36,394 0 $0 61 $61,261 3 $73,953 APPLICATIONS WITHDRAWN 6 $125,640 63 $87,948 295 $101,705 37 $39,997 0 $0 18 $53,346 0 $0 FILES CLOSED FOR INCOMPLETENESS 3 $112,650 17 $72,385 110 $113,030 2 $80,270 0 $0 6 $67,668 0 $0
Aggregated Statistics For Year 2005(Based on 5 full and 12 partial tracts) A) FHA, FSA/RHS & VA B) Conventional C) Refinancings D) Home Improvement Loans E) Loans on Dwellings For 5+ Families F) Non-occupant Loans on G) Loans On Manufactured Number Average Value Number Average Value Number Average Value Number Average Value Number Average Value Number Average Value Number Average Value
LOANS ORIGINATED 89 $90,687 669 $92,633 943 $98,537 102 $56,222 0 $0 251 $71,883 1 $42,070 APPLICATIONS APPROVED, NOT ACCEPTED 0 $0 118 $76,214 250 $86,225 29 $71,038 0 $0 30 $70,424 5 $28,124 APPLICATIONS DENIED 4 $109,232 171 $72,986 735 $99,330 143 $45,610 4 $1,239,605 46 $62,271 6 $51,067 APPLICATIONS WITHDRAWN 5 $70,582 104 $94,759 509 $104,169 68 $120,996 0 $0 37 $85,145 2 $45,930 FILES CLOSED FOR INCOMPLETENESS 3 $59,423 26 $83,780 100 $96,996 6 $67,110 1 $165,000 9 $62,044 0 $0
Aggregated Statistics For Year 2004(Based on 5 full and 12 partial tracts) A) FHA, FSA/RHS & VA B) Conventional C) Refinancings D) Home Improvement Loans E) Loans on Dwellings For 5+ Families F) Non-occupant Loans on G) Loans On Manufactured Number Average Value Number Average Value Number Average Value Number Average Value Number Average Value Number Average Value Number Average Value
LOANS ORIGINATED 110 $97,773 666 $99,189 1,107 $93,974 123 $41,447 3 $203,190 209 $72,153 1 $87,190 APPLICATIONS APPROVED, NOT ACCEPTED 11 $101,000 81 $83,859 216 $91,171 29 $45,790 0 $0 36 $59,821 0 $0 APPLICATIONS DENIED 10 $78,378 141 $87,958 734 $87,327 137 $39,826 0 $0 58 $82,666 5 $48,744 APPLICATIONS WITHDRAWN 4 $81,960 44 $103,155 397 $97,100 19 $63,842 0 $0 21 $100,766 1 $60,400 FILES CLOSED FOR INCOMPLETENESS 4 $56,715 24 $94,100 106 $85,049 3 $116,477 0 $0 16 $63,769 0 $0
Aggregated Statistics For Year 2003(Based on 5 full and 12 partial tracts) A) FHA, FSA/RHS & VA B) Conventional C) Refinancings D) Home Improvement Loans E) Loans on Dwellings For 5+ Families F) Non-occupant Loans on Number Average Value Number Average Value Number Average Value Number Average Value Number Average Value Number Average Value
LOANS ORIGINATED 133 $97,064 636 $95,467 2,113 $98,185 98 $22,882 3 $461,043 231 $70,690 APPLICATIONS APPROVED, NOT ACCEPTED 6 $80,873 39 $73,985 345 $91,203 29 $26,722 0 $0 37 $65,898 APPLICATIONS DENIED 11 $81,686 87 $75,762 727 $91,176 121 $18,078 0 $0 59 $51,650 APPLICATIONS WITHDRAWN 10 $86,687 51 $86,426 488 $104,589 15 $22,400 0 $0 36 $64,416 FILES CLOSED FOR INCOMPLETENESS 0 $0 14 $72,756 122 $101,366 7 $28,033 0 $0 4 $65,442
Aggregated Statistics For Year 2002(Based on 5 full and 8 partial tracts) A) FHA, FSA/RHS & VA B) Conventional C) Refinancings D) Home Improvement Loans E) Loans on Dwellings For 5+ Families F) Non-occupant Loans on Number Average Value Number Average Value Number Average Value Number Average Value Number Average Value Number Average Value
LOANS ORIGINATED 126 $86,565 595 $95,094 1,508 $93,592 74 $16,877 5 $260,946 197 $62,173 APPLICATIONS APPROVED, NOT ACCEPTED 3 $115,263 36 $72,749 244 $97,919 27 $17,569 0 $0 17 $60,925 APPLICATIONS DENIED 8 $94,998 44 $70,846 603 $83,377 118 $13,383 0 $0 41 $56,724 APPLICATIONS WITHDRAWN 5 $73,444 40 $77,960 323 $91,402 19 $23,822 0 $0 17 $70,784 FILES CLOSED FOR INCOMPLETENESS 2 $73,890 11 $61,662 103 $84,362 6 $55,582 0 $0 6 $55,638
Aggregated Statistics For Year 2001(Based on 5 full and 8 partial tracts) A) FHA, FSA/RHS & VA B) Conventional C) Refinancings D) Home Improvement Loans E) Loans on Dwellings For 5+ Families F) Non-occupant Loans on Number Average Value Number Average Value Number Average Value Number Average Value Number Average Value Number Average Value
LOANS ORIGINATED 160 $85,762 475 $90,897 1,385 $85,294 123 $19,810 1 $980,000 147 $70,364 APPLICATIONS APPROVED, NOT ACCEPTED 5 $62,220 39 $58,686 257 $78,331 43 $18,512 0 $0 16 $65,875 APPLICATIONS DENIED 16 $82,411 64 $68,760 677 $75,378 156 $12,416 0 $0 29 $56,544 APPLICATIONS WITHDRAWN 7 $80,499 27 $100,503 360 $90,300 22 $25,147 0 $0 14 $57,686 FILES CLOSED FOR INCOMPLETENESS 0 $0 12 $57,847 88 $94,084 2 $30,500 0 $0 7 $61,571
Aggregated Statistics For Year 2000(Based on 5 full and 8 partial tracts) A) FHA, FSA/RHS & VA B) Conventional C) Refinancings D) Home Improvement Loans E) Loans on Dwellings For 5+ Families F) Non-occupant Loans on Number Average Value Number Average Value Number Average Value Number Average Value Number Average Value Number Average Value
LOANS ORIGINATED 110 $77,419 461 $89,366 493 $65,666 119 $13,545 6 $335,910 77 $58,188 APPLICATIONS APPROVED, NOT ACCEPTED 7 $62,246 55 $80,613 161 $58,246 63 $18,024 0 $0 16 $54,786 APPLICATIONS DENIED 6 $82,598 105 $58,228 439 $62,200 132 $11,725 0 $0 32 $46,977 APPLICATIONS WITHDRAWN 14 $78,904 37 $76,157 198 $61,661 21 $25,762 0 $0 17 $51,344 FILES CLOSED FOR INCOMPLETENESS 0 $0 12 $102,055 63 $77,047 5 $19,288 0 $0 2 $45,755
Aggregated Statistics For Year 1999(Based on 3 full and 4 partial tracts) A) FHA, FSA/RHS & VA B) Conventional C) Refinancings D) Home Improvement Loans F) Non-occupant Loans on Number Average Value Number Average Value Number Average Value Number Average Value Number Average Value
LOANS ORIGINATED 90 $75,570 262 $76,860 476 $70,231 91 $18,834 72 $60,415 APPLICATIONS APPROVED, NOT ACCEPTED 3 $49,847 24 $61,328 147 $64,506 35 $9,771 11 $42,656 APPLICATIONS DENIED 8 $73,835 40 $64,341 253 $62,802 88 $12,663 20 $54,136 APPLICATIONS WITHDRAWN 5 $78,834 26 $81,344 159 $63,796 13 $51,098 11 $51,635 FILES CLOSED FOR INCOMPLETENESS 0 $0 8 $86,392 40 $72,532 1 $2,540 3 $76,550
Private Mortgage Insurance Companies Aggregated Statistics For Year 2009(Based on 3 full and 12 partial tracts) A) Conventional B) Refinancings Number Average Value Number Average Value
LOANS ORIGINATED 22 $109,072 19 $135,131 APPLICATIONS APPROVED, NOT ACCEPTED 4 $116,945 14 $141,519 APPLICATIONS DENIED 4 $180,640 9 $115,397 APPLICATIONS WITHDRAWN 3 $125,887 6 $123,258 FILES CLOSED FOR INCOMPLETENESS 2 $145,580 0 $0
Aggregated Statistics For Year 2008(Based on 5 full and 12 partial tracts) A) Conventional B) Refinancings C) Non-occupant Loans on D) Loans On Manufactured Number Average Value Number Average Value Number Average Value Number Average Value
LOANS ORIGINATED 111 $110,294 28 $119,827 11 $58,060 0 $0 APPLICATIONS APPROVED, NOT ACCEPTED 32 $133,628 20 $131,631 4 $70,912 0 $0 APPLICATIONS DENIED 12 $91,668 4 $146,200 6 $84,600 2 $103,490 APPLICATIONS WITHDRAWN 4 $88,970 1 $114,780 0 $0 0 $0 FILES CLOSED FOR INCOMPLETENESS 7 $93,547 0 $0 5 $105,874 0 $0
Aggregated Statistics For Year 2007(Based on 5 full and 12 partial tracts) A) Conventional B) Refinancings C) Non-occupant Loans on Number Average Value Number Average Value Number Average Value
LOANS ORIGINATED 183 $105,144 58 $125,930 18 $66,012 APPLICATIONS APPROVED, NOT ACCEPTED 15 $112,745 27 $94,121 3 $81,080 APPLICATIONS DENIED 8 $164,138 2 $64,820 0 $0 APPLICATIONS WITHDRAWN 8 $76,761 6 $120,368 0 $0 FILES CLOSED FOR INCOMPLETENESS 0 $0 0 $0 0 $0
Aggregated Statistics For Year 2006(Based on 5 full and 12 partial tracts) A) Conventional B) Refinancings C) Non-occupant Loans on Number Average Value Number Average Value Number Average Value
LOANS ORIGINATED 161 $95,608 61 $111,320 18 $77,769 APPLICATIONS APPROVED, NOT ACCEPTED 16 $109,658 32 $107,528 4 $88,938 APPLICATIONS DENIED 1 $90,000 0 $0 0 $0 APPLICATIONS WITHDRAWN 2 $97,855 9 $185,693 2 $80,070 FILES CLOSED FOR INCOMPLETENESS 1 $139,080 1 $120,000 0 $0
Aggregated Statistics For Year 2005(Based on 5 full and 12 partial tracts) A) Conventional B) Refinancings C) Non-occupant Loans on Number Average Value Number Average Value Number Average Value
LOANS ORIGINATED 133 $94,231 81 $118,301 32 $64,216 APPLICATIONS APPROVED, NOT ACCEPTED 19 $74,645 31 $115,685 12 $54,207 APPLICATIONS DENIED 1 $195,750 2 $90,555 2 $90,555 APPLICATIONS WITHDRAWN 3 $113,437 12 $114,400 0 $0 FILES CLOSED FOR INCOMPLETENESS 0 $0 0 $0 0 $0
Aggregated Statistics For Year 2004(Based on 5 full and 12 partial tracts) A) Conventional B) Refinancings C) Non-occupant Loans on Number Average Value Number Average Value Number Average Value
LOANS ORIGINATED 143 $94,927 88 $98,559 31 $60,166 APPLICATIONS APPROVED, NOT ACCEPTED 19 $97,671 54 $99,571 8 $54,242 APPLICATIONS DENIED 1 $78,000 6 $95,093 1 $78,000 APPLICATIONS WITHDRAWN 7 $182,276 10 $121,160 0 $0 FILES CLOSED FOR INCOMPLETENESS 0 $0 1 $132,120 0 $0
Aggregated Statistics For Year 2003(Based on 5 full and 12 partial tracts) A) Conventional B) Refinancings C) Non-occupant Loans on Number Average Value Number Average Value Number Average Value
LOANS ORIGINATED 169 $87,293 176 $101,717 40 $60,537 APPLICATIONS APPROVED, NOT ACCEPTED 16 $132,981 87 $101,218 11 $77,737 APPLICATIONS DENIED 3 $69,133 3 $111,230 2 $40,035 APPLICATIONS WITHDRAWN 2 $88,955 29 $105,002 6 $80,020 FILES CLOSED FOR INCOMPLETENESS 0 $0 2 $80,190 0 $0
Aggregated Statistics For Year 2002(Based on 5 full and 8 partial tracts) A) Conventional B) Refinancings C) Non-occupant Loans on Number Average Value Number Average Value Number Average Value
LOANS ORIGINATED 168 $92,062 159 $96,199 36 $59,552 APPLICATIONS APPROVED, NOT ACCEPTED 16 $91,292 37 $95,317 7 $77,404 APPLICATIONS DENIED 1 $104,000 3 $94,983 0 $0 APPLICATIONS WITHDRAWN 8 $74,368 16 $87,909 6 $85,985 FILES CLOSED FOR INCOMPLETENESS 1 $75,000 3 $84,330 0 $0
Aggregated Statistics For Year 2001(Based on 5 full and 8 partial tracts) A) Conventional B) Refinancings C) Non-occupant Loans on Number Average Value Number Average Value Number Average Value
LOANS ORIGINATED 161 $85,914 153 $91,583 45 $56,397 APPLICATIONS APPROVED, NOT ACCEPTED 18 $88,129 32 $90,203 10 $76,647 APPLICATIONS DENIED 4 $25,400 7 $87,157 7 $64,830 APPLICATIONS WITHDRAWN 1 $85,000 5 $102,076 0 $0 FILES CLOSED FOR INCOMPLETENESS 0 $0 3 $103,183 0 $0
Aggregated Statistics For Year 2000(Based on 5 full and 8 partial tracts) A) Conventional B) Refinancings C) Non-occupant Loans on Number Average Value Number Average Value Number Average Value
LOANS ORIGINATED 155 $95,130 36 $85,242 21 $61,732 APPLICATIONS APPROVED, NOT ACCEPTED 9 $88,388 11 $87,223 0 $0 APPLICATIONS DENIED 5 $94,704 9 $96,242 2 $47,660 APPLICATIONS WITHDRAWN 1 $153,070 2 $77,210 0 $0 FILES CLOSED FOR INCOMPLETENESS 2 $53,415 0 $0 0 $0
Aggregated Statistics For Year 1999(Based on 3 full and 4 partial tracts) A) Conventional B) Refinancings C) Non-occupant Loans on Number Average Value Number Average Value Number Average Value
LOANS ORIGINATED 79 $89,232 52 $76,852 11 $55,210 APPLICATIONS APPROVED, NOT ACCEPTED 8 $107,701 8 $76,596 3 $51,697 APPLICATIONS DENIED 2 $63,230 3 $94,677 1 $58,620 APPLICATIONS WITHDRAWN 3 $71,353 2 $73,700 3 $54,610 FILES CLOSED FOR INCOMPLETENESS 1 $84,000 1 $59,770 0 $0
2002 - 2018 National Fire Incident Reporting System (NFIRS) incidents See full 2006 National Fire Incident Reporting System statistics for zip code 44708, Ohio
Most common first names in zip code 44708 among deceased individuals Name Count Lived (average)
Mary 337 81.6 years John 308 76.9 years William 222 76.1 years Robert 207 74.2 years James 168 74.4 years Helen 157 81.7 years Joseph 147 75.5 years Charles 143 77.6 years George 136 76.0 years Paul 126 75.7 years
Most common last names in zip code 44708 among deceased individuals Last name Count Lived (average)
Smith 99 77.7 years Miller 92 77.2 years Williams 49 75.1 years Snyder 36 79.1 years Johnson 34 73.6 years Davis 33 73.9 years Wilson 30 75.1 years Thomas 30 79.0 years Jones 30 73.4 years Anderson 29 77.0 years
Businesses in zip code 44708
Name Count Name Count
ALDI 1 KFC 1 AMF Bowling 1 Lane Furniture 1 AT&T 1 Little Caesars Pizza 1 Advance Auto Parts 1 McDonald's 1 Arby's 1 Nike 3 AutoZone 1 Papa John's Pizza 1 Burger King 1 Payless 1 Catherines 1 Pizza Hut 1 Circle K 1 Rite Aid 2 ColorTyme 1 Rue21 1 Curves 1 Subway 2 Dairy Queen 1 T-Mobile 1 Deb 1 Taco Bell 1 Dennys 1 True Value 1 Dunkin Donuts 1 U-Haul 2 FedEx 3 UPS 1 GNC 1 Walgreens 1 GameStop 1 Walmart 1 H&R Block 1 Wendy's 1 JCPenney 1 YMCA 1
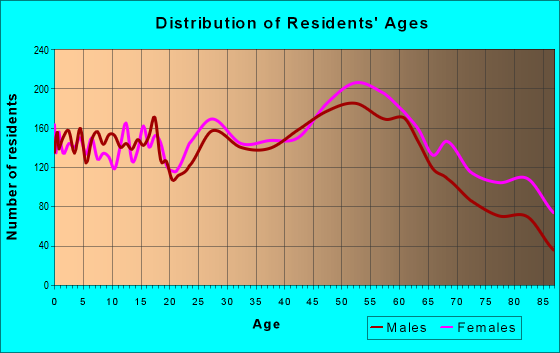
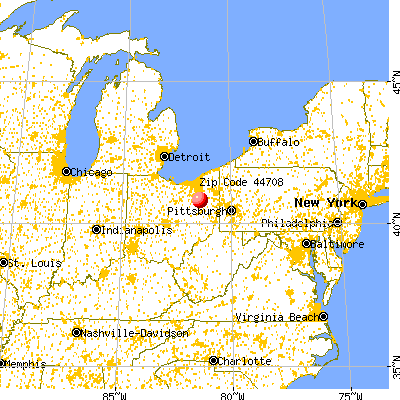


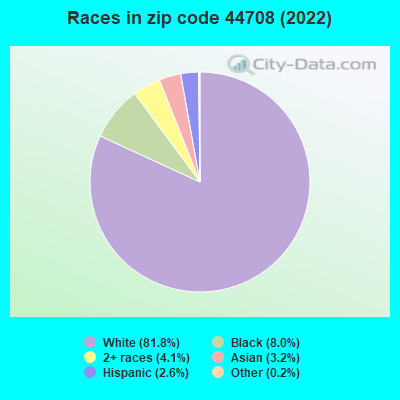


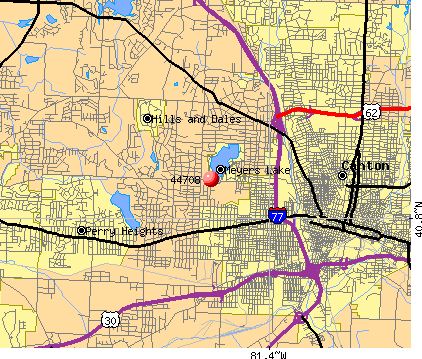 Nearest zip codes: 44710, 44718, 44703, 44709, 44646, 44702.
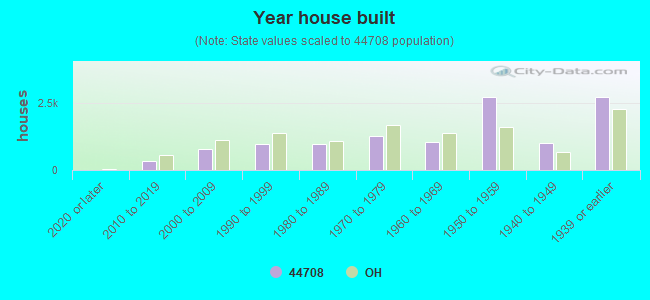
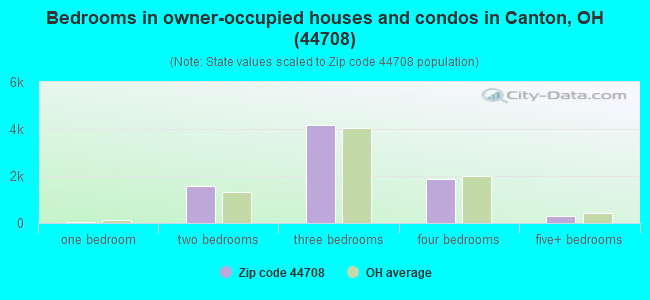
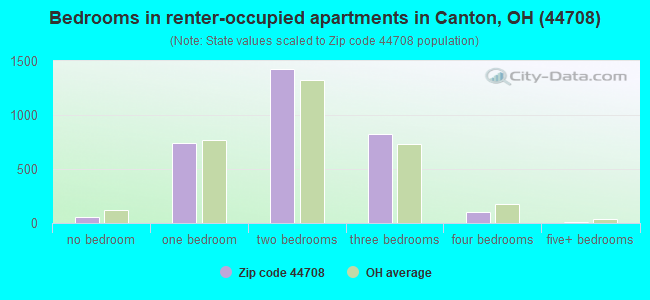


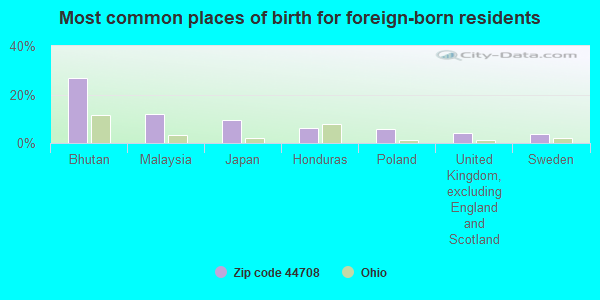
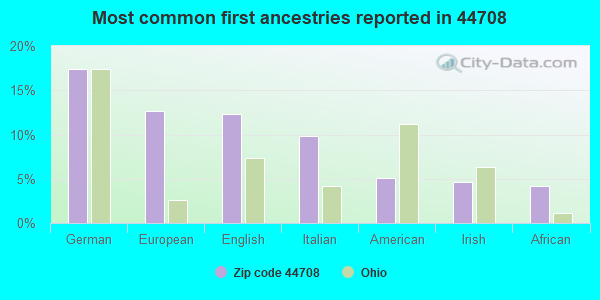
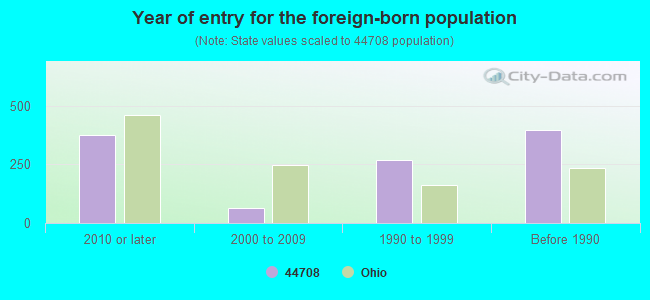

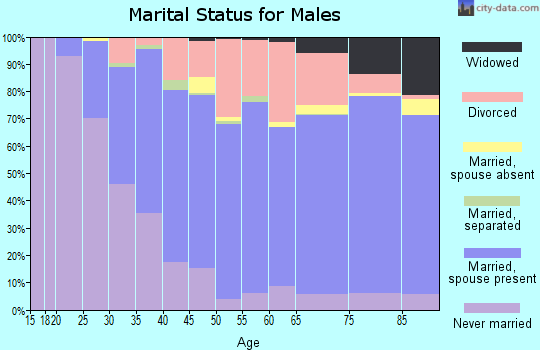
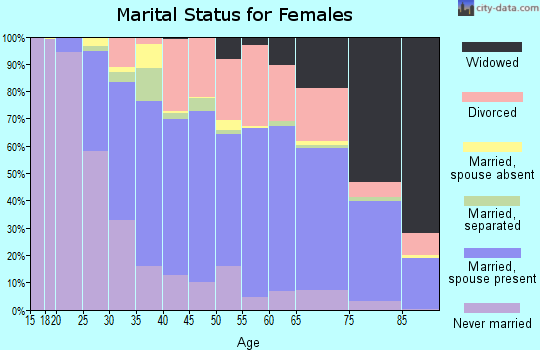
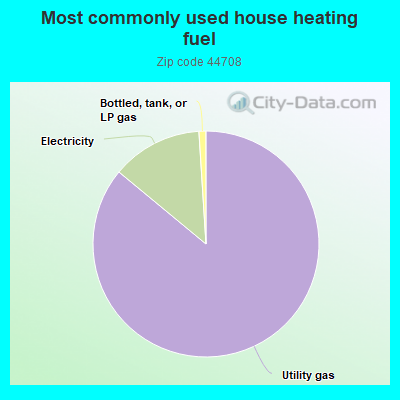
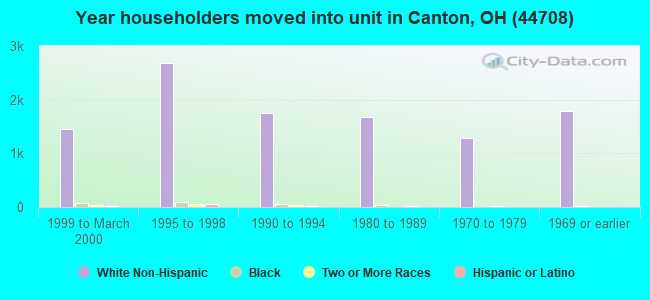
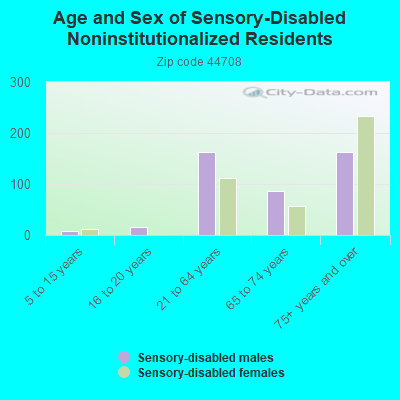
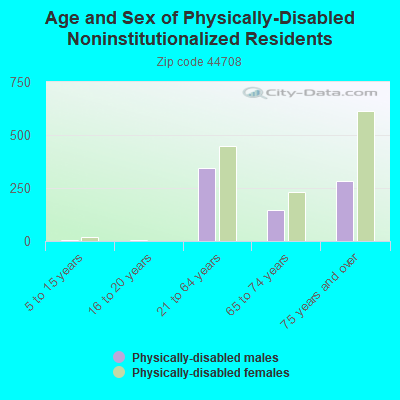
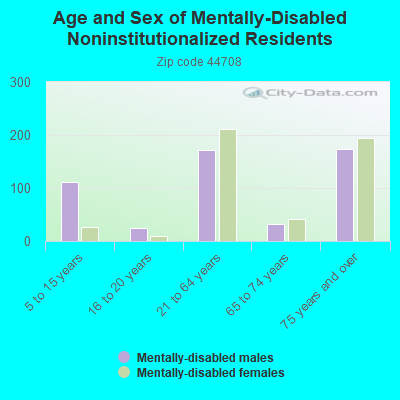
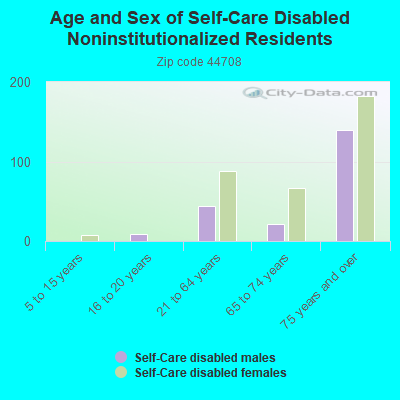
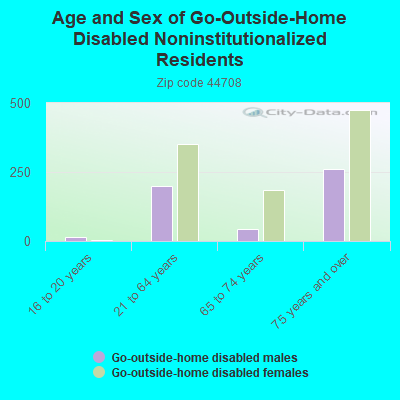
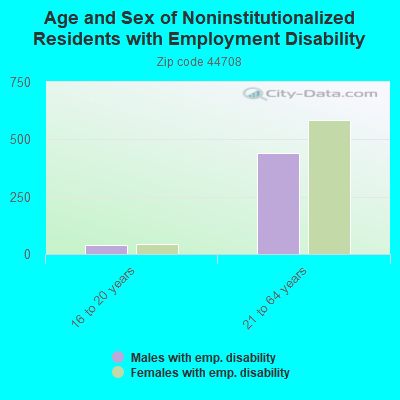
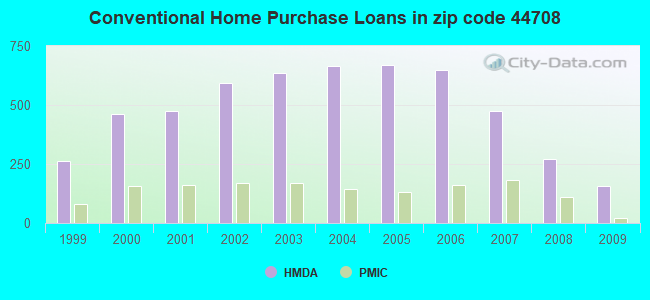
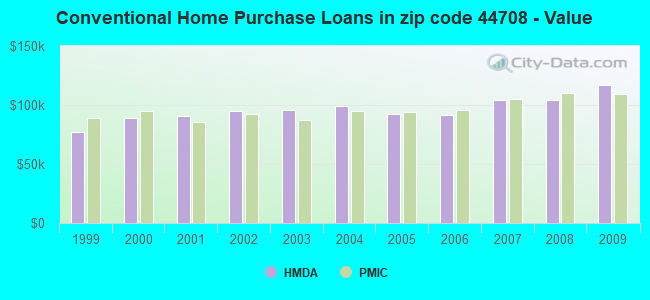
 Based on the data from the years 2002 - 2018 the average number of fires per year is 73. The highest number of reported fires - 119 took place in 2012, and the least - 34 in 2016. The data has an increasing trend.
 When looking into fire subcategories, the most incidents belonged to: Structure Fires (47.3%), and Outside Fires (30.8%).