Estimated zip code population in 2022: 43,855 Zip code population in 2010: 41,236 Zip code population in 2000: 38,114
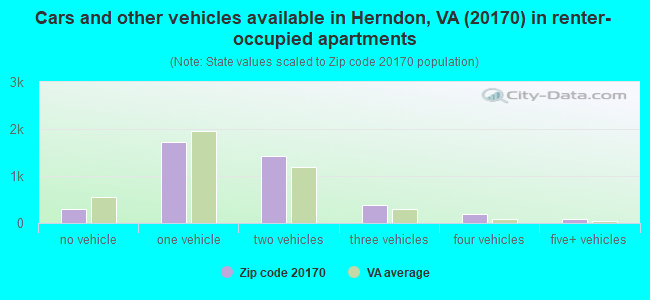
Houses and condos: 14,405 Renter-occupied apartments: 4,132
% of renters here:
29%
State:
33%
March 2022 cost of living index in zip code 20170: 164.3 (very high, U.S. average is 100)
Land area: 8.8 sq. mi. Water area: 0.0 sq. mi.
Population density: 5,000 people per square mile
(average).
OSM Map
General Map
Google Map
MSN Map
OSM Map
General Map
Google Map
MSN Map
OSM Map
General Map
Google Map
MSN Map
OSM Map
General Map
Google Map
MSN Map
Please wait while loading the map...
Real estate property taxes paid for housing units in 2022:
This zip code:
1.0% ($6,258)
Virginia:
0.7% ($2,617)
Median real estate property taxes paid for housing units with mortgages in 2022: $6,209 (1.0%) Median real estate property taxes paid for housing units with no mortgage in 2022: $6,568 (1.0%)
Estimated median house/condo value in 2022: $644,764
20170:
$644,764
Virginia:
$365,700
According to our research of Virginia and other state lists, there were 22 registered sex offenders living in 20170 zip code as of June 01, 2024. The ratio of all residents to sex offenders in zip code 20170 is 1,970 to 1. The ratio of registered sex offenders to all residents in this zip code is much lower than the state average.
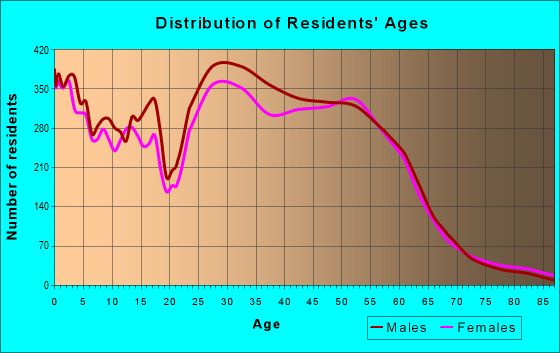
Median resident age:
This zip code:
35.7 years
Virginia median age:
39.0 years
Average household size:
This zip code:
3.1 people
Virginia:
2.5 people
Averages for the 2020 tax year for zip code 20170, filed in 2021:
Average Adjusted Gross Income (AGI) in 2020: $95,742 (Individual Income Tax Returns)
Here:
$95,742
State:
$86,446
Salary/wage: $88,576 (reported on 81.9% of returns)
Here:
$88,576
State:
$71,185
(% of AGI for various income ranges: 1300.6% for AGIs below $25k, 3963.6% for AGIs $25k-50k, 7012.9% for AGIs $50k-75k, 10225.7% for AGIs $75k-100k, 19733.1% for AGIs $100k-200k, 79536.3% for AGIs over 200k)
Taxable interest for individuals: $1,624 (reported on 32.3% of returns)
This zip code:
$1,624
Virginia:
$1,805
(% of AGI for various income ranges: 11.3% for AGIs below $25k, 13.6% for AGIs $25k-50k, 31.4% for AGIs $50k-75k, 46.6% for AGIs $75k-100k, 108.2% for AGIs $100k-200k, 791.2% for AGIs over 200k)
Ordinary dividends: $5,214 (reported on 24.2% of returns)
Here:
$5,214
State:
$8,327
(% of AGI for various income ranges: 16.7% for AGIs below $25k, 24.2% for AGIs $25k-50k, 74.0% for AGIs $50k-75k, 99.5% for AGIs $75k-100k, 320.8% for AGIs $100k-200k, 1842.6% for AGIs over 200k)
Net capital gain/loss in AGI: +$17,899 (reported on 23.4% of returns)
Here:
+$17,899
State:
+$24,644
(% of AGI for various income ranges: 12.2% for AGIs below $25k, 35.3% for AGIs $25k-50k, 66.7% for AGIs $50k-75k, 125.1% for AGIs $75k-100k, 492.6% for AGIs $100k-200k, 8674.9% for AGIs over 200k)
Profit/loss from business: +$13,694 (reported on 25.3% of returns)
Here:
+$13,694
State:
+$12,836
(% of AGI for various income ranges: 379.0% for AGIs below $25k, 236.6% for AGIs $25k-50k, 215.7% for AGIs $50k-75k, 239.2% for AGIs $75k-100k, 487.2% for AGIs $100k-200k, 4063.0% for AGIs over 200k)
Taxable individual retirement arrangement distribution: $24,842 (reported on 6.1% of returns)
20170:
$24,842
Virginia:
$21,535
(% of AGI for various income ranges: 22.6% for AGIs below $25k, 52.0% for AGIs $25k-50k, 114.8% for AGIs $50k-75k, 192.2% for AGIs $75k-100k, 588.0% for AGIs $100k-200k, 1441.0% for AGIs over 200k)
Self-employed (Keogh) retirement plans: $25,541 (reported on 1.0% of returns)
20170:
$25,541
Virginia:
$31,172
(% of AGI for various income ranges: 6.6% for AGIs below $25k, 45.4% for AGIs $100k-200k, 480.4% for AGIs over 200k)
Total itemized deductions: $31,357 (reported on 19.3% of returns)
Here:
$31,357
State:
$33,287
(% of AGI for various income ranges: 68.3% for AGIs below $25k, 203.4% for AGIs $25k-50k, 535.3% for AGIs $50k-75k, 981.8% for AGIs $75k-100k, 1843.6% for AGIs $100k-200k, 6668.8% for AGIs over 200k)
Charity contributions: $7,735 (reported on 15.2% of returns)
Here:
$7,735
State:
$10,381
(% of AGI for various income ranges: 2.9% for AGIs below $25k, 20.4% for AGIs $25k-50k, 57.5% for AGIs $50k-75k, 136.3% for AGIs $75k-100k, 299.6% for AGIs $100k-200k, 1739.9% for AGIs over 200k)
Taxes paid: $9,050 (reported on 19.3% of returns)
20170:
$9,050
State:
$8,284
(% of AGI for various income ranges: 16.4% for AGIs below $25k, 55.9% for AGIs $25k-50k, 159.5% for AGIs $50k-75k, 289.4% for AGIs $75k-100k, 627.9% for AGIs $100k-200k, 1672.7% for AGIs over 200k)
Earned income credit: $2,291 (reported on 11.5% of returns)
Here:
$2,291
State:
$2,214
(% of AGI for various income ranges: 97.8% for AGIs below $25k, 63.5% for AGIs $25k-50k, 0.9% for AGIs $50k-75k)
Percentage of individuals using paid preparers for their 2020 taxes: 88.7%
Here:
89%
State:
92%
(% for various income ranges: 83.1% for AGIs below $25k, 90.1% for AGIs $25k-50k, 91.9% for AGIs $50k-75k, 89.6% for AGIs $75k-100k, 91.5% for AGIs $100k-200k, 92.5% for AGIs over 200k)
Averages for the 2012 tax year for zip code 20170, filed in 2013:
Average Adjusted Gross Income (AGI) in 2012: $80,976 (Individual Income Tax Returns)
Here:
$80,976
State:
$71,192
Salary/wage: $73,989 (reported on 89.1% of returns)
Here:
$73,989
State:
$59,229
(% of AGI for various income ranges: 82.6% for AGIs below $25k, 89.1% for AGIs $25k-50k, 86.1% for AGIs $50k-75k, 85.6% for AGIs $75k-100k, 85.1% for AGIs $100k-200k, 73.7% for AGIs over 200k)
Taxable interest for individuals: $1,091 (reported on 35.6% of returns)
This zip code:
$1,091
Virginia:
$1,600
(% of AGI for various income ranges: 0.5% for AGIs below $25k, 0.3% for AGIs $25k-50k, 0.5% for AGIs $50k-75k, 0.4% for AGIs $75k-100k, 0.4% for AGIs $100k-200k, 0.6% for AGIs over 200k)
Ordinary dividends: $4,218 (reported on 23.2% of returns)
Here:
$4,218
State:
$6,959
(% of AGI for various income ranges: 0.7% for AGIs below $25k, 0.4% for AGIs $25k-50k, 0.9% for AGIs $50k-75k, 0.9% for AGIs $75k-100k, 1.0% for AGIs $100k-200k, 1.9% for AGIs over 200k)
Net capital gain/loss in AGI: +$6,553 (reported on 18.1% of returns)
Here:
+$6,553
State:
+$16,672
(% of AGI for various income ranges: 0.2% for AGIs $50k-75k, 0.3% for AGIs $75k-100k, 0.6% for AGIs $100k-200k, 3.4% for AGIs over 200k)
Profit/loss from business: +$19,112 (reported on 18.1% of returns)
Here:
+$19,112
State:
+$14,116
(% of AGI for various income ranges: 14.5% for AGIs below $25k, 4.6% for AGIs $25k-50k, 2.6% for AGIs $50k-75k, 2.0% for AGIs $75k-100k, 2.4% for AGIs $100k-200k, 5.5% for AGIs over 200k)
Taxable individual retirement arrangement distribution: $18,091 (reported on 5.5% of returns)
20170:
$18,091
Virginia:
$16,667
(% of AGI for various income ranges: 0.8% for AGIs below $25k, 0.6% for AGIs $25k-50k, 1.2% for AGIs $50k-75k, 1.5% for AGIs $75k-100k, 1.6% for AGIs $100k-200k, 1.1% for AGIs over 200k)
Self-employment retirement plans: $22,605 (reported on 1.0% of returns)
20170:
$22,605
Virginia:
$25,373
(% of AGI for various income ranges: 0.2% for AGIs $25k-50k, 0.2% for AGIs $100k-200k, 0.5% for AGIs over 200k)
Total itemized deductions: $27,353 (20% of AGI, reported on 46.8% of returns)
Here:
$27,353
State:
$26,596
Here:
20.0% of AGI
State:
20.1% of AGI
(% of AGI for various income ranges: 11.9% for AGIs below $25k, 16.8% for AGIs $25k-50k, 17.0% for AGIs $50k-75k, 16.3% for AGIs $75k-100k, 17.8% for AGIs $100k-200k, 13.9% for AGIs over 200k)
Charity contributions: $3,398 (reported on 37.8% of returns)
Here:
$3,398
State:
$4,443
(% of AGI for various income ranges: 0.6% for AGIs below $25k, 1.1% for AGIs $25k-50k, 1.4% for AGIs $50k-75k, 1.6% for AGIs $75k-100k, 1.9% for AGIs $100k-200k, 1.6% for AGIs over 200k)
Taxes paid: $11,003 (reported on 46.6% of returns)
20170:
$11,003
State:
$9,951
(% of AGI for various income ranges: 1.8% for AGIs below $25k, 3.2% for AGIs $25k-50k, 4.9% for AGIs $50k-75k, 5.8% for AGIs $75k-100k, 7.5% for AGIs $100k-200k, 7.1% for AGIs over 200k)
Earned income credit: $2,257 (reported on 11.9% of returns)
Here:
$2,257
State:
$2,211
(% of AGI for various income ranges: 4.9% for AGIs below $25k, 1.0% for AGIs $25k-50k)
Percentage of individuals using paid preparers for their 2012 taxes: 50.5%
Here:
51%
State:
46%
(% for various income ranges: 56.3% for AGIs below $25k, 56.5% for AGIs $25k-50k, 49.6% for AGIs $50k-75k, 44.1% for AGIs $75k-100k, 38.8% for AGIs $100k-200k, 47.4% for AGIs over 200k)
Averages for the 2004 tax year for zip code 20170, filed in 2005:
Average Adjusted Gross Income (AGI) in 2004: $66,908 (Individual Income Tax Returns)
Here:
$66,908
State:
$56,704
Salary/wage: $62,319 (reported on 92.0% of returns)
Here:
$62,319
State:
$48,441
(% of AGI for various income ranges: 135.6% for AGIs below $10k, 87.3% for AGIs $10k-25k, 91.7% for AGIs $25k-50k, 89.7% for AGIs $50k-75k, 90.0% for AGIs $75k-100k, 82.1% for AGIs over 100k)
Taxable interest for individuals: $1,006 (reported on 45.9% of returns)
This zip code:
$1,006
Virginia:
$1,688
(% of AGI for various income ranges: 3.6% for AGIs below $10k, 0.8% for AGIs $10k-25k, 0.5% for AGIs $25k-50k, 0.7% for AGIs $50k-75k, 0.5% for AGIs $75k-100k, 0.7% for AGIs over 100k)
Taxable dividends: $2,212 (reported on 25.7% of returns)
Here:
$2,212
State:
$4,028
(% of AGI for various income ranges: 3.1% for AGIs below $10k, 0.5% for AGIs $10k-25k, 0.5% for AGIs $25k-50k, 0.6% for AGIs $50k-75k, 0.6% for AGIs $75k-100k, 1.0% for AGIs over 100k)
Net capital gain/loss: +$8,068 (reported on 21.6% of returns)
Here:
+$8,068
State:
+$14,375
(% of AGI for various income ranges: -2.1% for AGIs below $10k, -0.3% for AGIs $10k-25k, 0.2% for AGIs $25k-50k, 0.3% for AGIs $50k-75k, 0.7% for AGIs $75k-100k, 4.3% for AGIs over 100k)
Profit/loss from business: +$16,066 (reported on 14.9% of returns)
Here:
+$16,066
State:
+$13,342
(% of AGI for various income ranges: 15.2% for AGIs below $10k, 8.9% for AGIs $10k-25k, 3.4% for AGIs $25k-50k, 2.8% for AGIs $50k-75k, 3.0% for AGIs $75k-100k, 3.3% for AGIs over 100k)
IRA payment deduction: $3,011 (reported on 2.4% of returns)
20170:
$3,011
Virginia:
$2,943
(% of AGI for various income ranges: 0.1% for AGIs $10k-25k, 0.2% for AGIs $25k-50k, 0.1% for AGIs $50k-75k, 0.1% for AGIs $75k-100k, 0.1% for AGIs over 100k)
Self-employed pension: $13,397 (reported on 1.3% of returns)
Here:
$13,397
Virginia:
$17,430
(% of AGI for various income ranges: 0.1% for AGIs $25k-50k, 0.1% for AGIs $50k-75k, 0.2% for AGIs $75k-100k, 0.4% for AGIs over 100k)
Total itemized deductions: $23,565 (23% of AGI, reported on 53.2% of returns)
Here:
$23,565
State:
$21,492
Here:
22.6% of AGI
State:
21.0% of AGI
(% of AGI for various income ranges: 15.1% for AGIs below $10k, 19.4% for AGIs $10k-25k, 24.4% for AGIs $25k-50k, 21.2% for AGIs $50k-75k, 21.4% for AGIs $75k-100k, 16.5% for AGIs over 100k)
Charity contributions deductions: $2,891 (3% of AGI, reported on 45.0% of returns)
Here:
$2,891
State:
$3,794
Here:
2.6% of AGI
State:
3.5% of AGI
(% of AGI for various income ranges: 0.5% for AGIs below $10k, 1.0% for AGIs $10k-25k, 1.6% for AGIs $25k-50k, 1.9% for AGIs $50k-75k, 2.1% for AGIs $75k-100k, 2.1% for AGIs over 100k)
Total tax: $11,457 (reported on 81.5% of returns)
20170:
$11,457
State:
$9,537
(% of AGI for various income ranges: 4.5% for AGIs below $10k, 4.8% for AGIs $10k-25k, 6.9% for AGIs $25k-50k, 9.5% for AGIs $50k-75k, 10.5% for AGIs $75k-100k, 17.8% for AGIs over 100k)
Earned income credit: $1,555 (reported on 8.7% of returns)
Here:
$1,555
State:
$1,734
Percentage of individuals using paid preparers for their 2004 taxes: 48.4%
Here:
48%
State:
52%
(% for various income ranges: 40.1% for AGIs below $10k, 59.2% for AGIs $10k-25k, 56.6% for AGIs $25k-50k, 47.5% for AGIs $50k-75k, 40.8% for AGIs $75k-100k, 40.4% for AGIs over 100k)
Likely homosexual households (counted as self-reported same-sex unmarried-partner households)
Lesbian couples: 0.0% of all households
Gay men: 0.1% of all households
Household received Food Stamps/SNAP in the past 12 months: 825 Household did not receive Food Stamps/SNAP in the past 12 months: 13,193
Women who had a birth in the past 12 months: 562 (468 now married, 99 unmarried) Women who did not have a birth in the past 12 months: 9,432 (4,757 now married, 4,646 unmarried)
Housing units in zip code 20170 with a mortgage: 7,850 (984 second mortgage, 129 home equity loan, 748 both second mortgage and home equity loan) Houses without a mortgage: 49
Median monthly owner costs for units with a mortgage: $2,742 Median monthly owner costs for units without a mortgage: $888
Residents with income below the poverty level in 2022:
This zip code:
7.5%
Whole state:
10.6%
Residents with income below 50% of the poverty level in 2022:
This zip code:
4.2%
Whole state:
5.2%
Median number of rooms in houses and condos:
Here:
8.1
State:
7.0
Median number of rooms in apartments:
Here:
4.4
State:
4.3
Notable locations in this zip code not listed on our city pages
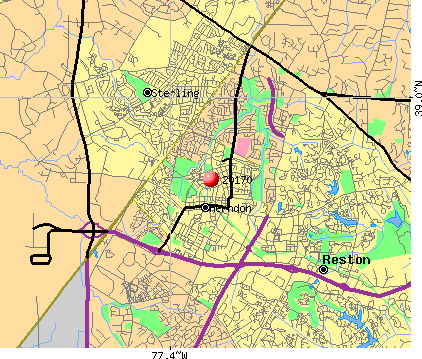
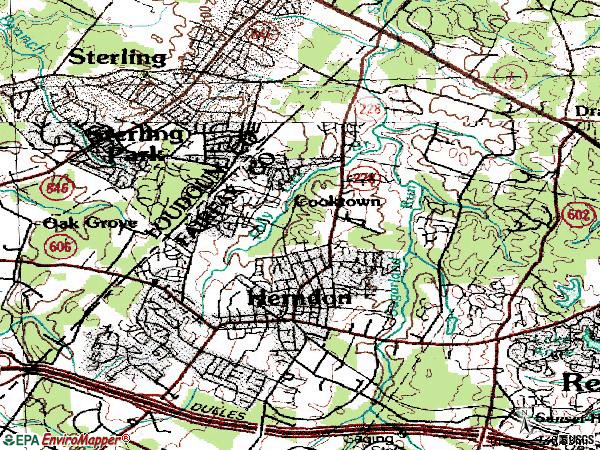
Notable locations in zip code 20170: Herndon Centennial Golf Course (A), Herndon Industrial Venture Park (B), Worldgate Industrial Park (C), Grove Corporate Plaza (D), Hendon Corporate Center (E), Spring Park Technical Center (F), Stuart Professional Center (G), Baron Cameron Office Park (H), Sugarland Industrial Park (I), Corporate Oaks Business Park (J), Crossroads at Dulles Office Park (K), Fairbrook Business Park (L), Enterprise Industrial Park (M), Parkway Trade Center (N), Sunset Business Park (O), Monroe Business Center (P), New Dominion Technology Park (Q), Dranesville Tavern (R), Fairfax County Fire and Rescue Department Station 4 Herndon (S), Herndon Town Hall (T). Display/hide their locations on the map
Shopping Centers: Central Shopping Center (1), Dulles Park Shopping Center (2), President Plaza Shopping Center (3), Parkway Shopping Center (4), Bank of Potomac Shopping Center (5), Elden Street Marketplace Shopping Center (6). Display/hide their locations on the map
Churches in zip code 20170 include: Iglecia Pentecostal El Calvario (A), Dranesville Methodist Church (B), Community Christian Church (C), Herndon Methodist Church (D), First Baptist Church (E), Holy Cross Lutheran Church (F), Trinity Presbyterian Church (G), Temple Baptist Church (H), Saint Timothys Episcopal Church (I). Display/hide their locations on the map
Parks in zip code 20170 include: Stanton Park (1), Herndon Historic District (2), Folly Lick Park (3), Chandon Park (4), Bruin Park (5), Alabama Drive Park (6), Dranesville Tavern Park (7), Runnymeade Park (8), Haley M. Smith Park (9). Display/hide their locations on the map
7,384 married couples with children.
2,085 single-parent households (705 men, 1,380 women).
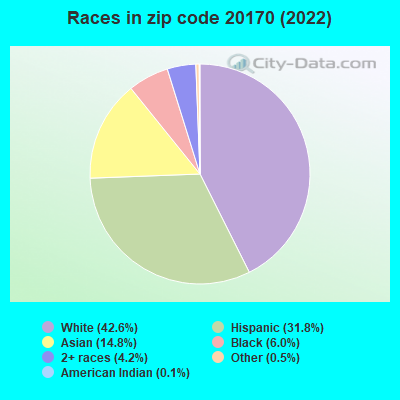
53.7% of residents of 20170 zip code speak English at home.
26.5% of residents speak Spanish at home (46% very well, 26% well, 19% not well, 9% not at all).
9.1% of residents speak other Indo-European language at home (65% very well, 29% well, 5% not well, 1% not at all).
7.6% of residents speak Asian or Pacific Island language at home (63% very well, 22% well, 13% not well, 2% not at all).
3.3% of residents speak other language at home (72% very well, 22% well, 5% not well, 1% not at all).
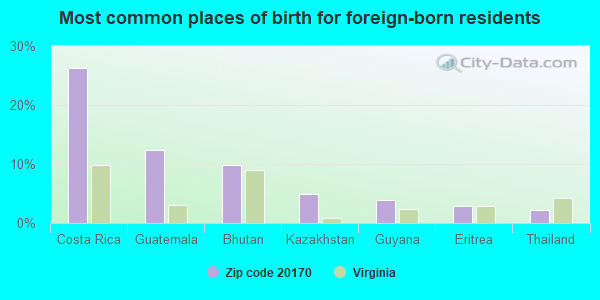
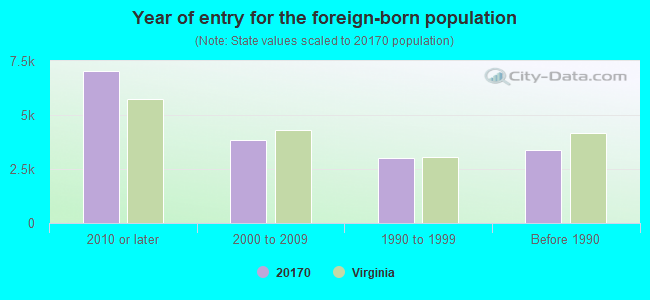
Foreign born population: 15,767 (36.0%) (48.3% of them are naturalized citizens)
Facilities with environmental interests located in this zip code:
CLEARVIEW ELEMENTARY SCHOOL (12635 BUILDERS ROAD in HERNDON, VA)
AIR MINOR (AIRS/AFS) STATE MASTER (Virginia pollutants databases) - CEDS-71825, AIR PROGRAM (National Center for Education Statistics) - STATE ID-0290260 Business SIC and NAICS classification: ELEMENTARY AND SECONDARY SCHOOLS Organizations: FAIRFAX COUNTY PUBLIC SCHOOLS (SCHOOL DISTRICT)
A T AND T - LEESBURG PIKE (11820 LEESBURG PIKE in HERNDON, VA)
AIR MINOR (AIRS/AFS) STATE MASTER (Virginia pollutants databases) - CEDS-72267, AIR PROGRAM Conditionally Exempt Small Quantity Generators, less than 100 kg/month of hazardous waste (Resource Conservation and Recovery Act (tracking hazardous waste)) - notification Business SIC classification: TELEPHONE COMMUNICATIONS, EXCEPT RADIOTELEPHONE Business NAICS classification: WIRED TELECOMMUNICATIONS CARRIERS. Organizations: OPERNAME (CONTACT/OPERATOR)
, AT & T COMMUNICATIONS OF VA (CONTACT/OWNER)
Alternative names: A T & T, AT&T, AT & T-DRANESVILLE-VA4300
ADAMS-GREEN FUNERAL HOME (721 ELDEN STREET in HERNDON, VA)
AIR MINOR (AIRS/AFS) STATE MASTER (Virginia pollutants databases) - CEDS-73261, AIR PROGRAM Business SIC classification: FUNERAL SERVICE AND CREMATORIES Business NAICS classification: FUNERAL HOMES AND FUNERAL SERVICES.
CLARK CONCRETE CONTRACTORS INCORPORATED - PORTABLE (2350 CORPORATE DRWATERVIEW PROJECT STARTS 8-1-00 T in HERNDON, VA)
AIR MINOR (AIRS/AFS) STATE MASTER (Virginia pollutants databases) - CEDS-72369, AIR PROGRAM Business SIC classification: READY-MIXED CONCRETE Business NAICS classification: READY-MIX CONCRETE MANUFACTURING.
CHESAPEAKE & POTOMAC TELEPHONE COMPANY (472 ELDEN STREET in HERNDON, VA)
CHESAPEAKE AND POTOMAC TELEPHONE THE (500 CARLISLE DRIVE in HERNDON, VA)
Conditionally Exempt Small Quantity Generators, less than 100 kg/month of hazardous waste (Resource Conservation and Recovery Act (tracking hazardous waste)) - notification (Resource Conservation and Recovery Act (tracking hazardous waste)) Organizations: THOMAS C JOHNSTONE (CONTACT/OWNER)
Alternative names: C & P TELEPHONE OF VA HERNDON GW
C-3 INCORPORATED (460 HERNDON PARKWAY in HERNDON, VA)
Conditionally Exempt Small Quantity Generators, less than 100 kg/month of hazardous waste (Resource Conservation and Recovery Act (tracking hazardous waste)) - notification Organizations: OPERNAME (CONTACT/OPERATOR)
, AUDA MANAGEMENT INCORPORATED (CONTACT/OWNER)
CARRIER CORPORATION (450 SPRINGPARK PLACE SUITE 1000 in HERNDON, VA)
Small Quantity Generators, between 100 kg and 1000 kg of hazardous waste/month (Resource Conservation and Recovery Act (tracking hazardous waste)) - notification Organizations: OPERNAME (CONTACT/OPERATOR)
, TRAMMELL CROW CO (CONTACT/OWNER)
7 ELEVEN #10653 (607 ELDON STREET in HERNDON, VA)
Small Quantity Generators, between 100 kg and 1000 kg of hazardous waste/month (Resource Conservation and Recovery Act (tracking hazardous waste)) - notification Organizations: 7 ELEVEN INC (CONTACT/OWNER)
CALEAST INDUSTRIAL INVESTORS (470 SPRING PARK PL STE 1000 in HERNDON, VA)
AIR SYNTHETIC MINOR (AIRS/AFS) Business SIC classification: INFORMATION RETRIEVAL SERVICES Alternative names: EXODUS COMMUNICATIONS INC (DC1)
CHAMPON MILLENIUM CHEMICALS INC. (570 HERNDON PARKWAY, SUITE 500 in HERNDON, VA)
ENFORCEMENT/COMPLIANCE ACTIVITY (Integrated Compliance Information System)
Housing units lacking complete plumbing facilities: 0.9% Housing units lacking complete kitchen facilities: 0.3%
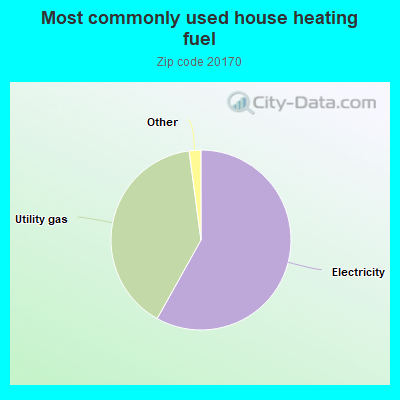
58.1%Electricity
39.8%Utility gas
0.8%Bottled, tank, or LP gas
0.6%No fuel used
Place of birth for U.S.-born residents:
This state: 13,662
Northeast: 4,275
Midwest: 2,740
South: 4,475
West: 1,816
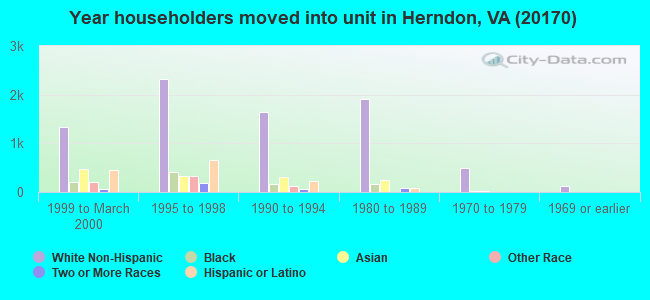
55% of the 20170 zip code residents lived in the same house 5 years ago. Out of people who lived in different houses, 54% lived in this county. Out of people who lived in different counties, 50% lived in Virginia.
89% of the 20170 zip code residents lived in the same house 1 year ago. Out of people who lived in different houses, 51% moved from this county. Out of people who lived in different houses, 15% moved from different county within same state. Out of people who lived in different houses, 22% moved from different state. Out of people who lived in different houses, 10% moved from abroad.
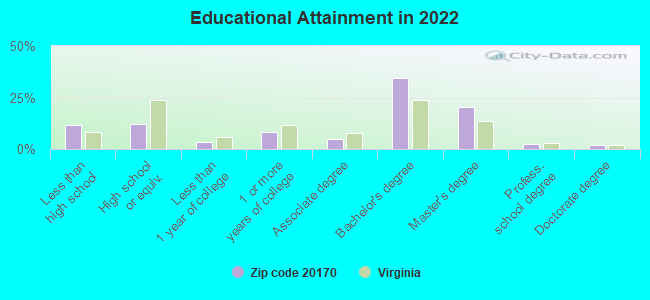
Private vs. public school enrollment:
Students in private schools in grades 1 to 8 (elementary and middle school): 514
Here:
11.4%
Virginia:
13.2%
Students in private schools in grades 9 to 12 (high school): 175
Here:
7.4%
Virginia:
10.2%
Students in private undergraduate colleges: 453
Here:
23.0%
Virginia:
18.7%
Occupation by median earnings in the past 12 months ($)
160,719Legal occupations
124,091Computer and mathematical occupations
119,326Architecture and engineering occupations
119,071Management occupations
107,503Business and financial operations occupations
93,390Life, physical, and social science occupations
Companies with biggest federal contracts located in this zip code (HERNDON, VA):
FIBERTEK, INC (510 HERNDON PARKWAY; small business) : $244,447,365 in 1390 contractsfrom 1999 to 2006
Contracts for Other Research and Development -- Engineering Development (R&D), Defense Missile and Space Systems -- Basic Research (R&D), Defense Electronics and Communication Equipment -- Engineering Development (R&D), Engineering and Technical Services, and moreby Army, Missile Defense Agency, Navy, Air Force, and others Signed by year:2000: $39,050,337; 2001: $28,264,222; 2002: $39,179,719; 2003: $38,516,783; 2004: $40,063,050; 2005: $31,532,699; 2006: $24,726,561.
Biggest contracts:
$3,866,000 with Army for Other Research and Development -- Engineering Development (R&D). Signed on 2002-02-27. Completion date: 2003-04-30.
$3,650,899 with Missile Defense Agency for Defense Missile and Space Systems -- Basic Research (R&D). Signed on 2006-04-12. Completion date: 2008-04-09.
$2,600,000 with Army for Defense Electronics and Communication Equipment -- Engineering Development (R&D). Signed on 2004-02-19. Completion date: 2005-07-19.
$2,000,000 with Army for Engineering and Technical Services. Signed on 2002-03-27. Completion date: 2002-08-31.
PACIFIC ENVIRONMENTAL SERVICES (560 HERNDON PKWY STE 200) : $54,519,701 in 722 contractsfrom 1999 to 2006
Contracts for Architect - Engineer Services (including landscaping, interior layout, and designing), Development of Environmental Impact Statements and Assessments, Other Quality Control, Testing and Inspection Services -- Miscellaneous, A&E Inspection Services (non-construction), and moreby Air Force, Army, EPA, Minerals Management Service, and others Signed by year:2000: $8,359,359; 2001: $8,078,394; 2002: $7,653,941; 2003: $12,322,188; 2004: $8,815,043; 2005: $5,721,205; 2006: $1,954,581.
Biggest contracts:
$2,097,538 with Air Force for Architect - Engineer Services (including landscaping, interior layout, and designing). Taking place in IL. Signed on 2003-02-27. Completion date: 2004-05-01.
$1,996,629 with Air Force for Architect - Engineer Services (including landscaping, interior layout, and designing). Signed on 2004-09-30. Completion date: 2007-09-30.
$1,280,562 with Air Force for Development of Environmental Impact Statements and Assessments. Taking place in IL. Signed on 2000-03-31. Completion date: 2001-07-16.
$1,071,554 with Army for Other Quality Control, Testing and Inspection Services -- Miscellaneous. Taking place in GA. Signed on 2005-03-21. Completion date: 2006-03-31.
SEGOVIA INC (510 SPRING STREET; small business) : $22,001,342 in 52 contractsfrom 2002 to 2006
Contracts for Defense Electronics and Communication Equipment -- Basic Research (R&D), Maintenance, Repair and Rebuilding of Equipment -- Communication, Detection, and Coherent Radiation Equipment, Electronic Countermeasures, Counter-Countermeasures and Quick Reaction Capability Equipment, Other ADP and Telecommunications Services (includes data storage on tapes, compact disks, etc.), and moreby Navy, Army Signed by year:2000: $0; 2001: $0; 2002: $23,222; 2003: $18,040,215; 2004: $3,510,063; 2005: $436,341; 2006: -$8,499.
Biggest contracts:
$8,510,502 with Navy for Defense Electronics and Communication Equipment -- Basic Research (R&D). Signed on 2003-09-23. Completion date: 2004-09-30.
$2,826,004 with Navy for Maintenance, Repair and Rebuilding of Equipment -- Communication, Detection, and Coherent Radiation Equipment. Signed on 2003-11-04. Completion date: 2003-12-31.
$2,652,680 with Navy for Electronic Countermeasures, Counter-Countermeasures and Quick Reaction Capability Equipment. Signed on 2004-09-29. Completion date: 2004-11-01.
$1,671,324 with Navy for Defense Electronics and Communication Equipment -- Basic Research (R&D). Signed on 2003-09-30. Completion date: 2004-09-30.
GOVWORKS (381 ELDEN STREET) : $14,706,687 in 6 contractsfrom 2000 to 2004
Contracts for Other Management Support Services, Guns, 75 mm through 125 mm, ADP Software by U.S. Customs Service, Army, Federal Communications Commission, Federal Trade Commission, and others Signed by year:2000: $126,927; 2001: $0; 2002: $0; 2003: $0; 2004: $14,579,760; 2005: $0; 2006: $0.
Biggest contracts:
$9,999,760 with U.S. Customs Service for Other Management Support Services. Signed on 2004-09-29. Completion date: 2005-09-27.
$4,580,000, same as above.Signed on 2004-09-28. Completion date: 2005-09-27.
$60,927 with Army for Guns, 75 mm through 125 mm. Signed on 2000-05-16. Completion date: 2000-08-18.
$37,000 with Federal Communications Commission for Other Management Support Services. Taking place in DC. Signed on 2000-09-15. Completion date: 2000-09-15.
GANS & PUGH ASSOCIATES INC (690 CENTER ST STE 201; small business) : $14,194,308 in 95 contractsfrom 1999 to 2006
Contracts for Antennas, Waveguides, and Related Equipment, Miscellaneous Communication Equipment, Communications Security Equipment and Components, Miscellaneous Electrical and Electronic Components, and moreby Federal Bureau of Investigation, Department of Defense, Office of the Secretary, Department of Homeland Security, Virginia Contracting Activity, and others Signed by year:2000: $362,300; 2001: $782,711; 2002: $2,156,469; 2003: $2,555,094; 2004: $1,106,525; 2005: $4,210,658; 2006: $2,990,551.
Biggest contracts:
$1,193,808 with Federal Bureau of Investigation for Antennas, Waveguides, and Related Equipment. Signed on 2005-08-23. Completion date: 2006-08-30.
$1,182,887 with Department of Defense for Miscellaneous Communication Equipment. Signed on 2005-09-09. Completion date: 2006-09-09.
$1,129,070 with Office of the Secretary, Department of Homeland Security for Communications Security Equipment and Components. Signed on 2006-05-28. Completion date: 2006-09-08.
$1,025,730, same as above.Signed on 2006-08-28. Completion date: 2010-09-08.
ORACLE CORPORATION (196 VAN BUREN ST STE 200) : $7,215,959 in 11 contractsfrom 1999 to 2003
Contracts for ADP Software, Other ADP and Telecommunications Services (includes data storage on tapes, compact disks, etc.), ADP Input/Output and Storage Devices, Maintenance, Repair and Rebuilding of Equipment -- Automatic Data Processing Equipment (Including Firmware), Software, Supplies and Support Equipment by Offices, Boards and Divisions (includes Attorney General, Deputy Attorney General, etc.), Army, Geological Survey Signed by year:2000: $2,955,000; 2001: $3,223,862; 2002: $8,700; 2003: $972,397; 2004: $0; 2005: $0; 2006: $0.
Biggest contracts:
$3,140,000 with Offices, Boards and Divisions (includes Attorney General, Deputy Attorney General, etc.) for ADP Software. Taking place in DC. Signed on 2001-10-15. Completion date: 2002-10-15.
$2,910,000, same as above.Signed on 2000-03-15. Completion date: 2000-09-15.
$725,050 with Army for ADP Software. Taking place in MD. Signed on 2003-03-10. Completion date: 2004-03-10.
$247,347, same as above.Signed on 2003-02-25. Completion date: 2004-02-27.
FREEPORT TECHNOLOGIES, INC (470 SPRINGPARK PLACE; small business) : $6,221,372 in 7 contractsfrom 2005 to 2006
Contracts for Mailing and Distribution Services, ADPE System Configuration, Engineering and Technical Services, Audio/Visual Services, and moreby Department of Defense, Defense Intelligence Agency, Navy Signed by year:2000: $0; 2001: $0; 2002: $0; 2003: $0; 2004: $0; 2005: $3,637,341; 2006: $2,584,031.
Biggest contracts:
$2,855,156 with Department of Defense for Mailing and Distribution Services. Signed on 2005-07-07. Completion date: 2006-07-07.
$2,077,015 with Defense Intelligence Agency for ADPE System Configuration. Signed on 2006-03-03. Completion date: 2007-03-03.
$507,016 with Defense Intelligence Agency for Engineering and Technical Services. Signed on 2006-05-05. Completion date: 2006-09-09.
$427,419 with Department of Defense for Audio/Visual Services. Signed on 2005-09-09. Completion date: 2006-03-03.
VISUAL TRAINING SOLUTIONS GROU (580 HERNDON PARKWAY; small business) : $2,699,741 in 11 contractsfrom 2002 to 2005
Contracts for ADP Components, Other Professional Services by Army, Air Force Signed by year:2000: $0; 2001: $0; 2002: $856,477; 2003: $600,624; 2004: $150,965; 2005: $1,091,675; 2006: $0.
Biggest contracts:
$1,091,675 with Army for ADP Components. Taking place in FL. Signed on 2005-08-19. Completion date: 2006-02-15.
$571,489 with Army for Other Professional Services. Signed on 2002-09-28. Completion date: 2002-10-31.
$450,698, same as above.Signed on 2003-09-27. Completion date: 2003-10-27.
$284,988 with Air Force for Other Professional Services. Signed on 2002-07-08. Completion date: 2002-09-30.
BOEING SATELLITE SYSTEMS, INC (460 HERNDON PARKWAY) : $2,282,938 in 15 contractsfrom 2001 to 2006
Contracts for Invalid code: AC27, Other Defense -- Applied Research and Exploratory Development (R&D), ADP Software by Navy, Department of Defense, Army Signed by year:2000: $0; 2001: $185,000; 2002: $47,000; 2003: $598,257; 2004: $541,200; 2005: $646,507; 2006: $264,974.
Biggest contracts:
$453,900 with Navy for Invalid code: AC27. Signed on 2005-03-01. Completion date: 2006-02-28.
$441,200, same as above.Signed on 2003-02-27. Completion date: 2004-03-01.
$396,000, same as above.Signed on 2004-03-09. Completion date: 2005-02-28.
$264,974, same as above.Signed on 2006-02-23. Completion date: 2007-02-27.
RACAL RECORDERS INC (480 SPRING PARK PLACE, SU; small business) : $1,836,840 in 15 contractsfrom 2000 to 2001
Contracts for Sound Recording and Reproducing Equipment, Electrical and Electronic Properties Measuring and Testing Instruments, Electrical Hardware and Supplies, Electrical and Electronic assemblies, Boards, Cards, and Associated Hardware, and moreby Navy, Air Force, Army Signed by year:2000: $1,009,642; 2001: $827,198; 2002: $0; 2003: $0; 2004: $0; 2005: $0; 2006: $0.
Biggest contracts:
$600,535 with Navy for Sound Recording and Reproducing Equipment. Taking place in CA. Signed on 2001-01-04. Completion date: 2001-02-08.
$600,535, same as above.Signed on 2000-03-21. Completion date: 2000-04-07.
$134,345 with Air Force for Electrical and Electronic Properties Measuring and Testing Instruments. Taking place in CA. Signed on 2000-03-29. Completion date: 2000-06-04.
$120,732 with Navy for Sound Recording and Reproducing Equipment. Taking place in CA. Signed on 2000-09-14. Completion date: 2000-10-30.
Top industries in this zip code by the number of employees in 2005:
Administrative and Support and Waste Management and Remediation Services: Temporary Help Services (100-249: 2, 50-99: 2, 20-49: 1, 10-19: 1, 5-9: 1, 1-4: 2)
Professional, Scientific, and Technical Services: Other Computer Related Services (100-249: 1, 50-99: 1, 20-49: 3, 10-19: 2, 5-9: 3, 1-4: 13)
Professional, Scientific, and Technical Services: Research and Development in the Physical, Engineering, and Life Sciences (100-249: 2, 10-19: 2, 5-9: 1, 1-4: 4)
People in group quarters in 2010:
4 people in other noninstitutional facilities
Fatal accident statistics in 2013:
Fatal accident count: 3
Vehicles involved in fatal accidents: 4
Fatal accidents caused by drunken drivers: 1
Fatalities: 4
Persons involved in fatal accidents: 9
Pedestrians involved in fatal accidents: 1
Fatal accident statistics in 2012:
Fatal accident count: 1
Vehicles involved in fatal accidents: 2
Fatal accidents caused by drunken drivers: 1
Fatalities: 1
Persons involved in fatal accidents: 2
Pedestrians involved in fatal accidents: 0
Home Mortgage Disclosure Act Aggregated Statistics For Year 2009 (Based on 5 full and 2 partial tracts)
A) FHA, FSA/RHS & VA Home Purchase Loans
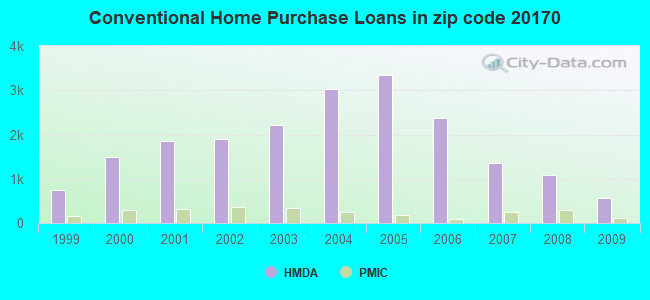
B) Conventional Home Purchase Loans
C) Refinancings
D) Home Improvement Loans
E) Loans on Dwellings For 5+ Families
F) Non-occupant Loans on < 5 Family Dwellings (A B C & D)
G) Loans On Manufactured Home Dwelling (A B C & D)
Number
Average Value
Number
Average Value
Number
Average Value
Number
Average Value
Number
Average Value
Number
Average Value
Number
Average Value
LOANS ORIGINATED
537
$297,743
559
$290,081
2,066
$297,669
58
$118,723
2
$9,994,000
162
$170,807
0
$0
APPLICATIONS APPROVED, NOT ACCEPTED
30
$325,459
47
$258,163
133
$265,108
8
$126,439
0
$0
29
$180,741
0
$0
APPLICATIONS DENIED
57
$244,016
102
$216,150
512
$306,160
34
$113,983
0
$0
47
$181,534
2
$152,000
APPLICATIONS WITHDRAWN
73
$283,522
99
$246,254
491
$290,960
16
$150,429
0
$0
42
$188,554
0
$0
FILES CLOSED FOR INCOMPLETENESS
15
$181,654
17
$221,105
156
$280,804
9
$200,717
0
$0
10
$230,603
0
$0
Aggregated Statistics For Year 2008 (Based on 5 full and 2 partial tracts)
A) FHA, FSA/RHS & VA Home Purchase Loans
B) Conventional Home Purchase Loans
C) Refinancings
D) Home Improvement Loans
E) Loans on Dwellings For 5+ Families
F) Non-occupant Loans on < 5 Family Dwellings (A B C & D)
G) Loans On Manufactured Home Dwelling (A B C & D)
Number
Average Value
Number
Average Value
Number
Average Value
Number
Average Value
Number
Average Value
Number
Average Value
Number
Average Value
LOANS ORIGINATED
625
$273,147
1,076
$244,459
830
$271,540
129
$81,034
1
$2,400,000
301
$152,325
0
$0
APPLICATIONS APPROVED, NOT ACCEPTED
60
$266,801
171
$263,967
166
$266,246
37
$57,741
0
$0
21
$201,938
3
$111,587
APPLICATIONS DENIED
116
$258,746
265
$238,811
571
$294,535
71
$105,342
0
$0
80
$187,855
0
$0
APPLICATIONS WITHDRAWN
87
$278,893
202
$257,455
258
$320,352
15
$168,223
0
$0
48
$163,662
0
$0
FILES CLOSED FOR INCOMPLETENESS
15
$244,551
43
$242,262
35
$285,242
19
$78,812
0
$0
4
$142,448
0
$0
Aggregated Statistics For Year 2007 (Based on 5 full and 2 partial tracts)
A) FHA, FSA/RHS & VA Home Purchase Loans
B) Conventional Home Purchase Loans
C) Refinancings
D) Home Improvement Loans
F) Non-occupant Loans on < 5 Family Dwellings (A B C & D)
Number
Average Value
Number
Average Value
Number
Average Value
Number
Average Value
Number
Average Value
LOANS ORIGINATED
19
$277,046
1,353
$283,598
1,525
$275,507
173
$122,678
158
$267,729
APPLICATIONS APPROVED, NOT ACCEPTED
2
$264,125
123
$344,817
359
$266,263
39
$132,783
37
$293,196
APPLICATIONS DENIED
8
$238,430
329
$304,519
1,000
$312,462
111
$177,145
79
$286,107
APPLICATIONS WITHDRAWN
3
$337,853
151
$305,165
538
$307,910
43
$143,808
44
$252,874
FILES CLOSED FOR INCOMPLETENESS
0
$0
21
$345,506
150
$360,607
6
$134,365
7
$324,284
Aggregated Statistics For Year 2006 (Based on 5 full and 2 partial tracts)
A) FHA, FSA/RHS & VA Home Purchase Loans
B) Conventional Home Purchase Loans
C) Refinancings
D) Home Improvement Loans
F) Non-occupant Loans on < 5 Family Dwellings (A B C & D)
G) Loans On Manufactured Home Dwelling (A B C & D)
Number
Average Value
Number
Average Value
Number
Average Value
Number
Average Value
Number
Average Value
Number
Average Value
LOANS ORIGINATED
10
$283,242
2,364
$250,925
2,460
$277,896
322
$141,933
261
$241,543
4
$62,812
APPLICATIONS APPROVED, NOT ACCEPTED
0
$0
158
$243,005
365
$254,784
64
$129,989
17
$222,864
6
$87,643
APPLICATIONS DENIED
0
$0
502
$257,727
912
$300,360
165
$110,403
67
$258,700
4
$269,838
APPLICATIONS WITHDRAWN
2
$112,000
254
$265,422
752
$305,040
49
$157,762
69
$293,665
0
$0
FILES CLOSED FOR INCOMPLETENESS
0
$0
56
$253,069
145
$324,049
10
$202,354
13
$280,944
0
$0
Aggregated Statistics For Year 2005 (Based on 5 full and 2 partial tracts)
A) FHA, FSA/RHS & VA Home Purchase Loans
B) Conventional Home Purchase Loans
C) Refinancings
D) Home Improvement Loans
E) Loans on Dwellings For 5+ Families
F) Non-occupant Loans on < 5 Family Dwellings (A B C & D)
G) Loans On Manufactured Home Dwelling (A B C & D)
Number
Average Value
Number
Average Value
Number
Average Value
Number
Average Value
Number
Average Value
Number
Average Value
Number
Average Value
LOANS ORIGINATED
32
$271,378
3,341
$272,722
3,461
$274,470
317
$166,041
2
$220,360
449
$250,011
4
$78,888
APPLICATIONS APPROVED, NOT ACCEPTED
1
$296,000
296
$255,509
419
$261,258
47
$133,650
0
$0
45
$285,780
2
$34,000
APPLICATIONS DENIED
1
$284,000
551
$257,143
856
$289,968
105
$129,754
0
$0
116
$242,325
2
$133,000
APPLICATIONS WITHDRAWN
0
$0
266
$281,767
754
$256,037
86
$176,052
0
$0
88
$282,687
0
$0
FILES CLOSED FOR INCOMPLETENESS
2
$266,000
78
$254,458
183
$281,800
4
$36,342
0
$0
13
$209,928
0
$0
Aggregated Statistics For Year 2004 (Based on 5 full and 2 partial tracts)
A) FHA, FSA/RHS & VA Home Purchase Loans
B) Conventional Home Purchase Loans
C) Refinancings
D) Home Improvement Loans
F) Non-occupant Loans on < 5 Family Dwellings (A B C & D)
G) Loans On Manufactured Home Dwelling (A B C & D)
Number
Average Value
Number
Average Value
Number
Average Value
Number
Average Value
Number
Average Value
Number
Average Value
LOANS ORIGINATED
165
$226,748
3,035
$250,029
3,609
$231,040
245
$118,660
411
$205,003
2
$60,000
APPLICATIONS APPROVED, NOT ACCEPTED
8
$193,219
230
$198,866
471
$221,267
57
$64,672
36
$170,344
0
$0
APPLICATIONS DENIED
7
$248,281
398
$233,317
929
$225,413
126
$79,445
70
$193,708
0
$0
APPLICATIONS WITHDRAWN
10
$185,100
288
$238,485
736
$226,980
52
$186,012
32
$179,167
2
$45,000
FILES CLOSED FOR INCOMPLETENESS
2
$245,850
58
$304,016
162
$242,096
17
$307,714
17
$195,248
0
$0
Aggregated Statistics For Year 2003 (Based on 5 full and 2 partial tracts)
A) FHA, FSA/RHS & VA Home Purchase Loans
B) Conventional Home Purchase Loans
C) Refinancings
D) Home Improvement Loans
F) Non-occupant Loans on < 5 Family Dwellings (A B C & D)
Number
Average Value
Number
Average Value
Number
Average Value
Number
Average Value
Number
Average Value
LOANS ORIGINATED
341
$199,721
2,205
$209,268
7,798
$202,052
141
$48,646
356
$132,524
APPLICATIONS APPROVED, NOT ACCEPTED
4
$184,448
145
$198,493
835
$196,117
85
$58,733
22
$140,510
APPLICATIONS DENIED
18
$189,099
212
$197,065
955
$197,606
112
$31,365
52
$144,453
APPLICATIONS WITHDRAWN
39
$171,005
168
$205,802
810
$203,789
30
$54,745
37
$132,610
FILES CLOSED FOR INCOMPLETENESS
12
$210,099
50
$264,115
279
$225,290
14
$77,895
13
$144,743
Aggregated Statistics For Year 2002 (Based on 5 full and 2 partial tracts)
A) FHA, FSA/RHS & VA Home Purchase Loans
B) Conventional Home Purchase Loans
C) Refinancings
D) Home Improvement Loans
F) Non-occupant Loans on < 5 Family Dwellings (A B C & D)
Number
Average Value
Number
Average Value
Number
Average Value
Number
Average Value
Number
Average Value
LOANS ORIGINATED
395
$168,071
1,891
$222,451
5,271
$200,048
152
$57,731
264
$125,508
APPLICATIONS APPROVED, NOT ACCEPTED
14
$135,013
99
$179,068
488
$175,457
59
$48,099
25
$130,858
APPLICATIONS DENIED
17
$158,264
137
$161,622
759
$156,670
131
$27,891
19
$101,188
APPLICATIONS WITHDRAWN
21
$158,828
149
$526,236
747
$172,387
41
$77,608
56
$149,344
FILES CLOSED FOR INCOMPLETENESS
3
$164,260
42
$199,605
150
$197,916
7
$23,194
2
$95,940
Aggregated Statistics For Year 2001 (Based on 5 full and 2 partial tracts)
A) FHA, FSA/RHS & VA Home Purchase Loans
B) Conventional Home Purchase Loans
C) Refinancings
D) Home Improvement Loans
F) Non-occupant Loans on < 5 Family Dwellings (A B C & D)
Number
Average Value
Number
Average Value
Number
Average Value
Number
Average Value
Number
Average Value
LOANS ORIGINATED
505
$153,816
1,846
$184,336
3,820
$180,157
219
$33,877
168
$126,943
APPLICATIONS APPROVED, NOT ACCEPTED
13
$120,132
102
$176,961
312
$161,656
81
$42,406
12
$165,461
APPLICATIONS DENIED
18
$128,772
202
$157,132
585
$120,304
176
$26,806
27
$99,542
APPLICATIONS WITHDRAWN
22
$169,754
156
$204,578
512
$137,710
60
$40,042
17
$114,846
FILES CLOSED FOR INCOMPLETENESS
2
$73,000
19
$247,636
138
$147,430
8
$28,341
3
$142,300
Aggregated Statistics For Year 2000 (Based on 5 full and 2 partial tracts)
A) FHA, FSA/RHS & VA Home Purchase Loans
B) Conventional Home Purchase Loans
C) Refinancings
D) Home Improvement Loans
F) Non-occupant Loans on < 5 Family Dwellings (A B C & D)
Number
Average Value
Number
Average Value
Number
Average Value
Number
Average Value
Number
Average Value
LOANS ORIGINATED
512
$141,203
1,487
$169,453
597
$139,246
205
$43,797
88
$109,319
APPLICATIONS APPROVED, NOT ACCEPTED
10
$133,324
87
$129,297
101
$117,404
79
$30,456
8
$90,984
APPLICATIONS DENIED
29
$126,650
134
$144,623
426
$84,091
162
$26,063
26
$61,577
APPLICATIONS WITHDRAWN
28
$146,334
110
$187,569
230
$80,298
67
$54,548
10
$65,526
FILES CLOSED FOR INCOMPLETENESS
6
$91,288
9
$105,333
56
$127,544
16
$26,283
5
$97,946
Aggregated Statistics For Year 1999 (Based on 2 full and 2 partial tracts)
A) FHA, FSA/RHS & VA Home Purchase Loans
B) Conventional Home Purchase Loans
C) Refinancings
D) Home Improvement Loans
F) Non-occupant Loans on < 5 Family Dwellings (A B C & D)
2004 - 2018 National Fire Incident Reporting System (NFIRS) incidents
Based on the data from the years 2004 - 2018 the average number of fire incidents per year is 69. The highest number of fires - 104 took place in 2006, and the least - 9 in 2004. The data has an increasing trend.
When looking into fire subcategories, the most incidents belonged to: Outside Fires (43.7%), and Structure Fires (40.9%).
Fire incident types reported to NFIRS in Zip Code 20170
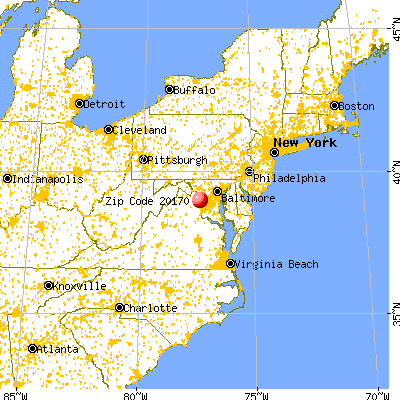


 Nearest zip codes: 20164, 20194, 20190, 20191, 20171, 20166.


 Based on the data from the years 2004 - 2018 the average number of fire incidents per year is 69. The highest number of fires - 104 took place in 2006, and the least - 9 in 2004. The data has an increasing trend.
 When looking into fire subcategories, the most incidents belonged to: Outside Fires (43.7%), and Structure Fires (40.9%).