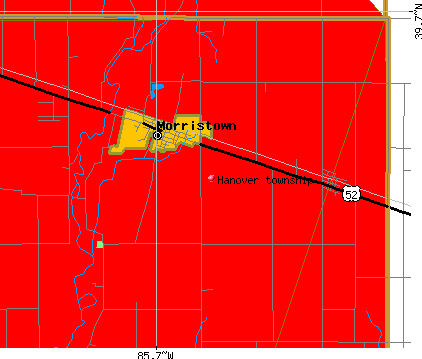
Hanover township, Shelby County, Indiana (IN) detailed profile
Number of foreign born residents: 0 (50% naturalized citizens)
| Hanover township: | 0.2% |
| Whole state: | 3.1% |
65% of Hanover township residents lived in the same house 5 years ago.
Out of people who lived in different houses, 47% lived in this county.
Out of people who lived in different counties, 72% lived in Indiana.
Place of birth for U.S.-born residents:
- This state: 1845
- Northeast: 25
- Midwest: 140
- South: 225
- West: 66
Median price asked for vacant for-sale houses in 2000: $71,000
Percentage of households with unmarried partners: 5.3%
Likely homosexual households (counted as self-reported same-sex unmarried-partner households)
- Lesbian couples: 0.2% of all households
- Gay men: 0.1% of all households
36 people in nursing homes

Housing units in structures:
- One, detached: 741
- Two: 36
- 3 or 4: 2
- 5 to 9: 23
- 10 to 19: 13
- Mobile homes: 76
Median worth of mobile homes: $15,000
Housing units in Hanover township with a mortgage: 419 (65 second mortgage, 93 home equity loan, 2 both second mortgage and home equity loan)
Houses without a mortgage: 145
- Transportation equipment (10%)
- Metal and metal products (9%)
- Construction (9%)
- Accommodation and food services (8%)
- Public administration (6%)
- Truck transportation (5%)
- Repair and maintenance (5%)
- Health care (14%)
- Educational services (13%)
- Accommodation and food services (11%)
- Finance and insurance (7%)
- Food (5%)
- Food and beverage stores (5%)
- Public administration (4%)
- Driver/sales workers and truck drivers (9%)
- Other production occupations including supervisors (8%)
- Electrical equipment mechanics and other installation, maintenance, and repair occupations including supervisors (7%)
- Metal workers and plastic workers (6%)
- Vehicle and mobile equipment mechanics, installers, and repairers (6%)
- Building and grounds cleaning and maintenance occupations (6%)
- Cooks and food preparation workers (6%)
- Other teachers and instructors, education, training, and library occupations (7%)
- Bookkeeping, accounting, and auditing clerks (7%)
- Other production occupations including supervisors (5%)
- Financial clerks except bookkeeping, accounting, and auditing clerks (5%)
- Registered nurses (4%)
- Assemblers and fabricators (4%)
- Cooks and food preparation workers (4%)
Most common first ancestries reported in Hanover township:
- United States or American (26.1%)
- German (24.7%)
- English (13.5%)
- Irish (11.0%)
- Scotch-Irish (4.0%)
- Scottish (3.6%)
- Italian (2.5%)
Most common places of birth for the foreign-born residents:
- United Kingdom (50%)
- Germany (50%)
Means of transportation to work:
- Drove a car alone: 916 (84%)
- Carpooled: 62 (6%)
- Bus or trolley bus: 1 (0%)
- Bicycle: 6 (1%)
- Walked: 62 (6%)
- Other means: 6 (1%)
- Worked at home: 33 (3%)
Most commonly used house heating fuel:
- Utility gas (68%)
- Bottled, tank, or LP gas (13%)
- Electricity (13%)
- Fuel oil, kerosene, etc. (5%)
- Wood (1%)
36 people in nursing homes
99.1% of residents of Hanover township speak English at home.
0.4% of residents speak Spanish at home (38% speak English very well, 63% speak English well).
0.2% of residents speak other Indo-European language at home (80% speak English very well, 20% speak English not well).
0.3% of residents speak Asian or Pacific Island language at home (100% speak English very well).
Household type by relationship:
Households: 2,276- In family households: 2,058 (521 male householders, 128 female householders)
562 spouses, 744 children (635 natural, 53 adopted, 56 stepchildren), 40 grandchildren, 0 brothers or sisters, 0 parents, 6 other relatives, 57 non-relatives
- In nonfamily households: 218 (92 male householders (79 living alone)), 96 female householders (94 living alone)), 30 nonrelatives
- In group quarters: 36 (all institutionalized)
Size of family households: 305 2-persons, 127 3-persons, 143 4-persons, 53 5-persons, 15 6-persons, 6 7-or-more-persons,
Size of nonfamily households: 173 1-person, 8 2-persons, 4 3-persons, 3 4-persons,
486 married couples with children.
109 single-parent households (34 men, 75 women).
Private vs. public school enrollment:
Students in private schools in grades 1 to 8 (elementary and middle school): 9
| Here: | 3.2% |
| Indiana: | 11.8% |
Students in private schools in grades 9 to 12 (high school): 2
| Here: | 1.2% |
| Indiana: | 8.8% |
Students in private undergraduate colleges: 20
| Here: | 33.3% |
| Indiana: | 23.4% |