Races in Whitewater, Wisconsin (WI) Detailed Stats
Data:
Races - White alone (%)
Races - White alone (% change since 2000)
Races - Black alone (%)
Races - Black alone (% change since 2000)
Races - American Indian alone (%)
Races - American Indian alone (% change since 2000)
Races - Asian alone (%)
Races - Asian alone (% change since 2000)
Races - Hispanic (%)
Races - Hispanic (% change since 2000)
Races - Native Hawaiian and Other Pacific Islander alone (%)
Races - Native Hawaiian and Other Pacific Islander alone (% change since 2000)
Races - Two or more races(%)
Races - Two or more races(% change since 2000)
Races - Other race alone (%)
Races - Other race alone (% change since 2000)
Racial diversity
Place of birth - Born in state of residence (%)
Place of birth - Born in state of residence (%) - White
Place of birth - Born in state of residence (%) - Black or African American
Place of birth - Born in state of residence (%) - Asian
Place of birth - Born in state of residence (%) - Hispanic or Latino
Place of birth - Born in state of residence (%) - American Indian and Alaska Native
Place of birth - Born in state of residence (%) - Multirace
Place of birth - Born in state of residence (%) - Other Race
Place of birth - Born in other state (%)
Place of birth - Born in other state (%) - White
Place of birth - Born in other state (%) - Black or African American
Place of birth - Born in other state (%) - Asian
Place of birth - Born in other state (%) - Hispanic or Latino
Place of birth - Born in other state (%) - American Indian and Alaska Native
Place of birth - Born in other state (%) - Multirace
Place of birth - Born in other state (%) - Other Race
Place of birth - Native, outside of US (%)
Place of birth - Native, outside of US (%) - White
Place of birth - Native, outside of US (%) - Black or African American
Place of birth - Native, outside of US (%) - Asian
Place of birth - Native, outside of US (%) - Hispanic or Latino
Place of birth - Native, outside of US (%) - American Indian and Alaska Native
Place of birth - Native, outside of US (%) - Multirace
Place of birth - Native, outside of US (%) - Other Race
Place of birth - Foreign born (%)
Place of birth - Foreign born (%) - White
Place of birth - Foreign born (%) - Black or African American
Place of birth - Foreign born (%) - Asian
Place of birth - Foreign born (%) - Hispanic or Latino
Place of birth - Foreign born (%) - American Indian and Alaska Native
Place of birth - Foreign born (%) - Multirace
Place of birth - Foreign born (%) - Other Race
Residents speaking English at home (%)
Residents speaking English at home - Born in the United States (%)
Residents speaking English at home - Native, born elsewhere (%)
Residents speaking English at home - Foreign born (%)
Residents speaking Spanish at home (%)
Residents speaking Spanish at home - Born in the United States (%)
Residents speaking Spanish at home - Native, born elsewhere (%)
Residents speaking Spanish at home - Foreign born (%)
Residents speaking other language at home (%)
Residents speaking other language at home - Born in the United States (%)
Residents speaking other language at home - Native, born elsewhere (%)
Residents speaking other language at home - Foreign born (%)
Marital status - Never married (%)
Marital status - Now married (%)
Marital status - Separated (%)
Marital status - Widowed (%)
Marital status - Divorced (%)
Ancestries Reported - Arab (%)
Ancestries Reported - Czech (%)
Ancestries Reported - Danish (%)
Ancestries Reported - Dutch (%)
Ancestries Reported - English (%)
Ancestries Reported - French (%)
Ancestries Reported - French Canadian (%)
Ancestries Reported - German (%)
Ancestries Reported - Greek (%)
Ancestries Reported - Hungarian (%)
Ancestries Reported - Irish (%)
Ancestries Reported - Italian (%)
Ancestries Reported - Lithuanian (%)
Ancestries Reported - Norwegian (%)
Ancestries Reported - Polish (%)
Ancestries Reported - Portuguese (%)
Ancestries Reported - Russian (%)
Ancestries Reported - Scotch-Irish (%)
Ancestries Reported - Scottish (%)
Ancestries Reported - Slovak (%)
Ancestries Reported - Subsaharan African (%)
Ancestries Reported - Swedish (%)
Ancestries Reported - Swiss (%)
Ancestries Reported - Ukrainian (%)
Ancestries Reported - United States (%)
Ancestries Reported - Welsh (%)
Ancestries Reported - West Indian (%)
Ancestries Reported - Other (%)
Geographical mobility - Same house 1 year ago (%)
Geographical mobility - Same house 1 year ago (%) - White
Geographical mobility - Same house 1 year ago (%) - Black or African American
Geographical mobility - Same house 1 year ago (%) - Asian
Geographical mobility - Same house 1 year ago (%) - Hispanic or Latino
Geographical mobility - Same house 1 year ago (%) - American Indian and Alaska Native
Geographical mobility - Same house 1 year ago (%) - Multirace
Geographical mobility - Same house 1 year ago (%) - Other Race
Geographical mobility - Moved within same county (%)
Geographical mobility - Moved within same county (%) - White
Geographical mobility - Moved within same county (%) - Black or African American
Geographical mobility - Moved within same county (%) - Asian
Geographical mobility - Moved within same county (%) - Hispanic or Latino
Geographical mobility - Moved within same county (%) - American Indian and Alaska Native
Geographical mobility - Moved within same county (%) - Multirace
Geographical mobility - Moved within same county (%) - Other Race
Geographical mobility - Moved from different county within same state (%)
Geographical mobility - Moved from different county within same state (%) - White
Geographical mobility - Moved from different county within same state (%) - Black or African American
Geographical mobility - Moved from different county within same state (%) - Asian
Geographical mobility - Moved from different county within same state (%) - Hispanic or Latino
Geographical mobility - Moved from different county within same state (%) - American Indian and Alaska Native
Geographical mobility - Moved from different county within same state (%) - Multirace
Geographical mobility - Moved from different county within same state (%) - Other Race
Geographical mobility - Moved from different state (%)
Geographical mobility - Moved from different state (%) - White
Geographical mobility - Moved from different state (%) - Black or African American
Geographical mobility - Moved from different state (%) - Asian
Geographical mobility - Moved from different state (%) - Hispanic or Latino
Geographical mobility - Moved from different state (%) - American Indian and Alaska Native
Geographical mobility - Moved from different state (%) - Multirace
Geographical mobility - Moved from different state (%) - Other Race
Geographical mobility - Moved from abroad (%)
Geographical mobility - Moved from abroad (%) - White
Geographical mobility - Moved from abroad (%) - Black or African American
Geographical mobility - Moved from abroad (%) - Asian
Geographical mobility - Moved from abroad (%) - Hispanic or Latino
Geographical mobility - Moved from abroad (%) - American Indian and Alaska Native
Geographical mobility - Moved from abroad (%) - Multirace
Geographical mobility - Moved from abroad (%) - Other Race
Place of birth for the foreign-born population - Ireland (%)
Place of birth for the foreign-born population - Denmark (%)
Place of birth for the foreign-born population - Norway (%)
Place of birth for the foreign-born population - Sweden (%)
Place of birth for the foreign-born population - United Kingdom (%)
Place of birth for the foreign-born population - England (%)
Place of birth for the foreign-born population - Scotland (%)
Place of birth for the foreign-born population - Other Northern Europe (%)
Place of birth for the foreign-born population - Austria (%)
Place of birth for the foreign-born population - Belgium (%)
Place of birth for the foreign-born population - France (%)
Place of birth for the foreign-born population - Germany (%)
Place of birth for the foreign-born population - Netherlands (%)
Place of birth for the foreign-born population - Switzerland (%)
Place of birth for the foreign-born population - Other Western Europe (%)
Place of birth for the foreign-born population - Greece (%)
Place of birth for the foreign-born population - Italy (%)
Place of birth for the foreign-born population - Portugal (%)
Place of birth for the foreign-born population - Spain (%)
Place of birth for the foreign-born population - Other Southern Europe (%)
Place of birth for the foreign-born population - Albania (%)
Place of birth for the foreign-born population - Belarus (%)
Place of birth for the foreign-born population - Bosnia and Herzegovina (%)
Place of birth for the foreign-born population - Bulgaria (%)
Place of birth for the foreign-born population - Croatia (%)
Place of birth for the foreign-born population - Czechoslovakia (%)
Place of birth for the foreign-born population - Hungary (%)
Place of birth for the foreign-born population - Latvia (%)
Place of birth for the foreign-born population - Lithuania (%)
Place of birth for the foreign-born population - North Macedonia (Macedonia) (%)
Place of birth for the foreign-born population - Moldova (%)
Place of birth for the foreign-born population - Poland (%)
Place of birth for the foreign-born population - Romania (%)
Place of birth for the foreign-born population - Russia (%)
Place of birth for the foreign-born population - Serbia (%)
Place of birth for the foreign-born population - Ukraine (%)
Place of birth for the foreign-born population - Other Eastern Europe (%)
Place of birth for the foreign-born population - China (%)
Place of birth for the foreign-born population - Hong Kong (%)
Place of birth for the foreign-born population - Taiwan (%)
Place of birth for the foreign-born population - Japan (%)
Place of birth for the foreign-born population - Korea (%)
Place of birth for the foreign-born population - Other Eastern Asia (%)
Place of birth for the foreign-born population - Afghanistan (%)
Place of birth for the foreign-born population - Bangladesh (%)
Place of birth for the foreign-born population - India (%)
Place of birth for the foreign-born population - Iran (%)
Place of birth for the foreign-born population - Kazakhstan (%)
Place of birth for the foreign-born population - Nepal (%)
Place of birth for the foreign-born population - Pakistan (%)
Place of birth for the foreign-born population - Sri Lanka (%)
Place of birth for the foreign-born population - Uzbekistan (%)
Place of birth for the foreign-born population - Other South Central Asia (%)
Place of birth for the foreign-born population - Burma (%)
Place of birth for the foreign-born population - Cambodia (%)
Place of birth for the foreign-born population - Indonesia (%)
Place of birth for the foreign-born population - Laos (%)
Place of birth for the foreign-born population - Malaysia (%)
Place of birth for the foreign-born population - Philippines (%)
Place of birth for the foreign-born population - Singapore (%)
Place of birth for the foreign-born population - Thailand (%)
Place of birth for the foreign-born population - Vietnam (%)
Place of birth for the foreign-born population - Other South Eastern Asia (%)
Place of birth for the foreign-born population - Armenia (%)
Place of birth for the foreign-born population - Iraq (%)
Place of birth for the foreign-born population - Israel (%)
Place of birth for the foreign-born population - Jordan (%)
Place of birth for the foreign-born population - Kuwait (%)
Place of birth for the foreign-born population - Lebanon (%)
Place of birth for the foreign-born population - Saudi Arabia (%)
Place of birth for the foreign-born population - Syria (%)
Place of birth for the foreign-born population - Turkey (%)
Place of birth for the foreign-born population - Yemen (%)
Place of birth for the foreign-born population - Other Western Asia (%)
Place of birth for the foreign-born population - Eritrea (%)
Place of birth for the foreign-born population - Ethiopia (%)
Place of birth for the foreign-born population - Kenya (%)
Place of birth for the foreign-born population - Somalia (%)
Place of birth for the foreign-born population - Uganda (%)
Place of birth for the foreign-born population - Zimbabwe (%)
Place of birth for the foreign-born population - Other Eastern Africa (%)
Place of birth for the foreign-born population - Cameroon (%)
Place of birth for the foreign-born population - Congo (%)
Place of birth for the foreign-born population - Democratic Republic of Congo (Zaire) (%)
Place of birth for the foreign-born population - Other Middle Africa (%)
Place of birth for the foreign-born population - Egypt (%)
Place of birth for the foreign-born population - Morocco (%)
Place of birth for the foreign-born population - Sudan (%)
Place of birth for the foreign-born population - Other Northern Africa (%)
Place of birth for the foreign-born population - South Africa (%)
Place of birth for the foreign-born population - Other Southern Africa (%)
Place of birth for the foreign-born population - Cabo Verde (%)
Place of birth for the foreign-born population - Ghana (%)
Place of birth for the foreign-born population - Liberia (%)
Place of birth for the foreign-born population - Nigeria (%)
Place of birth for the foreign-born population - Senegal (%)
Place of birth for the foreign-born population - Sierra Leone (%)
Place of birth for the foreign-born population - Other Western Africa (%)
Place of birth for the foreign-born population - Australia (%)
Place of birth for the foreign-born population - New Zealand (%)
Place of birth for the foreign-born population - Fiji (%)
Place of birth for the foreign-born population - Micronesia (%)
Place of birth for the foreign-born population - Bahamas (%)
Place of birth for the foreign-born population - Barbados (%)
Place of birth for the foreign-born population - Cuba (%)
Place of birth for the foreign-born population - Dominica (%)
Place of birth for the foreign-born population - Dominican Republic (%)
Place of birth for the foreign-born population - Grenada (%)
Place of birth for the foreign-born population - Haiti (%)
Place of birth for the foreign-born population - Jamaica (%)
Place of birth for the foreign-born population - St. Vincent and the Grenadines (%)
Place of birth for the foreign-born population - Trinidad and Tobago (%)
Place of birth for the foreign-born population - West Indies (%)
Place of birth for the foreign-born population - Other Caribbean (%)
Place of birth for the foreign-born population - Belize (%)
Place of birth for the foreign-born population - Costa Rica (%)
Place of birth for the foreign-born population - El Salvador (%)
Place of birth for the foreign-born population - Guatemala (%)
Place of birth for the foreign-born population - Honduras (%)
Place of birth for the foreign-born population - Mexico (%)
Place of birth for the foreign-born population - Nicaragua (%)
Place of birth for the foreign-born population - Panama (%)
Place of birth for the foreign-born population - Other Central America (%)
Place of birth for the foreign-born population - Argentina (%)
Place of birth for the foreign-born population - Bolivia (%)
Place of birth for the foreign-born population - Brazil (%)
Place of birth for the foreign-born population - Chile (%)
Place of birth for the foreign-born population - Colombia (%)
Place of birth for the foreign-born population - Ecuador (%)
Place of birth for the foreign-born population - Guyana (%)
Place of birth for the foreign-born population - Peru (%)
Place of birth for the foreign-born population - Uruguay (%)
Place of birth for the foreign-born population - Venezuela (%)
Place of birth for the foreign-born population - Other South America (%)
Place of birth for the foreign-born population - Canada (%)
Place of birth for the foreign-born population - Other Northern America (%)
Place of birth for the foreign-born population - Other (%)
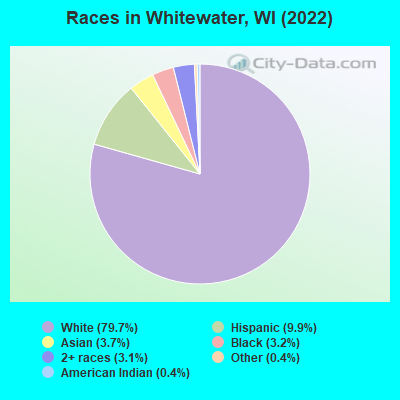
According to 2022 data, the most numerous races in Whitewater, WI are White alone (12,562 residents), Hispanic (1,566 residents), and Black alone (505 residents). 87.4% of Whitewater residents speak English at home. 7.5% of Whitewater, WI residents are foreign-born (3.1% born in Latin America, 2.1% born in Europe, 1.9% born in Asia), which is 33.0% greater than the foreign-born rate of 5.0% across the entire state of Wisconsin.
Race distribution in Whitewater
2000 2022
4,681,630 87.3% White alone 300,245 5.6% Black alone 192,921 3.6% Hispanic 87,995 1.6% Asian alone 51,921 1.0% Two or more races 43,980 0.8% American Indian alone 3,637 0.07% Other race alone 1,346 0.03% Native Hawaiian and Other
4,654,031 79.0% White alone 447,022 7.6% Hispanic 345,678 5.9% Black alone 217,532 3.7% Two or more races 172,242 2.9% Asian alone 33,762 0.6% American Indian alone 19,680 0.3% Other race alone 2,592 0.04% Native Hawaiian and Other
Income and house value in Whitewater Median household income in 2022 $41,754 White non-Hispanic householders$60,800 Black householders$110,792 American Indian and Alaska Native householders$70,275 Two or more races householders$52,509 Hispanic or Latino race householdersMedian 2022 house value $237,130 White Non-Hispanic householders$218,372 Black or African American householders$91,753 American Indian or Alaska Native householders $298,503 Asian householders$280,356 Some other race householders$126,619 Two or more races householders$161,485 Hispanic or Latino householders
Median age by race in Whitewater
22.5 Median age for White residents22.3 22.7 21.9 Median age for Black or African American residents23.7 19.3 49.4 Median age for American Indian / Alaska Native residents-704,819,276.4 -689,393,938.7 23.7 Median age for Asian residents17.7 34.1 -825,688,072.6 Median age for Native Hawaiian / Pacific Islander residents-862,745,097.2 -666,666,666.0 18.4 Median age for Other race residents18.3 17.5 23.0 Median age for Two or more races residents27.8 19.4 22.1 Median age for White alone residents22.1 22.1 20.8 Median age for Hispanic or Latino residents19.7 22.3
Owner/renter occupied households by race in Whitewater
House owners and renters - White residents 1,314 30.0% Owner occupied3,060 70.0% Renter occupiedHouse owners and renters - Black or African American residents 68 57.8% Owner occupied50 42.2% Renter occupiedHouse owners and renters - American Indian / Alaska Native residents 59 100.0% Renter occupiedHouse owners and renters - Asian residents 16 7.6% Owner occupied195 92.4% Renter occupiedHouse owners and renters - Other race residents 18 64.5% Owner occupied10 35.5% Renter occupiedHouse owners and renters - Two or more races residents 123 43.7% Owner occupied159 56.3% Renter occupiedHouse owners and renters - White alone residents 1,291 29.7% Owner occupied3,051 70.3% Renter occupiedHouse owners and renters - Hispanic or Latino residents 160 52.8% Owner occupied144 47.2% Renter occupied
Language usage in Whitewater
English speakers - Total 87.4% of residents of Whitewater speak English at home.
6.6% of residents speak Spanish at home 610 60.6% Speak English very well397 39.4% Speak English less than very well5.9% of residents speak other language at home 558 62.0% Speak English very well342 38.0% Speak English less than very well
English speakers - Born in the United States 95.8% of residents of Whitewater speak English at home.
2.9% of residents speak Spanish at home 61 48.8% Speak English very well64 51.2% Speak English less than very well3.1% of residents speak other language at home 111 84.1% Speak English very well21 15.9% Speak English less than very well
English speakers - Native, born elsewhere 87.8% of residents of Whitewater speak English at home.
23.1% of residents speak Spanish at home 16 47.1% Speak English very well18 52.9% Speak English less than very well5.4% of residents speak other language at home 8 100.0% Speak English less than very well
English speakers - Foreign-born 9.0% of residents of Whitewater speak English at home.
41.4% of residents speak Spanish at home 259 50.1% Speak English very well258 49.9% Speak English less than very well33.0% of residents speak other language at home 210 51.0% Speak English very well202 49.0% Speak English less than very well
White (Caucasian) - Speak only English Native:
96.2% (11,851)Foreign-born:
15.2% (33)
White (Caucasian) - Speak another language Native:
3.6% (446)Foreign-born:
100.0% (215)
Black or African American - Speak another language Native:
8.3% (54)Foreign-born:
100.0% (22)
Asian - Speak only English Native:
66.8% (192)Foreign-born:
33.9% (94)
Asian - Speak another language Native:
34.1% (98)Foreign-born:
65.7% (183)
Other race - Speak another language Native:
35.1% (65)Foreign-born:
100.0% (21)
Two or more races - Speak only English Native:
89.6% (532)Foreign-born:
2.0% (15)
Two or more races - Speak another language Native:
5.6% (33)Foreign-born:
100.0% (720)
White alone - Speak only English Native:
97.0% (11,706)Foreign-born:
12.4% (36)
White alone - Speak another language Native:
3.6% (435)Foreign-born:
58.2% (167)
Hispanic or Latino - Speak only English Native:
55.6% (454)Foreign-born:
1.8% (10)
Hispanic or Latino - Speak another language Native:
45.5% (372)Foreign-born:
100.0% (561)
Foreign-born residents in Whitewater 1,176 residents are foreign born (3.1% Latin America , 2.1% Europe , 1.9% Asia ).
This city:
7.5%Wisconsin:
5.0%
Marital status for residents in Whitewater Marital status - White (Caucasian) population 15 years and over
Males 75.2% Never married18.3% Now married0.3% Separated1.3% Widowed4.9% DivorcedFemales 65.7% Never married21.7% Now married0.5% Separated5.1% Widowed7.0% DivorcedWomen who gave birth in the past 12 months Now married:
51.9% (64)Unmarried:
48.1% (59)
Women who did not give birth in the past 12 months Now married:
12.4% (535)Unmarried:
87.6% (3,792)
Marital status - Black or African American population 15 years and over
Males 84.3% Never married10.4% Now married0.0% Separated0.0% Widowed5.2% DivorcedFemales 69.5% Never married11.7% Now married0.0% Separated3.2% Widowed15.6% DivorcedWomen who did not give birth in the past 12 months Now married:
12.1% (32)Unmarried:
87.9% (231)
Marital status - American Indian / Alaska Native population 15 years and over
Males 0.0% Never married29.2% Now married0.0% Separated0.0% Widowed70.8% DivorcedFemales 73.8% Never married26.2% Now married0.0% Separated0.0% Widowed0.0% DivorcedWomen who did not give birth in the past 12 months Now married:
26.2% (10)Unmarried:
73.8% (29)
Marital status - Asian population 15 years and over
Males 85.8% Never married14.2% Now married0.0% Separated0.0% Widowed0.0% DivorcedFemales 58.3% Never married26.9% Now married12.6% Separated0.0% Widowed2.3% DivorcedWomen who gave birth in the past 12 months Now married:
19.0% (12)Unmarried:
81.0% (50)
Women who did not give birth in the past 12 months Now married:
35.5% (27)Unmarried:
64.5% (48)
Marital status - Other race population 15 years and over
Males 73.3% Never married20.7% Now married6.0% Separated0.0% Widowed0.0% DivorcedFemales 62.8% Never married37.2% Now married0.0% Separated0.0% Widowed0.0% DivorcedWomen who did not give birth in the past 12 months Now married:
27.9% (17)Unmarried:
72.1% (44)
Marital status - Two or more races population 15 years and over
Males 49.2% Never married46.4% Now married0.0% Separated0.0% Widowed4.3% DivorcedFemales 56.7% Never married34.2% Now married0.0% Separated0.0% Widowed9.2% DivorcedWomen who did not give birth in the past 12 months Now married:
32.0% (131)Unmarried:
68.0% (279)
Marital status - White alone, not Hispanic / Latino population 15 years and over
Males 74.6% Never married18.6% Now married0.4% Separated1.4% Widowed5.1% DivorcedFemales 65.3% Never married21.7% Now married0.5% Separated5.3% Widowed7.2% DivorcedWomen who gave birth in the past 12 months Now married:
51.9% (67)Unmarried:
48.1% (62)
Women who did not give birth in the past 12 months Now married:
12.0% (520)Unmarried:
88.0% (3,809)
Marital status - Hispanic or Latino population 15 years and over
Males 68.0% Never married31.0% Now married1.0% Separated0.0% Widowed0.0% DivorcedFemales 60.0% Never married33.6% Now married0.2% Separated0.0% Widowed6.2% DivorcedWomen who did not give birth in the past 12 months Now married:
32.3% (147)Unmarried:
67.7% (308)
Ancestries in Whitewater
2,158 30.2% German483 6.8% Irish420 5.9% English312 4.4% Albanian304 4.3% European283 4.0% Italian252 3.5% Polish212 3.0% American194 2.7% Norwegian57 0.8% Greek56 0.8% Russian52 0.7% French44 0.6% Dutch28 0.4% Lebanese26 0.4% Swiss22 0.3% Palestinian21 0.3% Scandinavian15 0.2% Liberian14 0.2% Czech14 0.2% African10 0.1% Danish10 0.1% Scottish8 0.1% Swedish5 0.07% French Canadian3 0.04% Welsh2 0.03% Austrian2 0.03% Northern European2 0.03% Portuguese2 0.03% Slovak2 0.03% Nigerian
Geographical mobility in Whitewater Same house 1 year ago 7,296 57.5% White (Caucasian)559 71.6% Black or African American39 58.7% American Indian / Alaska Native109 23.7% Asian137 67.1% Other race799 65.2% Two or more races7,197 57.7% White alone, not Hispanic / Latino1,169 73.0% Hispanic or LatinoMoved within same county 1,900 15.0% White / Caucasian16 2.0% Black or African American26 38.7% American Indian / Alaska Native24 5.3% Asian15 7.1% Other race95 7.7% Two or more races1,809 14.5% White alone, not Hispanic / Latino204 12.7% Hispanic or LatinoMoved within same state 1,847 14.6% White / Caucasian205 26.3% Black or African American264 57.2% Asian48 23.4% Other race183 14.9% Two or more races1,708 13.7% White alone, not Hispanic / Latino150 9.3% Hispanic or LatinoMoved from different state 804 6.3% White / Caucasian4 0.4% Black or African American28 6.0% Asian4 2.0% Other race83 6.7% Two or more races805 6.5% White alone, not Hispanic / Latino15 1.0% Hispanic or LatinoMoved from abroad 54 0.4% White76 16.4% Asian42 3.4% Two or more races54 0.4% White alone, not Hispanic / Latino42 2.6% Hispanic or Latino
Children Nativity (place of birth) in Whitewater
Children under 6 years - Living with two parents Both parents native 228 100.0% NativeBoth parents foreign-born 24 45.7% Native29 54.3% Foreign-bornOne native, one foreign-born parent 144 100.0% NativeChildren under 6 years - Living with one parent Native parent 133 100.0% NativeForeign-born parent 14 100.0% NativeChildren 6 to 17 years - Living with two parents Both parents native 437 100.0% NativeBoth parents foreign-born 48 40.6% Native70 59.4% Foreign-bornOne native, one foreign-born parent 124 100.0% NativeChildren 6 to 17 years - Living with one parent Native parent 352 100.0% NativeForeign-born parent 76 58.8% Native53 41.2% Foreign-born