Races in Weymouth Town, Massachusetts (MA) Detailed Stats
Data:
Races - White alone (%)
Races - White alone (% change since 2000)
Races - Black alone (%)
Races - Black alone (% change since 2000)
Races - American Indian alone (%)
Races - American Indian alone (% change since 2000)
Races - Asian alone (%)
Races - Asian alone (% change since 2000)
Races - Hispanic (%)
Races - Hispanic (% change since 2000)
Races - Native Hawaiian and Other Pacific Islander alone (%)
Races - Native Hawaiian and Other Pacific Islander alone (% change since 2000)
Races - Two or more races(%)
Races - Two or more races(% change since 2000)
Races - Other race alone (%)
Races - Other race alone (% change since 2000)
Racial diversity
Place of birth - Born in state of residence (%)
Place of birth - Born in state of residence (%) - White
Place of birth - Born in state of residence (%) - Black or African American
Place of birth - Born in state of residence (%) - Asian
Place of birth - Born in state of residence (%) - Hispanic or Latino
Place of birth - Born in state of residence (%) - American Indian and Alaska Native
Place of birth - Born in state of residence (%) - Multirace
Place of birth - Born in state of residence (%) - Other Race
Place of birth - Born in other state (%)
Place of birth - Born in other state (%) - White
Place of birth - Born in other state (%) - Black or African American
Place of birth - Born in other state (%) - Asian
Place of birth - Born in other state (%) - Hispanic or Latino
Place of birth - Born in other state (%) - American Indian and Alaska Native
Place of birth - Born in other state (%) - Multirace
Place of birth - Born in other state (%) - Other Race
Place of birth - Native, outside of US (%)
Place of birth - Native, outside of US (%) - White
Place of birth - Native, outside of US (%) - Black or African American
Place of birth - Native, outside of US (%) - Asian
Place of birth - Native, outside of US (%) - Hispanic or Latino
Place of birth - Native, outside of US (%) - American Indian and Alaska Native
Place of birth - Native, outside of US (%) - Multirace
Place of birth - Native, outside of US (%) - Other Race
Place of birth - Foreign born (%)
Place of birth - Foreign born (%) - White
Place of birth - Foreign born (%) - Black or African American
Place of birth - Foreign born (%) - Asian
Place of birth - Foreign born (%) - Hispanic or Latino
Place of birth - Foreign born (%) - American Indian and Alaska Native
Place of birth - Foreign born (%) - Multirace
Place of birth - Foreign born (%) - Other Race
Residents speaking English at home (%)
Residents speaking English at home - Born in the United States (%)
Residents speaking English at home - Native, born elsewhere (%)
Residents speaking English at home - Foreign born (%)
Residents speaking Spanish at home (%)
Residents speaking Spanish at home - Born in the United States (%)
Residents speaking Spanish at home - Native, born elsewhere (%)
Residents speaking Spanish at home - Foreign born (%)
Residents speaking other language at home (%)
Residents speaking other language at home - Born in the United States (%)
Residents speaking other language at home - Native, born elsewhere (%)
Residents speaking other language at home - Foreign born (%)
Marital status - Never married (%)
Marital status - Now married (%)
Marital status - Separated (%)
Marital status - Widowed (%)
Marital status - Divorced (%)
Ancestries Reported - Arab (%)
Ancestries Reported - Czech (%)
Ancestries Reported - Danish (%)
Ancestries Reported - Dutch (%)
Ancestries Reported - English (%)
Ancestries Reported - French (%)
Ancestries Reported - French Canadian (%)
Ancestries Reported - German (%)
Ancestries Reported - Greek (%)
Ancestries Reported - Hungarian (%)
Ancestries Reported - Irish (%)
Ancestries Reported - Italian (%)
Ancestries Reported - Lithuanian (%)
Ancestries Reported - Norwegian (%)
Ancestries Reported - Polish (%)
Ancestries Reported - Portuguese (%)
Ancestries Reported - Russian (%)
Ancestries Reported - Scotch-Irish (%)
Ancestries Reported - Scottish (%)
Ancestries Reported - Slovak (%)
Ancestries Reported - Subsaharan African (%)
Ancestries Reported - Swedish (%)
Ancestries Reported - Swiss (%)
Ancestries Reported - Ukrainian (%)
Ancestries Reported - United States (%)
Ancestries Reported - Welsh (%)
Ancestries Reported - West Indian (%)
Ancestries Reported - Other (%)
Geographical mobility - Same house 1 year ago (%)
Geographical mobility - Same house 1 year ago (%) - White
Geographical mobility - Same house 1 year ago (%) - Black or African American
Geographical mobility - Same house 1 year ago (%) - Asian
Geographical mobility - Same house 1 year ago (%) - Hispanic or Latino
Geographical mobility - Same house 1 year ago (%) - American Indian and Alaska Native
Geographical mobility - Same house 1 year ago (%) - Multirace
Geographical mobility - Same house 1 year ago (%) - Other Race
Geographical mobility - Moved within same county (%)
Geographical mobility - Moved within same county (%) - White
Geographical mobility - Moved within same county (%) - Black or African American
Geographical mobility - Moved within same county (%) - Asian
Geographical mobility - Moved within same county (%) - Hispanic or Latino
Geographical mobility - Moved within same county (%) - American Indian and Alaska Native
Geographical mobility - Moved within same county (%) - Multirace
Geographical mobility - Moved within same county (%) - Other Race
Geographical mobility - Moved from different county within same state (%)
Geographical mobility - Moved from different county within same state (%) - White
Geographical mobility - Moved from different county within same state (%) - Black or African American
Geographical mobility - Moved from different county within same state (%) - Asian
Geographical mobility - Moved from different county within same state (%) - Hispanic or Latino
Geographical mobility - Moved from different county within same state (%) - American Indian and Alaska Native
Geographical mobility - Moved from different county within same state (%) - Multirace
Geographical mobility - Moved from different county within same state (%) - Other Race
Geographical mobility - Moved from different state (%)
Geographical mobility - Moved from different state (%) - White
Geographical mobility - Moved from different state (%) - Black or African American
Geographical mobility - Moved from different state (%) - Asian
Geographical mobility - Moved from different state (%) - Hispanic or Latino
Geographical mobility - Moved from different state (%) - American Indian and Alaska Native
Geographical mobility - Moved from different state (%) - Multirace
Geographical mobility - Moved from different state (%) - Other Race
Geographical mobility - Moved from abroad (%)
Geographical mobility - Moved from abroad (%) - White
Geographical mobility - Moved from abroad (%) - Black or African American
Geographical mobility - Moved from abroad (%) - Asian
Geographical mobility - Moved from abroad (%) - Hispanic or Latino
Geographical mobility - Moved from abroad (%) - American Indian and Alaska Native
Geographical mobility - Moved from abroad (%) - Multirace
Geographical mobility - Moved from abroad (%) - Other Race
Place of birth for the foreign-born population - Ireland (%)
Place of birth for the foreign-born population - Denmark (%)
Place of birth for the foreign-born population - Norway (%)
Place of birth for the foreign-born population - Sweden (%)
Place of birth for the foreign-born population - United Kingdom (%)
Place of birth for the foreign-born population - England (%)
Place of birth for the foreign-born population - Scotland (%)
Place of birth for the foreign-born population - Other Northern Europe (%)
Place of birth for the foreign-born population - Austria (%)
Place of birth for the foreign-born population - Belgium (%)
Place of birth for the foreign-born population - France (%)
Place of birth for the foreign-born population - Germany (%)
Place of birth for the foreign-born population - Netherlands (%)
Place of birth for the foreign-born population - Switzerland (%)
Place of birth for the foreign-born population - Other Western Europe (%)
Place of birth for the foreign-born population - Greece (%)
Place of birth for the foreign-born population - Italy (%)
Place of birth for the foreign-born population - Portugal (%)
Place of birth for the foreign-born population - Spain (%)
Place of birth for the foreign-born population - Other Southern Europe (%)
Place of birth for the foreign-born population - Albania (%)
Place of birth for the foreign-born population - Belarus (%)
Place of birth for the foreign-born population - Bosnia and Herzegovina (%)
Place of birth for the foreign-born population - Bulgaria (%)
Place of birth for the foreign-born population - Croatia (%)
Place of birth for the foreign-born population - Czechoslovakia (%)
Place of birth for the foreign-born population - Hungary (%)
Place of birth for the foreign-born population - Latvia (%)
Place of birth for the foreign-born population - Lithuania (%)
Place of birth for the foreign-born population - North Macedonia (Macedonia) (%)
Place of birth for the foreign-born population - Moldova (%)
Place of birth for the foreign-born population - Poland (%)
Place of birth for the foreign-born population - Romania (%)
Place of birth for the foreign-born population - Russia (%)
Place of birth for the foreign-born population - Serbia (%)
Place of birth for the foreign-born population - Ukraine (%)
Place of birth for the foreign-born population - Other Eastern Europe (%)
Place of birth for the foreign-born population - China (%)
Place of birth for the foreign-born population - Hong Kong (%)
Place of birth for the foreign-born population - Taiwan (%)
Place of birth for the foreign-born population - Japan (%)
Place of birth for the foreign-born population - Korea (%)
Place of birth for the foreign-born population - Other Eastern Asia (%)
Place of birth for the foreign-born population - Afghanistan (%)
Place of birth for the foreign-born population - Bangladesh (%)
Place of birth for the foreign-born population - India (%)
Place of birth for the foreign-born population - Iran (%)
Place of birth for the foreign-born population - Kazakhstan (%)
Place of birth for the foreign-born population - Nepal (%)
Place of birth for the foreign-born population - Pakistan (%)
Place of birth for the foreign-born population - Sri Lanka (%)
Place of birth for the foreign-born population - Uzbekistan (%)
Place of birth for the foreign-born population - Other South Central Asia (%)
Place of birth for the foreign-born population - Burma (%)
Place of birth for the foreign-born population - Cambodia (%)
Place of birth for the foreign-born population - Indonesia (%)
Place of birth for the foreign-born population - Laos (%)
Place of birth for the foreign-born population - Malaysia (%)
Place of birth for the foreign-born population - Philippines (%)
Place of birth for the foreign-born population - Singapore (%)
Place of birth for the foreign-born population - Thailand (%)
Place of birth for the foreign-born population - Vietnam (%)
Place of birth for the foreign-born population - Other South Eastern Asia (%)
Place of birth for the foreign-born population - Armenia (%)
Place of birth for the foreign-born population - Iraq (%)
Place of birth for the foreign-born population - Israel (%)
Place of birth for the foreign-born population - Jordan (%)
Place of birth for the foreign-born population - Kuwait (%)
Place of birth for the foreign-born population - Lebanon (%)
Place of birth for the foreign-born population - Saudi Arabia (%)
Place of birth for the foreign-born population - Syria (%)
Place of birth for the foreign-born population - Turkey (%)
Place of birth for the foreign-born population - Yemen (%)
Place of birth for the foreign-born population - Other Western Asia (%)
Place of birth for the foreign-born population - Eritrea (%)
Place of birth for the foreign-born population - Ethiopia (%)
Place of birth for the foreign-born population - Kenya (%)
Place of birth for the foreign-born population - Somalia (%)
Place of birth for the foreign-born population - Uganda (%)
Place of birth for the foreign-born population - Zimbabwe (%)
Place of birth for the foreign-born population - Other Eastern Africa (%)
Place of birth for the foreign-born population - Cameroon (%)
Place of birth for the foreign-born population - Congo (%)
Place of birth for the foreign-born population - Democratic Republic of Congo (Zaire) (%)
Place of birth for the foreign-born population - Other Middle Africa (%)
Place of birth for the foreign-born population - Egypt (%)
Place of birth for the foreign-born population - Morocco (%)
Place of birth for the foreign-born population - Sudan (%)
Place of birth for the foreign-born population - Other Northern Africa (%)
Place of birth for the foreign-born population - South Africa (%)
Place of birth for the foreign-born population - Other Southern Africa (%)
Place of birth for the foreign-born population - Cabo Verde (%)
Place of birth for the foreign-born population - Ghana (%)
Place of birth for the foreign-born population - Liberia (%)
Place of birth for the foreign-born population - Nigeria (%)
Place of birth for the foreign-born population - Senegal (%)
Place of birth for the foreign-born population - Sierra Leone (%)
Place of birth for the foreign-born population - Other Western Africa (%)
Place of birth for the foreign-born population - Australia (%)
Place of birth for the foreign-born population - New Zealand (%)
Place of birth for the foreign-born population - Fiji (%)
Place of birth for the foreign-born population - Micronesia (%)
Place of birth for the foreign-born population - Bahamas (%)
Place of birth for the foreign-born population - Barbados (%)
Place of birth for the foreign-born population - Cuba (%)
Place of birth for the foreign-born population - Dominica (%)
Place of birth for the foreign-born population - Dominican Republic (%)
Place of birth for the foreign-born population - Grenada (%)
Place of birth for the foreign-born population - Haiti (%)
Place of birth for the foreign-born population - Jamaica (%)
Place of birth for the foreign-born population - St. Vincent and the Grenadines (%)
Place of birth for the foreign-born population - Trinidad and Tobago (%)
Place of birth for the foreign-born population - West Indies (%)
Place of birth for the foreign-born population - Other Caribbean (%)
Place of birth for the foreign-born population - Belize (%)
Place of birth for the foreign-born population - Costa Rica (%)
Place of birth for the foreign-born population - El Salvador (%)
Place of birth for the foreign-born population - Guatemala (%)
Place of birth for the foreign-born population - Honduras (%)
Place of birth for the foreign-born population - Mexico (%)
Place of birth for the foreign-born population - Nicaragua (%)
Place of birth for the foreign-born population - Panama (%)
Place of birth for the foreign-born population - Other Central America (%)
Place of birth for the foreign-born population - Argentina (%)
Place of birth for the foreign-born population - Bolivia (%)
Place of birth for the foreign-born population - Brazil (%)
Place of birth for the foreign-born population - Chile (%)
Place of birth for the foreign-born population - Colombia (%)
Place of birth for the foreign-born population - Ecuador (%)
Place of birth for the foreign-born population - Guyana (%)
Place of birth for the foreign-born population - Peru (%)
Place of birth for the foreign-born population - Uruguay (%)
Place of birth for the foreign-born population - Venezuela (%)
Place of birth for the foreign-born population - Other South America (%)
Place of birth for the foreign-born population - Canada (%)
Place of birth for the foreign-born population - Other Northern America (%)
Place of birth for the foreign-born population - Other (%)
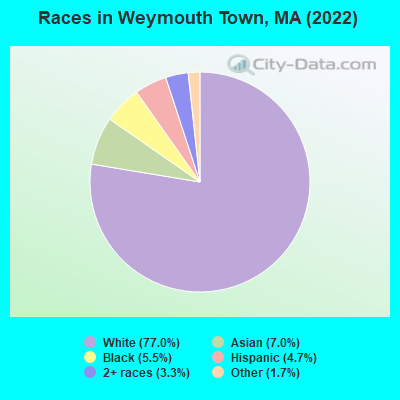
According to 2022 data, the most numerous races in Weymouth Town, MA are White alone (44,340 residents), Hispanic (2,687 residents), and Asian alone (4,035 residents). 83.1% of Weymouth Town residents speak English at home.
Race distribution in Weymouth Town 44,340 77.0% White alone 4,035 7.0% Asian alone 3,155 5.5% Black alone 2,687 4.7% Hispanic 1,902 3.3% Two or more races 1,000 1.7% Other race alone 27 0.05% American Indian alone
2000 2022
5,198,359 81.9% White alone 428,729 6.8% Hispanic 318,329 5.0% Black alone 236,786 3.7% Asian alone 110,338 1.7% Two or more races 43,586 0.7% Other race alone 11,264 0.2% American Indian alone 1,706 0.03% Native Hawaiian and Other
4,676,627 67.0% White alone 911,038 13.0% Hispanic 501,463 7.2% Asian alone 459,740 6.6% Black alone 341,889 4.9% Two or more races 84,403 1.2% Other race alone 5,838 0.08% American Indian alone 976 0.01% Native Hawaiian and Other
Income and house value in Weymouth Town Median household income in 2022 $93,367 White non-Hispanic householders$74,092 Black householders$97,101 Asian householders$63,499 Some other race householders$83,386 Two or more races householders$73,031 Hispanic or Latino race householders
Median age by race in Weymouth Town
48.8 Median age for White residents46.4 50.7 30.9 Median age for Black or African American residents18.9 37.7 -655,238,094.6 Median age for American Indian / Alaska Native residents-649,474,688.9 -657,223,795.4 35.2 Median age for Asian residents34.9 35.3 -514,227,641.8 Median age for Native Hawaiian / Pacific Islander residents-513,131,312.6 -508,717,948.2 36.4 Median age for Other race residents41.1 32.7 36.3 Median age for Two or more races residents40.3 34.7 49.2 Median age for White alone residents46.4 51.4 35.6 Median age for Hispanic or Latino residents33.3 34.7
Owner/renter occupied households by race in Weymouth Town
House owners and renters - White residents 14,938 72.2% Owner occupied5,762 27.8% Renter occupiedHouse owners and renters - Black or African American residents 357 41.1% Owner occupied513 58.9% Renter occupiedHouse owners and renters - American Indian / Alaska Native residents 22 100.0% Owner occupiedHouse owners and renters - Asian residents 980 61.6% Owner occupied610 38.4% Renter occupiedHouse owners and renters - Other race residents 185 41.2% Owner occupied264 58.8% Renter occupiedHouse owners and renters - Two or more races residents 414 43.9% Owner occupied530 56.1% Renter occupiedHouse owners and renters - White alone residents 14,773 72.0% Owner occupied5,743 28.0% Renter occupiedHouse owners and renters - Hispanic or Latino residents 546 63.6% Owner occupied313 36.4% Renter occupied
Language usage in Weymouth Town
English speakers - Total 83.1% of residents of Weymouth Town speak English at home.
3.2% of residents speak Spanish at home 1,143 64.3% Speak English very well634 35.7% Speak English less than very well13.2% of residents speak other language at home 4,043 55.7% Speak English very well3,214 44.3% Speak English less than very well
English speakers - Born in the United States 94.1% of residents of Weymouth Town speak English at home.
4.0% of residents speak Spanish at home 265 92.7% Speak English very well21 7.3% Speak English less than very well1.6% of residents speak other language at home 104 88.9% Speak English very well13 11.1% Speak English less than very well
English speakers - Native, born elsewhere 63.2% of residents of Weymouth Town speak English at home.
20.9% of residents speak Spanish at home 137 55.9% Speak English very well108 44.1% Speak English less than very well15.2% of residents speak other language at home 128 71.9% Speak English very well50 28.1% Speak English less than very well
English speakers - Foreign-born 20.4% of residents of Weymouth Town speak English at home.
7.6% of residents speak Spanish at home 298 46.0% Speak English very well350 54.0% Speak English less than very well72.0% of residents speak other language at home 3,324 54.3% Speak English very well2,801 45.7% Speak English less than very well
White (Caucasian) - Speak only English Native:
98.2% (39,816)Foreign-born:
36.9% (1,015)
White (Caucasian) - Speak another language Native:
1.8% (712)Foreign-born:
62.9% (1,727)
Black or African American - Speak only English Native:
88.6% (1,727)Foreign-born:
9.8% (104)
Black or African American - Speak another language Native:
10.8% (210)Foreign-born:
95.7% (1,013)
Asian - Speak only English Native:
36.9% (277)Foreign-born:
12.8% (384)
Asian - Speak another language Native:
62.8% (471)Foreign-born:
87.4% (2,614)
Other race - Speak only English Native:
53.8% (368)Foreign-born:
9.3% (79)
Other race - Speak another language Native:
45.9% (314)Foreign-born:
90.6% (769)
Two or more races - Speak only English Native:
73.0% (1,445)Foreign-born:
15.5% (129)
Two or more races - Speak another language Native:
27.6% (546)Foreign-born:
84.9% (705)
White alone - Speak only English Native:
98.4% (39,412)Foreign-born:
38.1% (1,023)
White alone - Speak another language Native:
1.5% (594)Foreign-born:
61.1% (1,642)
Hispanic or Latino - Speak only English Native:
48.1% (831)Foreign-born:
4.3% (31)
Hispanic or Latino - Speak another language Native:
52.3% (904)Foreign-born:
96.9% (682)
Foreign-born residents in Weymouth Town
Marital status for residents in Weymouth Town Marital status - White (Caucasian) population 15 years and over
Males 35.2% Never married49.5% Now married0.8% Separated3.5% Widowed11.1% DivorcedFemales 30.6% Never married46.8% Now married1.9% Separated7.7% Widowed13.0% DivorcedWomen who gave birth in the past 12 months Now married:
83.7% (300)Unmarried:
16.3% (58)
Women who did not give birth in the past 12 months Now married:
41.7% (3,535)Unmarried:
58.3% (4,948)
Marital status - Black or African American population 15 years and over
Males 39.4% Never married51.2% Now married3.2% Separated0.0% Widowed6.2% DivorcedFemales 41.3% Never married44.7% Now married1.9% Separated6.2% Widowed5.9% DivorcedWomen who gave birth in the past 12 months Now married:
100.0% (101)Unmarried:
0.0% (0)
Women who did not give birth in the past 12 months Now married:
26.8% (177)Unmarried:
73.2% (484)
Marital status - American Indian / Alaska Native population 15 years and over
Males 0.0% Never married100.0% Now married0.0% Separated0.0% Widowed0.0% DivorcedFemales 0.0% Never married0.0% Now married0.0% Separated100.0% Widowed0.0% DivorcedMarital status - Asian population 15 years and over
Males 24.4% Never married70.0% Now married3.3% Separated0.0% Widowed2.4% DivorcedFemales 21.5% Never married67.9% Now married0.0% Separated6.8% Widowed3.8% DivorcedWomen who gave birth in the past 12 months Now married:
88.0% (77)Unmarried:
12.0% (11)
Women who did not give birth in the past 12 months Now married:
69.3% (880)Unmarried:
30.7% (389)
Marital status - Other race population 15 years and over
Males 48.6% Never married43.1% Now married0.0% Separated0.0% Widowed8.4% DivorcedFemales 43.2% Never married56.2% Now married0.6% Separated0.0% Widowed0.0% DivorcedWomen who gave birth in the past 12 months Now married:
100.0% (35)Unmarried:
0.0% (0)
Women who did not give birth in the past 12 months Now married:
51.2% (326)Unmarried:
48.8% (310)
Marital status - Two or more races population 15 years and over
Males 46.3% Never married52.6% Now married0.0% Separated0.0% Widowed1.1% DivorcedFemales 33.0% Never married51.7% Now married0.0% Separated2.2% Widowed13.1% DivorcedWomen who gave birth in the past 12 months Now married:
100.0% (28)Unmarried:
0.0% (0)
Women who did not give birth in the past 12 months Now married:
51.9% (257)Unmarried:
48.1% (239)
Marital status - White alone, not Hispanic / Latino population 15 years and over
Males 35.1% Never married49.4% Now married0.8% Separated3.5% Widowed11.1% DivorcedFemales 30.3% Never married46.7% Now married1.9% Separated7.9% Widowed13.1% DivorcedWomen who gave birth in the past 12 months Now married:
83.7% (304)Unmarried:
16.3% (59)
Women who did not give birth in the past 12 months Now married:
41.6% (3,419)Unmarried:
58.4% (4,800)
Marital status - Hispanic or Latino population 15 years and over
Males 33.6% Never married63.1% Now married0.0% Separated0.0% Widowed3.3% DivorcedFemales 38.2% Never married51.0% Now married1.4% Separated2.6% Widowed6.8% DivorcedWomen who gave birth in the past 12 months Now married:
100.0% (38)Unmarried:
0.0% (0)
Women who did not give birth in the past 12 months Now married:
50.8% (421)Unmarried:
49.2% (408)
Ancestries in Weymouth Town
8,574 30.7% Irish2,091 7.5% Italian1,963 7.0% American1,114 4.0% English1,027 3.7% Brazilian693 2.5% Haitian678 2.4% Kenyan443 1.6% Polish421 1.5% Scottish406 1.5% Greek393 1.4% French Canadian343 1.2% European340 1.2% Albanian321 1.1% Cape Verdean283 1.0% French282 1.0% Portuguese278 1.0% African204 0.7% German159 0.6% British159 0.6% Swedish123 0.4% Canadian101 0.4% Bulgarian99 0.4% Lithuanian97 0.3% Romanian91 0.3% Moroccan81 0.3% Russian78 0.3% Nigerian75 0.3% Iranian71 0.3% Norwegian65 0.2% Dutch65 0.2% Sierra Leonean53 0.2% Turkish45 0.2% Czech43 0.2% Ukrainian41 0.1% Armenian40 0.1% Scotch-Irish38 0.1% Eastern European38 0.1% Arab35 0.1% Assyrian33 0.1% Hungarian32 0.1% Serbian29 0.1% Latvian19 0.07% Jamaican17 0.06% Welsh16 0.06% Iraqi13 0.05% Trinidadian and Tobagonian12 0.04% Danish11 0.04% Pennsylvania German10 0.04% Slovak9 0.03% Syrian9 0.03% Barbadian5 0.02% Lebanese4 0.01% Australian2 0.01% Slavic
Geographical mobility in Weymouth Town Same house 1 year ago 40,353 90.3% White (Caucasian)2,007 63.7% Black or African American51 100.0% American Indian / Alaska Native3,516 88.6% Asian1,063 84.2% Other race2,598 84.7% Two or more races39,785 90.3% White alone, not Hispanic / Latino2,290 86.5% Hispanic or LatinoMoved within same county 1,306 2.9% White / Caucasian1,019 32.4% Black or African American84 2.1% Asian51 4.0% Other race245 8.0% Two or more races1,325 3.0% White alone, not Hispanic / Latino173 6.5% Hispanic or LatinoMoved within same state 1,861 4.2% White / Caucasian118 3.7% Black or African American174 4.4% Asian96 7.6% Other race171 5.6% Two or more races1,903 4.3% White alone, not Hispanic / Latino46 1.7% Hispanic or LatinoMoved from different state 852 1.9% White / Caucasian3 0.1% Black or African American177 4.5% Asian43 3.4% Other race36 1.2% Two or more races743 1.7% White alone, not Hispanic / Latino139 5.2% Hispanic or LatinoMoved from abroad 232 0.5% White7 0.2% Asian18 1.4% Other race219 0.5% White alone, not Hispanic / Latino41 1.6% Hispanic or Latino
Children Nativity (place of birth) in Weymouth Town
Children under 6 years - Living with two parents Both parents native 1,706 100.0% NativeBoth parents foreign-born 599 100.0% NativeOne native, one foreign-born parent 645 100.0% NativeChildren under 6 years - Living with one parent Native parent 214 100.0% NativeForeign-born parent 70 84.0% Native13 16.0% Foreign-bornChildren 6 to 17 years - Living with two parents Both parents native 3,079 99.2% Native24 0.8% Foreign-bornBoth parents foreign-born 662 83.5% Native131 16.5% Foreign-bornOne native, one foreign-born parent 467 100.0% NativeChildren 6 to 17 years - Living with one parent Native parent 1,266 100.0% NativeForeign-born parent 383 52.2% Native350 47.8% Foreign-born
Grandparents responsible for own grandchildren in Weymouth Town
Grandparents (30 to 59 years) White / Caucasian 16 65.2% Responsible for grandchildren9 34.8% Not responsible for grandchildrenAsian 14 100.0% Not responsible for grandchildrenWhite alone, not Hispanic / Latino 18 65.6% Responsible for grandchildren10 34.4% Not responsible for grandchildrenGrandparents (60 years and over) White / Caucasian 86 27.0% Responsible for grandchildren232 73.0% Not responsible for grandchildrenAsian 10 100.0% Not responsible for grandchildrenWhite alone, not Hispanic / Latino 86 27.0% Responsible for grandchildren233 73.0% Not responsible for grandchildren