Races in West University Place, Texas (TX) Detailed Stats
Data:
Races - White alone (%)
Races - White alone (% change since 2000)
Races - Black alone (%)
Races - Black alone (% change since 2000)
Races - American Indian alone (%)
Races - American Indian alone (% change since 2000)
Races - Asian alone (%)
Races - Asian alone (% change since 2000)
Races - Hispanic (%)
Races - Hispanic (% change since 2000)
Races - Native Hawaiian and Other Pacific Islander alone (%)
Races - Native Hawaiian and Other Pacific Islander alone (% change since 2000)
Races - Two or more races(%)
Races - Two or more races(% change since 2000)
Races - Other race alone (%)
Races - Other race alone (% change since 2000)
Racial diversity
Place of birth - Born in state of residence (%)
Place of birth - Born in state of residence (%) - White
Place of birth - Born in state of residence (%) - Black or African American
Place of birth - Born in state of residence (%) - Asian
Place of birth - Born in state of residence (%) - Hispanic or Latino
Place of birth - Born in state of residence (%) - American Indian and Alaska Native
Place of birth - Born in state of residence (%) - Multirace
Place of birth - Born in state of residence (%) - Other Race
Place of birth - Born in other state (%)
Place of birth - Born in other state (%) - White
Place of birth - Born in other state (%) - Black or African American
Place of birth - Born in other state (%) - Asian
Place of birth - Born in other state (%) - Hispanic or Latino
Place of birth - Born in other state (%) - American Indian and Alaska Native
Place of birth - Born in other state (%) - Multirace
Place of birth - Born in other state (%) - Other Race
Place of birth - Native, outside of US (%)
Place of birth - Native, outside of US (%) - White
Place of birth - Native, outside of US (%) - Black or African American
Place of birth - Native, outside of US (%) - Asian
Place of birth - Native, outside of US (%) - Hispanic or Latino
Place of birth - Native, outside of US (%) - American Indian and Alaska Native
Place of birth - Native, outside of US (%) - Multirace
Place of birth - Native, outside of US (%) - Other Race
Place of birth - Foreign born (%)
Place of birth - Foreign born (%) - White
Place of birth - Foreign born (%) - Black or African American
Place of birth - Foreign born (%) - Asian
Place of birth - Foreign born (%) - Hispanic or Latino
Place of birth - Foreign born (%) - American Indian and Alaska Native
Place of birth - Foreign born (%) - Multirace
Place of birth - Foreign born (%) - Other Race
Residents speaking English at home (%)
Residents speaking English at home - Born in the United States (%)
Residents speaking English at home - Native, born elsewhere (%)
Residents speaking English at home - Foreign born (%)
Residents speaking Spanish at home (%)
Residents speaking Spanish at home - Born in the United States (%)
Residents speaking Spanish at home - Native, born elsewhere (%)
Residents speaking Spanish at home - Foreign born (%)
Residents speaking other language at home (%)
Residents speaking other language at home - Born in the United States (%)
Residents speaking other language at home - Native, born elsewhere (%)
Residents speaking other language at home - Foreign born (%)
Marital status - Never married (%)
Marital status - Now married (%)
Marital status - Separated (%)
Marital status - Widowed (%)
Marital status - Divorced (%)
Ancestries Reported - Arab (%)
Ancestries Reported - Czech (%)
Ancestries Reported - Danish (%)
Ancestries Reported - Dutch (%)
Ancestries Reported - English (%)
Ancestries Reported - French (%)
Ancestries Reported - French Canadian (%)
Ancestries Reported - German (%)
Ancestries Reported - Greek (%)
Ancestries Reported - Hungarian (%)
Ancestries Reported - Irish (%)
Ancestries Reported - Italian (%)
Ancestries Reported - Lithuanian (%)
Ancestries Reported - Norwegian (%)
Ancestries Reported - Polish (%)
Ancestries Reported - Portuguese (%)
Ancestries Reported - Russian (%)
Ancestries Reported - Scotch-Irish (%)
Ancestries Reported - Scottish (%)
Ancestries Reported - Slovak (%)
Ancestries Reported - Subsaharan African (%)
Ancestries Reported - Swedish (%)
Ancestries Reported - Swiss (%)
Ancestries Reported - Ukrainian (%)
Ancestries Reported - United States (%)
Ancestries Reported - Welsh (%)
Ancestries Reported - West Indian (%)
Ancestries Reported - Other (%)
Geographical mobility - Same house 1 year ago (%)
Geographical mobility - Same house 1 year ago (%) - White
Geographical mobility - Same house 1 year ago (%) - Black or African American
Geographical mobility - Same house 1 year ago (%) - Asian
Geographical mobility - Same house 1 year ago (%) - Hispanic or Latino
Geographical mobility - Same house 1 year ago (%) - American Indian and Alaska Native
Geographical mobility - Same house 1 year ago (%) - Multirace
Geographical mobility - Same house 1 year ago (%) - Other Race
Geographical mobility - Moved within same county (%)
Geographical mobility - Moved within same county (%) - White
Geographical mobility - Moved within same county (%) - Black or African American
Geographical mobility - Moved within same county (%) - Asian
Geographical mobility - Moved within same county (%) - Hispanic or Latino
Geographical mobility - Moved within same county (%) - American Indian and Alaska Native
Geographical mobility - Moved within same county (%) - Multirace
Geographical mobility - Moved within same county (%) - Other Race
Geographical mobility - Moved from different county within same state (%)
Geographical mobility - Moved from different county within same state (%) - White
Geographical mobility - Moved from different county within same state (%) - Black or African American
Geographical mobility - Moved from different county within same state (%) - Asian
Geographical mobility - Moved from different county within same state (%) - Hispanic or Latino
Geographical mobility - Moved from different county within same state (%) - American Indian and Alaska Native
Geographical mobility - Moved from different county within same state (%) - Multirace
Geographical mobility - Moved from different county within same state (%) - Other Race
Geographical mobility - Moved from different state (%)
Geographical mobility - Moved from different state (%) - White
Geographical mobility - Moved from different state (%) - Black or African American
Geographical mobility - Moved from different state (%) - Asian
Geographical mobility - Moved from different state (%) - Hispanic or Latino
Geographical mobility - Moved from different state (%) - American Indian and Alaska Native
Geographical mobility - Moved from different state (%) - Multirace
Geographical mobility - Moved from different state (%) - Other Race
Geographical mobility - Moved from abroad (%)
Geographical mobility - Moved from abroad (%) - White
Geographical mobility - Moved from abroad (%) - Black or African American
Geographical mobility - Moved from abroad (%) - Asian
Geographical mobility - Moved from abroad (%) - Hispanic or Latino
Geographical mobility - Moved from abroad (%) - American Indian and Alaska Native
Geographical mobility - Moved from abroad (%) - Multirace
Geographical mobility - Moved from abroad (%) - Other Race
Place of birth for the foreign-born population - Ireland (%)
Place of birth for the foreign-born population - Denmark (%)
Place of birth for the foreign-born population - Norway (%)
Place of birth for the foreign-born population - Sweden (%)
Place of birth for the foreign-born population - United Kingdom (%)
Place of birth for the foreign-born population - England (%)
Place of birth for the foreign-born population - Scotland (%)
Place of birth for the foreign-born population - Other Northern Europe (%)
Place of birth for the foreign-born population - Austria (%)
Place of birth for the foreign-born population - Belgium (%)
Place of birth for the foreign-born population - France (%)
Place of birth for the foreign-born population - Germany (%)
Place of birth for the foreign-born population - Netherlands (%)
Place of birth for the foreign-born population - Switzerland (%)
Place of birth for the foreign-born population - Other Western Europe (%)
Place of birth for the foreign-born population - Greece (%)
Place of birth for the foreign-born population - Italy (%)
Place of birth for the foreign-born population - Portugal (%)
Place of birth for the foreign-born population - Spain (%)
Place of birth for the foreign-born population - Other Southern Europe (%)
Place of birth for the foreign-born population - Albania (%)
Place of birth for the foreign-born population - Belarus (%)
Place of birth for the foreign-born population - Bosnia and Herzegovina (%)
Place of birth for the foreign-born population - Bulgaria (%)
Place of birth for the foreign-born population - Croatia (%)
Place of birth for the foreign-born population - Czechoslovakia (%)
Place of birth for the foreign-born population - Hungary (%)
Place of birth for the foreign-born population - Latvia (%)
Place of birth for the foreign-born population - Lithuania (%)
Place of birth for the foreign-born population - North Macedonia (Macedonia) (%)
Place of birth for the foreign-born population - Moldova (%)
Place of birth for the foreign-born population - Poland (%)
Place of birth for the foreign-born population - Romania (%)
Place of birth for the foreign-born population - Russia (%)
Place of birth for the foreign-born population - Serbia (%)
Place of birth for the foreign-born population - Ukraine (%)
Place of birth for the foreign-born population - Other Eastern Europe (%)
Place of birth for the foreign-born population - China (%)
Place of birth for the foreign-born population - Hong Kong (%)
Place of birth for the foreign-born population - Taiwan (%)
Place of birth for the foreign-born population - Japan (%)
Place of birth for the foreign-born population - Korea (%)
Place of birth for the foreign-born population - Other Eastern Asia (%)
Place of birth for the foreign-born population - Afghanistan (%)
Place of birth for the foreign-born population - Bangladesh (%)
Place of birth for the foreign-born population - India (%)
Place of birth for the foreign-born population - Iran (%)
Place of birth for the foreign-born population - Kazakhstan (%)
Place of birth for the foreign-born population - Nepal (%)
Place of birth for the foreign-born population - Pakistan (%)
Place of birth for the foreign-born population - Sri Lanka (%)
Place of birth for the foreign-born population - Uzbekistan (%)
Place of birth for the foreign-born population - Other South Central Asia (%)
Place of birth for the foreign-born population - Burma (%)
Place of birth for the foreign-born population - Cambodia (%)
Place of birth for the foreign-born population - Indonesia (%)
Place of birth for the foreign-born population - Laos (%)
Place of birth for the foreign-born population - Malaysia (%)
Place of birth for the foreign-born population - Philippines (%)
Place of birth for the foreign-born population - Singapore (%)
Place of birth for the foreign-born population - Thailand (%)
Place of birth for the foreign-born population - Vietnam (%)
Place of birth for the foreign-born population - Other South Eastern Asia (%)
Place of birth for the foreign-born population - Armenia (%)
Place of birth for the foreign-born population - Iraq (%)
Place of birth for the foreign-born population - Israel (%)
Place of birth for the foreign-born population - Jordan (%)
Place of birth for the foreign-born population - Kuwait (%)
Place of birth for the foreign-born population - Lebanon (%)
Place of birth for the foreign-born population - Saudi Arabia (%)
Place of birth for the foreign-born population - Syria (%)
Place of birth for the foreign-born population - Turkey (%)
Place of birth for the foreign-born population - Yemen (%)
Place of birth for the foreign-born population - Other Western Asia (%)
Place of birth for the foreign-born population - Eritrea (%)
Place of birth for the foreign-born population - Ethiopia (%)
Place of birth for the foreign-born population - Kenya (%)
Place of birth for the foreign-born population - Somalia (%)
Place of birth for the foreign-born population - Uganda (%)
Place of birth for the foreign-born population - Zimbabwe (%)
Place of birth for the foreign-born population - Other Eastern Africa (%)
Place of birth for the foreign-born population - Cameroon (%)
Place of birth for the foreign-born population - Congo (%)
Place of birth for the foreign-born population - Democratic Republic of Congo (Zaire) (%)
Place of birth for the foreign-born population - Other Middle Africa (%)
Place of birth for the foreign-born population - Egypt (%)
Place of birth for the foreign-born population - Morocco (%)
Place of birth for the foreign-born population - Sudan (%)
Place of birth for the foreign-born population - Other Northern Africa (%)
Place of birth for the foreign-born population - South Africa (%)
Place of birth for the foreign-born population - Other Southern Africa (%)
Place of birth for the foreign-born population - Cabo Verde (%)
Place of birth for the foreign-born population - Ghana (%)
Place of birth for the foreign-born population - Liberia (%)
Place of birth for the foreign-born population - Nigeria (%)
Place of birth for the foreign-born population - Senegal (%)
Place of birth for the foreign-born population - Sierra Leone (%)
Place of birth for the foreign-born population - Other Western Africa (%)
Place of birth for the foreign-born population - Australia (%)
Place of birth for the foreign-born population - New Zealand (%)
Place of birth for the foreign-born population - Fiji (%)
Place of birth for the foreign-born population - Micronesia (%)
Place of birth for the foreign-born population - Bahamas (%)
Place of birth for the foreign-born population - Barbados (%)
Place of birth for the foreign-born population - Cuba (%)
Place of birth for the foreign-born population - Dominica (%)
Place of birth for the foreign-born population - Dominican Republic (%)
Place of birth for the foreign-born population - Grenada (%)
Place of birth for the foreign-born population - Haiti (%)
Place of birth for the foreign-born population - Jamaica (%)
Place of birth for the foreign-born population - St. Vincent and the Grenadines (%)
Place of birth for the foreign-born population - Trinidad and Tobago (%)
Place of birth for the foreign-born population - West Indies (%)
Place of birth for the foreign-born population - Other Caribbean (%)
Place of birth for the foreign-born population - Belize (%)
Place of birth for the foreign-born population - Costa Rica (%)
Place of birth for the foreign-born population - El Salvador (%)
Place of birth for the foreign-born population - Guatemala (%)
Place of birth for the foreign-born population - Honduras (%)
Place of birth for the foreign-born population - Mexico (%)
Place of birth for the foreign-born population - Nicaragua (%)
Place of birth for the foreign-born population - Panama (%)
Place of birth for the foreign-born population - Other Central America (%)
Place of birth for the foreign-born population - Argentina (%)
Place of birth for the foreign-born population - Bolivia (%)
Place of birth for the foreign-born population - Brazil (%)
Place of birth for the foreign-born population - Chile (%)
Place of birth for the foreign-born population - Colombia (%)
Place of birth for the foreign-born population - Ecuador (%)
Place of birth for the foreign-born population - Guyana (%)
Place of birth for the foreign-born population - Peru (%)
Place of birth for the foreign-born population - Uruguay (%)
Place of birth for the foreign-born population - Venezuela (%)
Place of birth for the foreign-born population - Other South America (%)
Place of birth for the foreign-born population - Canada (%)
Place of birth for the foreign-born population - Other Northern America (%)
Place of birth for the foreign-born population - Other (%)
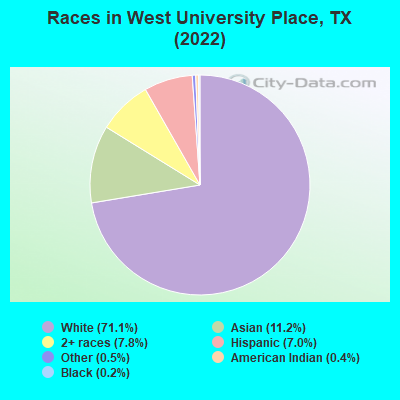
According to 2022 data, the most numerous races in West University Place, TX are Hispanic (1,064 residents), White alone (10,768 residents), and Black alone (31 residents). 79.3% of West University Place residents speak English at home. 16.6% of West University Place, TX residents are foreign-born (7.8% born in Asia, 3.1% born in Europe, 2.7% born in North America, 1.9% born in Latin America), which is 2.2% less than the foreign-born rate of 17.0% across the entire state of Texas.
Race distribution in West University Place
2000 2022
10,933,313 52.4% White alone 6,669,666 32.0% Hispanic 2,364,255 11.3% Black alone 554,445 2.7% Asian alone 230,567 1.1% Two or more races 68,859 0.3% American Indian alone 19,958 0.10% Other race alone 10,757 0.05% Native Hawaiian and Other
12,070,642 40.2% Hispanic 11,683,430 38.9% White alone 3,508,706 11.7% Black alone 1,608,173 5.4% Asian alone 956,560 3.2% Two or more races 125,763 0.4% Other race alone 47,023 0.2% American Indian alone 29,275 0.10% Native Hawaiian and Other
Income and house value in West University Place Median household income in 2022 over $200,000 White non-Hispanic householdersover $200,000 Asian householdersover $200,000 Two or more races householdersover $200,000 Hispanic or Latino race householdersMedian 2022 house value over $1,000,000 White Non-Hispanic householders$927,648 Black or African American householders over $1,000,000 Asian householdersover $1,000,000 Some other race householders$267,987 Two or more races householdersover $1,000,000 Hispanic or Latino householders
Median age by race in West University Place
47.6 Median age for White residents48.6 46.4 -676,676,676.0 Median age for Black or African American residents-672,975,814.3 -678,260,868.9 12.0 Median age for American Indian / Alaska Native residents-598,187,310.6 -652,037,616.9 43.6 Median age for Asian residents41.8 43.6 -782,795,698.1 Median age for Native Hawaiian / Pacific Islander residents-633,771,929.2 -816,367,264.7 50.6 Median age for Other race residents49.7 58.7 16.5 Median age for Two or more races residents16.7 16.6 44.7 Median age for White alone residents46.2 43.0 36.9 Median age for Hispanic or Latino residents40.6 15.1
Owner/renter occupied households by race in West University Place
House owners and renters - White residents 3,467 93.7% Owner occupied235 6.3% Renter occupiedHouse owners and renters - Asian residents 550 95.0% Owner occupied29 5.0% Renter occupiedHouse owners and renters - Other race residents 50 100.0% Owner occupiedHouse owners and renters - Two or more races residents 304 74.9% Owner occupied102 25.1% Renter occupiedHouse owners and renters - White alone residents 3,915 92.8% Owner occupied302 7.2% Renter occupiedHouse owners and renters - Hispanic or Latino residents 305 96.9% Owner occupied10 3.1% Renter occupied
Language usage in West University Place
English speakers - Total 79.3% of residents of West University Place speak English at home.
6.9% of residents speak Spanish at home 963 98.9% Speak English very well11 1.1% Speak English less than very well13.2% of residents speak other language at home 1,691 91.3% Speak English very well162 8.7% Speak English less than very well
English speakers - Born in the United States 88.0% of residents of West University Place speak English at home.
9.4% of residents speak Spanish at home 436 100.0% Speak English very well2.3% of residents speak other language at home 95 89.6% Speak English very well11 10.4% Speak English less than very well
English speakers - Native, born elsewhere 71.2% of residents of West University Place speak English at home.
17.3% of residents speak Spanish at home 45 100.0% Speak English very well10.4% of residents speak other language at home 27 100.0% Speak English very well
English speakers - Foreign-born 38.6% of residents of West University Place speak English at home.
8.7% of residents speak Spanish at home 219 100.0% Speak English very well49.7% of residents speak other language at home 1,103 88.2% Speak English very well148 11.8% Speak English less than very well
White (Caucasian) - Speak only English Native:
100.0% (7,900)Foreign-born:
100.0% (530)
White (Caucasian) - Speak another language Native:
4.6% (361)Foreign-born:
32.4% (172)
American Indian / Alaska Native - Speak another language Native:
42.8% (41)Foreign-born:
98.9% (23)
Asian - Speak only English Native:
53.5% (331)Foreign-born:
16.6% (159)
Asian - Speak another language Native:
46.6% (288)Foreign-born:
83.5% (800)
Other race - Speak another language Native:
10.3% (22)Foreign-born:
100.0% (18)
Two or more races - Speak only English Native:
67.3% (970)Foreign-born:
32.2% (156)
Two or more races - Speak another language Native:
29.1% (419)Foreign-born:
67.5% (327)
White alone - Speak only English Native:
92.6% (8,436)Foreign-born:
66.9% (642)
White alone - Speak another language Native:
7.5% (683)Foreign-born:
34.9% (335)
Hispanic or Latino - Speak only English Native:
60.6% (477)Foreign-born:
10.4% (22)
Hispanic or Latino - Speak another language Native:
38.5% (303)Foreign-born:
89.9% (191)
Foreign-born residents in West University Place 2,517 residents are foreign born (7.8% Asia , 3.1% Europe , 2.7% North America , 1.9% Latin America ).
This city:
16.6%Texas:
17.1%
Marital status for residents in West University Place Marital status - White (Caucasian) population 15 years and over
Males 19.4% Never married75.2% Now married0.2% Separated0.8% Widowed4.4% DivorcedFemales 11.5% Never married79.5% Now married0.2% Separated3.1% Widowed5.7% DivorcedWomen who gave birth in the past 12 months Now married:
100.0% (56)Unmarried:
0.0% (0)
Women who did not give birth in the past 12 months Now married:
81.7% (1,104)Unmarried:
18.3% (247)
Marital status - American Indian / Alaska Native population 15 years and over
Males 0.0% Never married100.0% Now married0.0% Separated0.0% Widowed0.0% DivorcedFemales 0.0% Never married100.0% Now married0.0% Separated0.0% Widowed0.0% DivorcedWomen who did not give birth in the past 12 months Now married:
100.0% (24)Unmarried:
0.0% (0)
Marital status - Asian population 15 years and over
Males 13.7% Never married80.4% Now married0.0% Separated2.7% Widowed3.2% DivorcedFemales 6.7% Never married85.6% Now married1.4% Separated6.4% Widowed0.0% DivorcedWomen who gave birth in the past 12 months Now married:
100.0% (19)Unmarried:
0.0% (0)
Women who did not give birth in the past 12 months Now married:
93.5% (307)Unmarried:
6.5% (21)
Marital status - Other race population 15 years and over
Males 35.3% Never married64.7% Now married0.0% Separated0.0% Widowed0.0% DivorcedFemales 0.0% Never married100.0% Now married0.0% Separated0.0% Widowed0.0% DivorcedWomen who did not give birth in the past 12 months Now married:
100.0% (17)Unmarried:
0.0% (0)
Marital status - Two or more races population 15 years and over
Males 54.0% Never married46.0% Now married0.0% Separated0.0% Widowed0.0% DivorcedFemales 30.9% Never married61.1% Now married0.0% Separated4.6% Widowed3.4% DivorcedWomen who did not give birth in the past 12 months Now married:
51.3% (211)Unmarried:
48.7% (201)
Marital status - White alone, not Hispanic / Latino population 15 years and over
Males 19.3% Never married75.3% Now married0.2% Separated0.8% Widowed4.4% DivorcedFemales 11.6% Never married79.3% Now married0.3% Separated3.1% Widowed5.8% DivorcedWomen who gave birth in the past 12 months Now married:
100.0% (76)Unmarried:
0.0% (0)
Women who did not give birth in the past 12 months Now married:
81.1% (1,441)Unmarried:
18.9% (336)
Marital status - Hispanic or Latino population 15 years and over
Males 43.2% Never married55.2% Now married0.0% Separated0.0% Widowed1.6% DivorcedFemales 6.4% Never married86.9% Now married0.0% Separated6.8% Widowed0.0% DivorcedWomen who did not give birth in the past 12 months Now married:
82.9% (129)Unmarried:
17.1% (27)
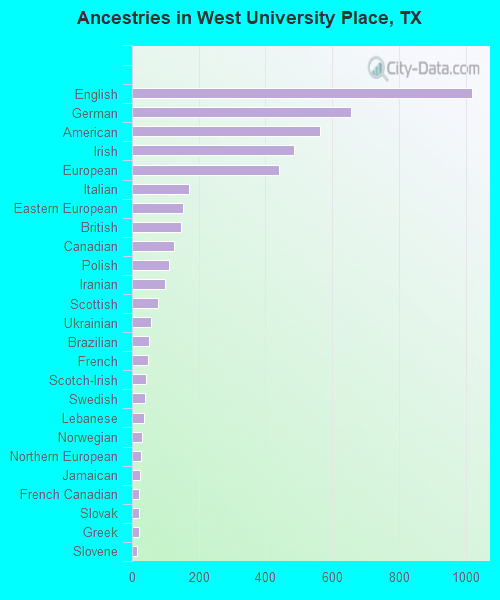
Ancestries in West University Place
1,019 14.9% English657 9.6% German563 8.3% American486 7.1% Irish442 6.5% European172 2.5% Italian154 2.3% Eastern European146 2.1% British126 1.8% Canadian112 1.6% Polish99 1.5% Iranian79 1.2% Scottish58 0.9% Ukrainian50 0.7% Brazilian49 0.7% French43 0.6% Scotch-Irish39 0.6% Swedish36 0.5% Lebanese29 0.4% Norwegian26 0.4% Northern European23 0.3% Jamaican21 0.3% French Canadian20 0.3% Slovak20 0.3% Greek16 0.2% Slovene16 0.2% Czech13 0.2% Arab12 0.2% Australian12 0.2% Soviet Union11 0.2% Portuguese10 0.1% Croatian10 0.1% Belgian8 0.1% Finnish7 0.1% Russian
Geographical mobility in West University Place Same house 1 year ago 7,486 89.1% White (Caucasian)32 100.0% Black or African American143 100.0% American Indian / Alaska Native1,437 84.2% Asian240 98.4% Other race1,840 80.6% Two or more races9,583 89.4% White alone, not Hispanic / Latino1,068 100.0% Hispanic or LatinoMoved within same county 668 8.0% White / Caucasian132 7.7% Asian211 9.2% Two or more races923 8.6% White alone, not Hispanic / LatinoMoved within same state 58 0.7% White / Caucasian10 0.6% Asian173 7.6% Two or more races62 0.6% White alone, not Hispanic / LatinoMoved from different state 160 1.9% White / Caucasian25 1.1% Two or more races159 1.5% White alone, not Hispanic / LatinoMoved from abroad 5 0.1% White140 8.2% Asian6 0.1% White alone, not Hispanic / Latino
Children Nativity (place of birth) in West University Place
Children under 6 years - Living with two parents Both parents native 689 100.0% NativeBoth parents foreign-born 273 100.0% NativeOne native, one foreign-born parent 301 100.0% NativeChildren under 6 years - Living with one parent Native parent 31 100.0% NativeChildren 6 to 17 years - Living with two parents Both parents native 2,201 99.7% Native7 0.3% Foreign-bornBoth parents foreign-born 354 67.3% Native172 32.7% Foreign-bornOne native, one foreign-born parent 257 100.0% NativeChildren 6 to 17 years - Living with one parent Native parent 118 100.0% NativeForeign-born parent 53 50.8% Native51 49.2% Foreign-born