Races in Weslaco, Texas (TX) Detailed Stats
Data:
Races - White alone (%)
Races - White alone (% change since 2000)
Races - Black alone (%)
Races - Black alone (% change since 2000)
Races - American Indian alone (%)
Races - American Indian alone (% change since 2000)
Races - Asian alone (%)
Races - Asian alone (% change since 2000)
Races - Hispanic (%)
Races - Hispanic (% change since 2000)
Races - Native Hawaiian and Other Pacific Islander alone (%)
Races - Native Hawaiian and Other Pacific Islander alone (% change since 2000)
Races - Two or more races(%)
Races - Two or more races(% change since 2000)
Races - Other race alone (%)
Races - Other race alone (% change since 2000)
Racial diversity
Place of birth - Born in state of residence (%)
Place of birth - Born in state of residence (%) - White
Place of birth - Born in state of residence (%) - Black or African American
Place of birth - Born in state of residence (%) - Asian
Place of birth - Born in state of residence (%) - Hispanic or Latino
Place of birth - Born in state of residence (%) - American Indian and Alaska Native
Place of birth - Born in state of residence (%) - Multirace
Place of birth - Born in state of residence (%) - Other Race
Place of birth - Born in other state (%)
Place of birth - Born in other state (%) - White
Place of birth - Born in other state (%) - Black or African American
Place of birth - Born in other state (%) - Asian
Place of birth - Born in other state (%) - Hispanic or Latino
Place of birth - Born in other state (%) - American Indian and Alaska Native
Place of birth - Born in other state (%) - Multirace
Place of birth - Born in other state (%) - Other Race
Place of birth - Native, outside of US (%)
Place of birth - Native, outside of US (%) - White
Place of birth - Native, outside of US (%) - Black or African American
Place of birth - Native, outside of US (%) - Asian
Place of birth - Native, outside of US (%) - Hispanic or Latino
Place of birth - Native, outside of US (%) - American Indian and Alaska Native
Place of birth - Native, outside of US (%) - Multirace
Place of birth - Native, outside of US (%) - Other Race
Place of birth - Foreign born (%)
Place of birth - Foreign born (%) - White
Place of birth - Foreign born (%) - Black or African American
Place of birth - Foreign born (%) - Asian
Place of birth - Foreign born (%) - Hispanic or Latino
Place of birth - Foreign born (%) - American Indian and Alaska Native
Place of birth - Foreign born (%) - Multirace
Place of birth - Foreign born (%) - Other Race
Residents speaking English at home (%)
Residents speaking English at home - Born in the United States (%)
Residents speaking English at home - Native, born elsewhere (%)
Residents speaking English at home - Foreign born (%)
Residents speaking Spanish at home (%)
Residents speaking Spanish at home - Born in the United States (%)
Residents speaking Spanish at home - Native, born elsewhere (%)
Residents speaking Spanish at home - Foreign born (%)
Residents speaking other language at home (%)
Residents speaking other language at home - Born in the United States (%)
Residents speaking other language at home - Native, born elsewhere (%)
Residents speaking other language at home - Foreign born (%)
Marital status - Never married (%)
Marital status - Now married (%)
Marital status - Separated (%)
Marital status - Widowed (%)
Marital status - Divorced (%)
Ancestries Reported - Arab (%)
Ancestries Reported - Czech (%)
Ancestries Reported - Danish (%)
Ancestries Reported - Dutch (%)
Ancestries Reported - English (%)
Ancestries Reported - French (%)
Ancestries Reported - French Canadian (%)
Ancestries Reported - German (%)
Ancestries Reported - Greek (%)
Ancestries Reported - Hungarian (%)
Ancestries Reported - Irish (%)
Ancestries Reported - Italian (%)
Ancestries Reported - Lithuanian (%)
Ancestries Reported - Norwegian (%)
Ancestries Reported - Polish (%)
Ancestries Reported - Portuguese (%)
Ancestries Reported - Russian (%)
Ancestries Reported - Scotch-Irish (%)
Ancestries Reported - Scottish (%)
Ancestries Reported - Slovak (%)
Ancestries Reported - Subsaharan African (%)
Ancestries Reported - Swedish (%)
Ancestries Reported - Swiss (%)
Ancestries Reported - Ukrainian (%)
Ancestries Reported - United States (%)
Ancestries Reported - Welsh (%)
Ancestries Reported - West Indian (%)
Ancestries Reported - Other (%)
Geographical mobility - Same house 1 year ago (%)
Geographical mobility - Same house 1 year ago (%) - White
Geographical mobility - Same house 1 year ago (%) - Black or African American
Geographical mobility - Same house 1 year ago (%) - Asian
Geographical mobility - Same house 1 year ago (%) - Hispanic or Latino
Geographical mobility - Same house 1 year ago (%) - American Indian and Alaska Native
Geographical mobility - Same house 1 year ago (%) - Multirace
Geographical mobility - Same house 1 year ago (%) - Other Race
Geographical mobility - Moved within same county (%)
Geographical mobility - Moved within same county (%) - White
Geographical mobility - Moved within same county (%) - Black or African American
Geographical mobility - Moved within same county (%) - Asian
Geographical mobility - Moved within same county (%) - Hispanic or Latino
Geographical mobility - Moved within same county (%) - American Indian and Alaska Native
Geographical mobility - Moved within same county (%) - Multirace
Geographical mobility - Moved within same county (%) - Other Race
Geographical mobility - Moved from different county within same state (%)
Geographical mobility - Moved from different county within same state (%) - White
Geographical mobility - Moved from different county within same state (%) - Black or African American
Geographical mobility - Moved from different county within same state (%) - Asian
Geographical mobility - Moved from different county within same state (%) - Hispanic or Latino
Geographical mobility - Moved from different county within same state (%) - American Indian and Alaska Native
Geographical mobility - Moved from different county within same state (%) - Multirace
Geographical mobility - Moved from different county within same state (%) - Other Race
Geographical mobility - Moved from different state (%)
Geographical mobility - Moved from different state (%) - White
Geographical mobility - Moved from different state (%) - Black or African American
Geographical mobility - Moved from different state (%) - Asian
Geographical mobility - Moved from different state (%) - Hispanic or Latino
Geographical mobility - Moved from different state (%) - American Indian and Alaska Native
Geographical mobility - Moved from different state (%) - Multirace
Geographical mobility - Moved from different state (%) - Other Race
Geographical mobility - Moved from abroad (%)
Geographical mobility - Moved from abroad (%) - White
Geographical mobility - Moved from abroad (%) - Black or African American
Geographical mobility - Moved from abroad (%) - Asian
Geographical mobility - Moved from abroad (%) - Hispanic or Latino
Geographical mobility - Moved from abroad (%) - American Indian and Alaska Native
Geographical mobility - Moved from abroad (%) - Multirace
Geographical mobility - Moved from abroad (%) - Other Race
Place of birth for the foreign-born population - Ireland (%)
Place of birth for the foreign-born population - Denmark (%)
Place of birth for the foreign-born population - Norway (%)
Place of birth for the foreign-born population - Sweden (%)
Place of birth for the foreign-born population - United Kingdom (%)
Place of birth for the foreign-born population - England (%)
Place of birth for the foreign-born population - Scotland (%)
Place of birth for the foreign-born population - Other Northern Europe (%)
Place of birth for the foreign-born population - Austria (%)
Place of birth for the foreign-born population - Belgium (%)
Place of birth for the foreign-born population - France (%)
Place of birth for the foreign-born population - Germany (%)
Place of birth for the foreign-born population - Netherlands (%)
Place of birth for the foreign-born population - Switzerland (%)
Place of birth for the foreign-born population - Other Western Europe (%)
Place of birth for the foreign-born population - Greece (%)
Place of birth for the foreign-born population - Italy (%)
Place of birth for the foreign-born population - Portugal (%)
Place of birth for the foreign-born population - Spain (%)
Place of birth for the foreign-born population - Other Southern Europe (%)
Place of birth for the foreign-born population - Albania (%)
Place of birth for the foreign-born population - Belarus (%)
Place of birth for the foreign-born population - Bosnia and Herzegovina (%)
Place of birth for the foreign-born population - Bulgaria (%)
Place of birth for the foreign-born population - Croatia (%)
Place of birth for the foreign-born population - Czechoslovakia (%)
Place of birth for the foreign-born population - Hungary (%)
Place of birth for the foreign-born population - Latvia (%)
Place of birth for the foreign-born population - Lithuania (%)
Place of birth for the foreign-born population - North Macedonia (Macedonia) (%)
Place of birth for the foreign-born population - Moldova (%)
Place of birth for the foreign-born population - Poland (%)
Place of birth for the foreign-born population - Romania (%)
Place of birth for the foreign-born population - Russia (%)
Place of birth for the foreign-born population - Serbia (%)
Place of birth for the foreign-born population - Ukraine (%)
Place of birth for the foreign-born population - Other Eastern Europe (%)
Place of birth for the foreign-born population - China (%)
Place of birth for the foreign-born population - Hong Kong (%)
Place of birth for the foreign-born population - Taiwan (%)
Place of birth for the foreign-born population - Japan (%)
Place of birth for the foreign-born population - Korea (%)
Place of birth for the foreign-born population - Other Eastern Asia (%)
Place of birth for the foreign-born population - Afghanistan (%)
Place of birth for the foreign-born population - Bangladesh (%)
Place of birth for the foreign-born population - India (%)
Place of birth for the foreign-born population - Iran (%)
Place of birth for the foreign-born population - Kazakhstan (%)
Place of birth for the foreign-born population - Nepal (%)
Place of birth for the foreign-born population - Pakistan (%)
Place of birth for the foreign-born population - Sri Lanka (%)
Place of birth for the foreign-born population - Uzbekistan (%)
Place of birth for the foreign-born population - Other South Central Asia (%)
Place of birth for the foreign-born population - Burma (%)
Place of birth for the foreign-born population - Cambodia (%)
Place of birth for the foreign-born population - Indonesia (%)
Place of birth for the foreign-born population - Laos (%)
Place of birth for the foreign-born population - Malaysia (%)
Place of birth for the foreign-born population - Philippines (%)
Place of birth for the foreign-born population - Singapore (%)
Place of birth for the foreign-born population - Thailand (%)
Place of birth for the foreign-born population - Vietnam (%)
Place of birth for the foreign-born population - Other South Eastern Asia (%)
Place of birth for the foreign-born population - Armenia (%)
Place of birth for the foreign-born population - Iraq (%)
Place of birth for the foreign-born population - Israel (%)
Place of birth for the foreign-born population - Jordan (%)
Place of birth for the foreign-born population - Kuwait (%)
Place of birth for the foreign-born population - Lebanon (%)
Place of birth for the foreign-born population - Saudi Arabia (%)
Place of birth for the foreign-born population - Syria (%)
Place of birth for the foreign-born population - Turkey (%)
Place of birth for the foreign-born population - Yemen (%)
Place of birth for the foreign-born population - Other Western Asia (%)
Place of birth for the foreign-born population - Eritrea (%)
Place of birth for the foreign-born population - Ethiopia (%)
Place of birth for the foreign-born population - Kenya (%)
Place of birth for the foreign-born population - Somalia (%)
Place of birth for the foreign-born population - Uganda (%)
Place of birth for the foreign-born population - Zimbabwe (%)
Place of birth for the foreign-born population - Other Eastern Africa (%)
Place of birth for the foreign-born population - Cameroon (%)
Place of birth for the foreign-born population - Congo (%)
Place of birth for the foreign-born population - Democratic Republic of Congo (Zaire) (%)
Place of birth for the foreign-born population - Other Middle Africa (%)
Place of birth for the foreign-born population - Egypt (%)
Place of birth for the foreign-born population - Morocco (%)
Place of birth for the foreign-born population - Sudan (%)
Place of birth for the foreign-born population - Other Northern Africa (%)
Place of birth for the foreign-born population - South Africa (%)
Place of birth for the foreign-born population - Other Southern Africa (%)
Place of birth for the foreign-born population - Cabo Verde (%)
Place of birth for the foreign-born population - Ghana (%)
Place of birth for the foreign-born population - Liberia (%)
Place of birth for the foreign-born population - Nigeria (%)
Place of birth for the foreign-born population - Senegal (%)
Place of birth for the foreign-born population - Sierra Leone (%)
Place of birth for the foreign-born population - Other Western Africa (%)
Place of birth for the foreign-born population - Australia (%)
Place of birth for the foreign-born population - New Zealand (%)
Place of birth for the foreign-born population - Fiji (%)
Place of birth for the foreign-born population - Micronesia (%)
Place of birth for the foreign-born population - Bahamas (%)
Place of birth for the foreign-born population - Barbados (%)
Place of birth for the foreign-born population - Cuba (%)
Place of birth for the foreign-born population - Dominica (%)
Place of birth for the foreign-born population - Dominican Republic (%)
Place of birth for the foreign-born population - Grenada (%)
Place of birth for the foreign-born population - Haiti (%)
Place of birth for the foreign-born population - Jamaica (%)
Place of birth for the foreign-born population - St. Vincent and the Grenadines (%)
Place of birth for the foreign-born population - Trinidad and Tobago (%)
Place of birth for the foreign-born population - West Indies (%)
Place of birth for the foreign-born population - Other Caribbean (%)
Place of birth for the foreign-born population - Belize (%)
Place of birth for the foreign-born population - Costa Rica (%)
Place of birth for the foreign-born population - El Salvador (%)
Place of birth for the foreign-born population - Guatemala (%)
Place of birth for the foreign-born population - Honduras (%)
Place of birth for the foreign-born population - Mexico (%)
Place of birth for the foreign-born population - Nicaragua (%)
Place of birth for the foreign-born population - Panama (%)
Place of birth for the foreign-born population - Other Central America (%)
Place of birth for the foreign-born population - Argentina (%)
Place of birth for the foreign-born population - Bolivia (%)
Place of birth for the foreign-born population - Brazil (%)
Place of birth for the foreign-born population - Chile (%)
Place of birth for the foreign-born population - Colombia (%)
Place of birth for the foreign-born population - Ecuador (%)
Place of birth for the foreign-born population - Guyana (%)
Place of birth for the foreign-born population - Peru (%)
Place of birth for the foreign-born population - Uruguay (%)
Place of birth for the foreign-born population - Venezuela (%)
Place of birth for the foreign-born population - Other South America (%)
Place of birth for the foreign-born population - Canada (%)
Place of birth for the foreign-born population - Other Northern America (%)
Place of birth for the foreign-born population - Other (%)
Latest news about races in Weslaco, TX collected exclusively by city-data.com from local newspapers, TV, and radio stations
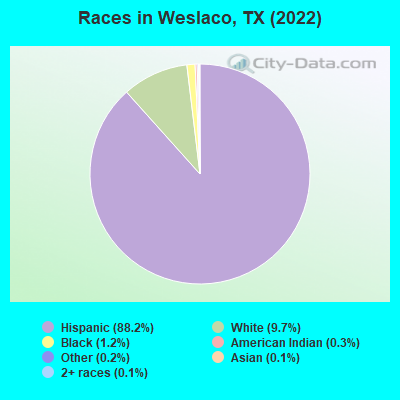
According to 2022 data, the most numerous races in Weslaco, TX are Hispanic (36,680 residents), White alone (4,013 residents), and Black alone (505 residents). 26.8% of Weslaco residents speak English at home. 16.0% of Weslaco, TX residents are foreign-born (14.7% born in Latin America), which is 6.2% less than the foreign-born rate of 17.0% across the entire state of Texas.
Race distribution in Weslaco
2000 2022
10,933,313 52.4% White alone 6,669,666 32.0% Hispanic 2,364,255 11.3% Black alone 554,445 2.7% Asian alone 230,567 1.1% Two or more races 68,859 0.3% American Indian alone 19,958 0.10% Other race alone 10,757 0.05% Native Hawaiian and Other
12,070,642 40.2% Hispanic 11,683,430 38.9% White alone 3,508,706 11.7% Black alone 1,608,173 5.4% Asian alone 956,560 3.2% Two or more races 125,763 0.4% Other race alone 47,023 0.2% American Indian alone 29,275 0.10% Native Hawaiian and Other
Income and house value in Weslaco Median household income in 2022 $42,099 White non-Hispanic householders$24,899 Some other race householders$59,495 Two or more races householders$55,434 Hispanic or Latino race householdersMedian 2022 house value $208,502 White Non-Hispanic householders$160,957 American Indian or Alaska Native householders $211,473 Asian householders$99,050 Some other race householders$176,558 Two or more races householders$114,651 Hispanic or Latino householders
Median age by race in Weslaco
32.5 Median age for White residents30.7 36.3 28.4 Median age for Black or African American residents41.6 12.8 23.5 Median age for American Indian / Alaska Native residents23.8 40.9 37.7 Median age for Asian residents-602,763,384.5 19.1 -581,560,283.1 Median age for Native Hawaiian / Pacific Islander residents-612,729,233.5 -577,777,777.2 41.8 Median age for Other race residents44.2 39.6 26.5 Median age for Two or more races residents26.8 25.9 60.3 Median age for White alone residents55.3 68.1 27.7 Median age for Hispanic or Latino residents27.0 28.2
Owner/renter occupied households by race in Weslaco
House owners and renters - White residents 2,342 61.5% Owner occupied1,466 38.5% Renter occupiedHouse owners and renters - Black or African American residents 14 12.1% Owner occupied102 87.9% Renter occupiedHouse owners and renters - American Indian / Alaska Native residents 84 26.7% Owner occupied232 73.3% Renter occupiedHouse owners and renters - Asian residents 10 21.4% Owner occupied36 78.6% Renter occupiedHouse owners and renters - Other race residents 776 60.4% Owner occupied509 39.6% Renter occupiedHouse owners and renters - Two or more races residents 4,031 58.3% Owner occupied2,885 41.7% Renter occupiedHouse owners and renters - White alone residents 1,357 54.9% Owner occupied1,113 45.1% Renter occupiedHouse owners and renters - Hispanic or Latino residents 6,461 60.8% Owner occupied4,158 39.2% Renter occupied
Language usage in Weslaco
English speakers - Total 26.8% of residents of Weslaco speak English at home.
72.9% of residents speak Spanish at home 19,390 69.0% Speak English very well8,729 31.0% Speak English less than very well0.5% of residents speak other language at home 159 85.9% Speak English very well26 14.1% Speak English less than very well
English speakers - Born in the United States 60.2% of residents of Weslaco speak English at home.
41.5% of residents speak Spanish at home 1,640 89.9% Speak English very well184 10.1% Speak English less than very well
English speakers - Native, born elsewhere 13.4% of residents of Weslaco speak English at home.
84.5% of residents speak Spanish at home 140 45.2% Speak English very well170 54.8% Speak English less than very well
English speakers - Foreign-born 10.9% of residents of Weslaco speak English at home.
86.6% of residents speak Spanish at home 1,558 27.4% Speak English very well4,125 72.6% Speak English less than very well2.9% of residents speak other language at home 165 87.3% Speak English very well24 12.7% Speak English less than very well
White (Caucasian) - Speak only English Native:
51.2% (5,157)Foreign-born:
19.5% (152)
White (Caucasian) - Speak another language Native:
52.9% (5,329)Foreign-born:
73.1% (573)
Black or African American - Speak another language Native:
31.3% (146)Foreign-born:
100.0% (68)
American Indian / Alaska Native - Speak another language Native:
94.0% (485)Foreign-born:
98.9% (206)
Other race - Speak only English Native:
18.9% (347)Foreign-born:
7.3% (101)
Other race - Speak another language Native:
80.7% (1,481)Foreign-born:
93.2% (1,294)
Two or more races - Speak only English Native:
20.1% (3,765)Foreign-born:
9.9% (502)
Two or more races - Speak another language Native:
79.1% (14,807)Foreign-born:
91.1% (4,615)
White alone - Speak only English Native:
90.1% (3,301)Foreign-born:
46.6% (134)
White alone - Speak another language Native:
10.0% (367)Foreign-born:
25.2% (73)
Hispanic or Latino - Speak only English Native:
21.0% (5,790)Foreign-born:
7.0% (429)
Hispanic or Latino - Speak another language Native:
79.0% (21,807)Foreign-born:
93.3% (5,692)
Foreign-born residents in Weslaco 6,655 residents are foreign born (14.7% Latin America ).
This city:
16.0%Texas:
17.1%
Marital status for residents in Weslaco Marital status - White (Caucasian) population 15 years and over
Males 37.9% Never married48.8% Now married1.8% Separated3.5% Widowed8.0% DivorcedFemales 29.0% Never married42.8% Now married4.5% Separated8.8% Widowed14.9% DivorcedWomen who gave birth in the past 12 months Now married:
56.1% (78)Unmarried:
43.9% (61)
Women who did not give birth in the past 12 months Now married:
41.8% (810)Unmarried:
58.2% (1,131)
Marital status - Black or African American population 15 years and over
Males 34.7% Never married43.7% Now married0.0% Separated0.0% Widowed21.6% DivorcedFemales 68.8% Never married31.2% Now married0.0% Separated0.0% Widowed0.0% DivorcedWomen who did not give birth in the past 12 months Now married:
31.2% (45)Unmarried:
68.7% (100)
Marital status - American Indian / Alaska Native population 15 years and over
Males 62.9% Never married29.5% Now married0.0% Separated0.0% Widowed7.6% DivorcedFemales 46.0% Never married31.7% Now married10.4% Separated7.9% Widowed4.0% DivorcedWomen who did not give birth in the past 12 months Now married:
35.4% (73)Unmarried:
64.6% (133)
Marital status - Asian population 15 years and over
Males 57.7% Never married42.3% Now married0.0% Separated0.0% Widowed0.0% DivorcedFemales 53.6% Never married46.4% Now married0.0% Separated0.0% Widowed0.0% DivorcedWomen who did not give birth in the past 12 months Now married:
0.0% (0)Unmarried:
100.0% (29)
Marital status - Other race population 15 years and over
Males 32.8% Never married55.2% Now married4.4% Separated2.4% Widowed5.2% DivorcedFemales 28.6% Never married44.6% Now married5.3% Separated11.2% Widowed10.3% DivorcedWomen who gave birth in the past 12 months Now married:
86.4% (51)Unmarried:
13.6% (8)
Women who did not give birth in the past 12 months Now married:
41.9% (333)Unmarried:
58.1% (462)
Marital status - Two or more races population 15 years and over
Males 33.6% Never married58.0% Now married3.4% Separated2.5% Widowed2.6% DivorcedFemales 37.7% Never married45.8% Now married2.9% Separated9.1% Widowed4.5% DivorcedWomen who gave birth in the past 12 months Now married:
76.9% (243)Unmarried:
23.1% (73)
Women who did not give birth in the past 12 months Now married:
48.9% (3,495)Unmarried:
51.1% (3,648)
Marital status - White alone, not Hispanic / Latino population 15 years and over
Males 28.3% Never married60.4% Now married2.3% Separated2.4% Widowed6.5% DivorcedFemales 10.3% Never married45.8% Now married0.4% Separated18.7% Widowed24.8% DivorcedWomen who gave birth in the past 12 months Now married:
12.5% (9)Unmarried:
87.5% (60)
Women who did not give birth in the past 12 months Now married:
22.4% (118)Unmarried:
77.6% (411)
Marital status - Hispanic or Latino population 15 years and over
Males 37.5% Never married51.0% Now married2.6% Separated3.1% Widowed5.8% DivorcedFemales 35.4% Never married43.6% Now married4.7% Separated7.6% Widowed8.5% DivorcedWomen who gave birth in the past 12 months Now married:
73.1% (368)Unmarried:
26.9% (136)
Women who did not give birth in the past 12 months Now married:
45.9% (4,141)Unmarried:
54.1% (4,883)
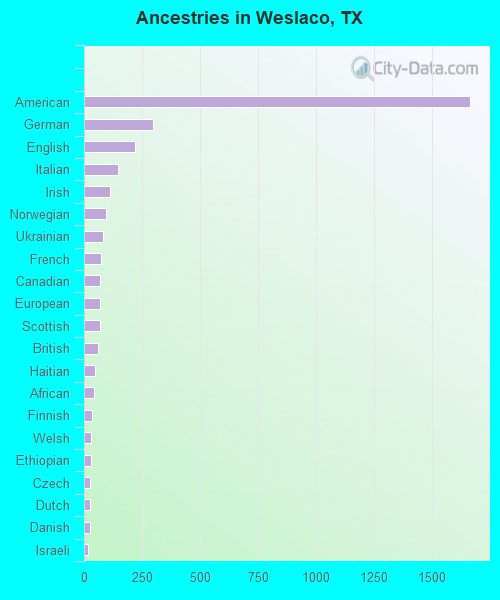
Ancestries in Weslaco
1,663 5.1% American297 0.9% German218 0.7% English146 0.5% Italian113 0.3% Irish93 0.3% Norwegian82 0.3% Ukrainian73 0.2% French70 0.2% Canadian67 0.2% European67 0.2% Scottish62 0.2% British46 0.1% Haitian42 0.1% African33 0.1% Finnish32 0.10% Welsh31 0.10% Ethiopian27 0.08% Czech27 0.08% Dutch26 0.08% Danish17 0.05% Israeli13 0.04% Polish11 0.03% Icelander9 0.03% Scotch-Irish8 0.02% Swiss3 0.01% Armenian3 0.01% Northern European
Geographical mobility in Weslaco Same house 1 year ago 8,103 82.0% White (Caucasian)178 32.6% Black or African American740 100.0% American Indian / Alaska Native37 41.2% Asian2,944 85.9% Other race22,778 87.1% Two or more races3,318 83.0% White alone, not Hispanic / Latino30,811 85.3% Hispanic or LatinoMoved within same county 1,356 13.7% White / Caucasian198 36.2% Black or African American8 1.1% American Indian / Alaska Native46 51.5% Asian313 9.1% Other race2,616 10.0% Two or more races233 5.8% White alone, not Hispanic / Latino4,251 11.8% Hispanic or LatinoMoved within same state 274 2.8% White / Caucasian140 25.6% Black or African American98 2.9% Other race160 0.6% Two or more races68 1.7% White alone, not Hispanic / Latino720 2.0% Hispanic or LatinoMoved from different state 316 3.2% White / Caucasian9 1.6% Black or African American206 0.8% Two or more races311 7.8% White alone, not Hispanic / Latino240 0.7% Hispanic or LatinoMoved from abroad 103 1.0% White64 1.9% Other race435 1.7% Two or more races185 4.6% White alone, not Hispanic / Latino334 0.9% Hispanic or Latino
Children Nativity (place of birth) in Weslaco
Children under 6 years - Living with two parents Both parents native 1,471 100.0% NativeBoth parents foreign-born 328 100.0% NativeOne native, one foreign-born parent 267 100.0% NativeChildren under 6 years - Living with one parent Native parent 1,357 99.4% Native9 0.6% Foreign-bornForeign-born parent 269 100.0% NativeChildren 6 to 17 years - Living with two parents Both parents native 3,214 99.9% Native3 0.1% Foreign-bornBoth parents foreign-born 753 79.4% Native195 20.6% Foreign-bornOne native, one foreign-born parent 1,205 96.7% Native41 3.3% Foreign-bornChildren 6 to 17 years - Living with one parent Native parent 2,634 100.0% NativeForeign-born parent 738 53.7% Native636 46.3% Foreign-born
Grandparents responsible for own grandchildren in Weslaco
Grandparents (30 to 59 years) White / Caucasian 62 39.4% Responsible for grandchildren95 60.6% Not responsible for grandchildrenOther race 71 63.6% Responsible for grandchildren41 36.4% Not responsible for grandchildrenTwo or more races 286 35.3% Responsible for grandchildren524 64.7% Not responsible for grandchildrenWhite alone, not Hispanic / Latino 75 100.0% Responsible for grandchildrenHispanic or Latino 325 40.1% Responsible for grandchildren487 59.9% Not responsible for grandchildrenGrandparents (60 years and over) White / Caucasian 11 11.8% Responsible for grandchildren81 88.2% Not responsible for grandchildrenOther race 67 97.2% Responsible for grandchildren2 2.8% Not responsible for grandchildrenTwo or more races 62 13.3% Responsible for grandchildren407 86.7% Not responsible for grandchildrenHispanic or Latino 119 27.2% Responsible for grandchildren317 72.8% Not responsible for grandchildren