Races in Walker Mill, Maryland (MD) Detailed Stats
Ancestries, Foreign-born residents, place of birth
Settings
X


Recent posts about races in Walker Mill, Maryland on our local forum with over 2,400,000 registered users:
 | Moving from Montgomery County to Prince Georges County, MD (97 replies) |
| Prince George's County in 5 to 10 Years (154 replies) |
| The Plight of Prince George's County (33 replies) |
| The Post’s View Galvanizing Prince George’s schools (31 replies) |
| PG vs. St. Mary's county (25 replies) |
| District Heights info needed (8 replies) |
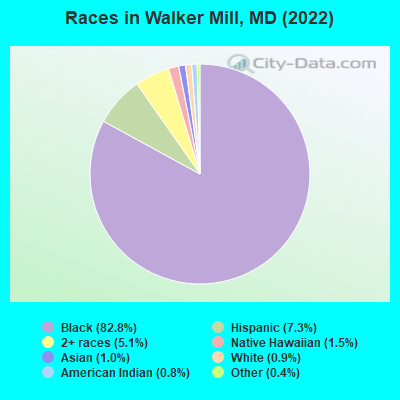
According to 2022 data, the most numerous races in Walker Mill, MD are White alone (91 residents), Black alone (8,165 residents), and Hispanic (719 residents). 86.0% of Walker Mill residents speak English at home. 8.1% of Walker Mill, MD residents are foreign-born (3.7% born in Latin America, 2.2% born in Asia, 0.9% born in Africa), which is 97.6% less than the foreign-born rate of 16.0% across the entire state of Maryland.
Race distribution in Walker Mill
2000
2022

- 10,50894.6%Black alone
- 2552.3%White alone
- 1631.5%Two or more races
- 1000.9%Hispanic
- 280.3%Asian alone
- 380.3%American Indian alone
- 110.10%Other race alone
- 10.01%Native Hawaiian and Other
Pacific Islander alone

-
- 8,16582.8%Black alone
- 7197.3%Hispanic
- 4995.1%Two or more races
- 1521.5%Native Hawaiian and Other
Pacific Islander alone - 991.0%Asian alone
- 910.9%White alone
- 790.8%American Indian alone
- 360.4%Other race alone
2000
2022
-
- 3,286,54762.1%White alone
- 1,464,73527.7%Black alone
- 227,9164.3%Hispanic
- 209,7384.0%Asian alone
- 82,9461.6%Two or more races
- 13,3120.3%American Indian alone
- 9,3790.2%Other race alone
- 1,9130.04%Native Hawaiian and Other
Pacific Islander alone

-
- 2,906,49247.1%White alone
- 1,800,91429.2%Black alone
- 705,84211.4%Hispanic
- 401,8186.5%Asian alone
- 291,3174.7%Two or more races
- 46,9300.8%Other race alone
- 8,9300.1%American Indian alone
- 2,4170.04%Native Hawaiian and Other
Pacific Islander alone

Income and house value in Walker Mill
- Median household income in 2022
- $68,095Black householders
- $196,506Some other race householders
- $89,941Two or more races householders
- Median 2022 house value
- $302,579White Non-Hispanic householders
- $370,186Black or African American householders
- $416,081American Indian or Alaska Native householders
- $388,049Two or more races householders
Household income for White non-Hispanic householders

Household income for Black householders

Household income for Asian householders

Household income for Some other race householders

Household income for Two or more races householders

Household income for Hispanic or Latino race householders

Median age by race in Walker Mill
- 37.3Median age for White residents
- 37.8Males
- -669,753,085.7Females
- 41.7Median age for Black or African American residents
- 40.7Males
- 43.9Females
- -780,410,741.7Median age for American Indian / Alaska Native residents
- -888,297,871.5Males
- -689,905,591.2Females
- 54.8Median age for Asian residents
- 24.5Males
- -716,586,150.7Females
- -571,600,480.8Median age for Native Hawaiian / Pacific Islander residents
- -720,061,021.4Males
- -760,942,760.2Females
- 59.8Median age for Other race residents
- 58.0Males
- 41.3Females
- 29.4Median age for Two or more races residents
- 29.3Males
- 49.0Females
- 36.6Median age for White alone residents
- 35.8Males
- -650,340,135.4Females
- 39.2Median age for Hispanic or Latino residents
- 39.8Males
- 30.9Females
Owner/renter occupied households by race in Walker Mill
- House owners and renters - White residents
- 60100.0%Owner occupied
- House owners and renters - Black or African American residents
- 1,99051.9%Owner occupied
- 1,84048.1%Renter occupied
- House owners and renters - American Indian / Alaska Native residents
- 45100.0%Renter occupied
- House owners and renters - Asian residents
- 82100.0%Owner occupied
- House owners and renters - Other race residents
- 64100.0%Owner occupied
- House owners and renters - Two or more races residents
- 248100.0%Owner occupied
- House owners and renters - White alone residents
- 63100.0%Owner occupied
- House owners and renters - Hispanic or Latino residents
- 11376.3%Owner occupied
- 3523.7%Renter occupied
Language usage in Walker Mill
- English speakers - Total
- 86.0% of residents of Walker Mill speak English at home.
- 5.1% of residents speak Spanish at home
- 41987.5%Speak English very well
- 6012.5%Speak English less than very well
- 6.9% of residents speak other language at home
- 54784.0%Speak English very well
- 10416.0%Speak English less than very well
- English speakers - Born in the United States
- 94.8% of residents of Walker Mill speak English at home.
- 3.2% of residents speak Spanish at home
- 177100.0%Speak English very well
- 1.3% of residents speak other language at home
- 73100.0%Speak English very well
- English speakers - Native, born elsewhere
- 25.0% of residents of Walker Mill speak English at home.
- 29.8% of residents speak other language at home
- 50100.0%Speak English very well
- English speakers - Foreign-born
- 20.7% of residents of Walker Mill speak English at home.
- 27.0% of residents speak Spanish at home
- 15972.6%Speak English very well
- 6027.4%Speak English less than very well
- 52.6% of residents speak other language at home
- 32275.6%Speak English very well
- 10424.4%Speak English less than very well
Black or African American - Speak only English
| Native: | 96.6% (7,303) |
| Foreign-born: | 22.1% (71) |
Black or African American - Speak another language
| Native: | 3.3% (247) |
| Foreign-born: | 79.9% (256) |
Asian - Speak another language
| Native: | 100.0% (14) |
| Foreign-born: | 97.1% (83) |
Other race - Speak only English
| Native: | 18.0% (34) |
| Foreign-born: | 22.6% (51) |
Other race - Speak another language
| Native: | 82.2% (153) |
| Foreign-born: | 74.0% (167) |
Two or more races - Speak only English
| Native: | 83.7% (308) |
| Foreign-born: | 84.5% (44) |
Hispanic or Latino - Speak only English
| Native: | 39.7% (150) |
| Foreign-born: | 16.8% (49) |
Hispanic or Latino - Speak another language
| Native: | 61.7% (234) |
| Foreign-born: | 80.4% (233) |
Foreign-born residents in Walker Mill
799 residents are foreign born (3.7% Latin America, 2.2% Asia, 0.9% Africa).
| This city: | 8.1% |
| Maryland: | 15.7% |


Marital status for residents in Walker Mill
Marital status - White (Caucasian) population 15 years and over
- Males
- 62.0%Never married
- 38.0%Now married
- 0.0%Separated
- 0.0%Widowed
- 0.0%Divorced
- Females
- 0.0%Never married
- 52.9%Now married
- 0.0%Separated
- 0.0%Widowed
- 47.1%Divorced
Women who did not give birth in the past 12 months
| Now married: | 100.0% (8) |
| Unmarried: | 0.0% (0) |
Marital status - Black or African American population 15 years and over
- Males
- 40.8%Never married
- 40.6%Now married
- 2.2%Separated
- 3.5%Widowed
- 12.9%Divorced
- Females
- 43.7%Never married
- 25.6%Now married
- 4.7%Separated
- 9.5%Widowed
- 16.4%Divorced
Women who gave birth in the past 12 months
| Now married: | 0.0% (0) |
| Unmarried: | 100.0% (63) |
Women who did not give birth in the past 12 months
| Now married: | 29.0% (548) |
| Unmarried: | 71.0% (1,342) |
Marital status - American Indian / Alaska Native population 15 years and over
- Males
- 0.0%Never married
- 100.0%Now married
- 0.0%Separated
- 0.0%Widowed
- 0.0%Divorced
- Females
- 100.0%Never married
- 0.0%Now married
- 0.0%Separated
- 0.0%Widowed
- 0.0%Divorced
Women who did not give birth in the past 12 months
| Now married: | 0.0% (0) |
| Unmarried: | 100.0% (76) |
Marital status - Asian population 15 years and over
- Males
- 60.6%Never married
- 39.4%Now married
- 0.0%Separated
- 0.0%Widowed
- 0.0%Divorced
- Females
- 0.0%Never married
- 100.0%Now married
- 0.0%Separated
- 0.0%Widowed
- 0.0%Divorced
Marital status - Native Hawaiian / Pacific Islander population 15 years and over
- Males
- 0.0%Never married
- 100.0%Now married
- 0.0%Separated
- 0.0%Widowed
- 0.0%Divorced
- Females
- 0.0%Never married
- 100.0%Now married
- 0.0%Separated
- 0.0%Widowed
- 0.0%Divorced
Marital status - Other race population 15 years and over
- Males
- 0.0%Never married
- 72.5%Now married
- 0.0%Separated
- 17.5%Widowed
- 9.9%Divorced
- Females
- 13.3%Never married
- 77.1%Now married
- 0.0%Separated
- 0.0%Widowed
- 9.5%Divorced
Women who did not give birth in the past 12 months
| Now married: | 76.9% (103) |
| Unmarried: | 23.1% (31) |
Marital status - Two or more races population 15 years and over
- Males
- 57.3%Never married
- 13.7%Now married
- 0.0%Separated
- 0.0%Widowed
- 29.0%Divorced
- Females
- 42.9%Never married
- 11.6%Now married
- 0.0%Separated
- 19.7%Widowed
- 25.9%Divorced
Women who did not give birth in the past 12 months
| Now married: | 0.0% (0) |
| Unmarried: | 100.0% (89) |
Marital status - White alone, not Hispanic / Latino population 15 years and over
- Males
- 62.0%Never married
- 38.0%Now married
- 0.0%Separated
- 0.0%Widowed
- 0.0%Divorced
- Females
- 0.0%Never married
- 52.9%Now married
- 0.0%Separated
- 0.0%Widowed
- 47.1%Divorced
Women who did not give birth in the past 12 months
| Now married: | 100.0% (9) |
| Unmarried: | 0.0% (0) |
Marital status - Hispanic or Latino population 15 years and over
- Males
- 0.0%Never married
- 79.3%Now married
- 0.0%Separated
- 13.2%Widowed
- 7.5%Divorced
- Females
- 38.4%Never married
- 55.7%Now married
- 0.0%Separated
- 0.0%Widowed
- 6.0%Divorced
Women who did not give birth in the past 12 months
| Now married: | 48.6% (126) |
| Unmarried: | 51.4% (133) |
Ancestries in Walker Mill

- 2403.3%American
- 1081.5%African
- 1061.5%Nigerian
- 811.1%Belizean
- 260.4%Guyanese
- 250.3%Jamaican
- 200.3%Trinidadian and Tobagonian
- 80.1%Irish
- 20.03%German

Geographical mobility in Walker Mill

- Same house 1 year ago
- 7992.2%White (Caucasian)
- 8,15297.5%Black or African American
- 12398.9%American Indian / Alaska Native
- 8987.5%Asian
- 143100.0%Native Hawaiian / Pacific Islander
- 424100.0%Other race
- 31057.9%Two or more races
- 8492.4%White alone, not Hispanic / Latino
- 718100.0%Hispanic or Latino

-
- Moved within same county
- 78.0%White / Caucasian
- 2533.0%Black or African American
- 7514.1%Two or more races
- 88.4%White alone, not Hispanic / Latino

-
- Moved within same state
- 11.0%White / Caucasian
- 190.2%Black or African American
- 10.9%White alone, not Hispanic / Latino

-
- Moved from different state
- 560.7%Black or African American
- 87.5%Asian
- 13324.7%Two or more races

-
- Moved from abroad
- 120.1%Black or African American

Children Nativity (place of birth) in Walker Mill
Place of birth for residents in Walker Mill
![Place of birth for the foreign-born population - Regions]()
- 396Americas
- 396Latin America
- 236Asia
- 201South Eastern Asia
- 141South America
- 139Central America
- 115Caribbean
- 100Africa
- 66Europe
- 65Western Africa
- 38Western Europe
- 35Eastern Asia
- 35China
- 35Middle Africa
- 27Southern Europe

![Place of birth for the foreign-born population - Countries]()
- 201Philippines
- 139El Salvador
- 86Peru
- 70Dominican Republic
- 65Nigeria
- 38France
- 37Guyana
- 35China
- 35Cameroon
- 27Italy
- 25Jamaica
- 19Trinidad and Tobago

Grandparents responsible for own grandchildren in Walker Mill
Zip codes: 20743.