Races in Waikoloa Village, Hawaii (HI) Detailed Stats
Data:
Races - White alone (%)
Races - White alone (% change since 2000)
Races - Black alone (%)
Races - Black alone (% change since 2000)
Races - American Indian alone (%)
Races - American Indian alone (% change since 2000)
Races - Asian alone (%)
Races - Asian alone (% change since 2000)
Races - Hispanic (%)
Races - Hispanic (% change since 2000)
Races - Native Hawaiian and Other Pacific Islander alone (%)
Races - Native Hawaiian and Other Pacific Islander alone (% change since 2000)
Races - Two or more races(%)
Races - Two or more races(% change since 2000)
Races - Other race alone (%)
Races - Other race alone (% change since 2000)
Racial diversity
Place of birth - Born in state of residence (%)
Place of birth - Born in state of residence (%) - White
Place of birth - Born in state of residence (%) - Black or African American
Place of birth - Born in state of residence (%) - Asian
Place of birth - Born in state of residence (%) - Hispanic or Latino
Place of birth - Born in state of residence (%) - American Indian and Alaska Native
Place of birth - Born in state of residence (%) - Multirace
Place of birth - Born in state of residence (%) - Other Race
Place of birth - Born in other state (%)
Place of birth - Born in other state (%) - White
Place of birth - Born in other state (%) - Black or African American
Place of birth - Born in other state (%) - Asian
Place of birth - Born in other state (%) - Hispanic or Latino
Place of birth - Born in other state (%) - American Indian and Alaska Native
Place of birth - Born in other state (%) - Multirace
Place of birth - Born in other state (%) - Other Race
Place of birth - Native, outside of US (%)
Place of birth - Native, outside of US (%) - White
Place of birth - Native, outside of US (%) - Black or African American
Place of birth - Native, outside of US (%) - Asian
Place of birth - Native, outside of US (%) - Hispanic or Latino
Place of birth - Native, outside of US (%) - American Indian and Alaska Native
Place of birth - Native, outside of US (%) - Multirace
Place of birth - Native, outside of US (%) - Other Race
Place of birth - Foreign born (%)
Place of birth - Foreign born (%) - White
Place of birth - Foreign born (%) - Black or African American
Place of birth - Foreign born (%) - Asian
Place of birth - Foreign born (%) - Hispanic or Latino
Place of birth - Foreign born (%) - American Indian and Alaska Native
Place of birth - Foreign born (%) - Multirace
Place of birth - Foreign born (%) - Other Race
Residents speaking English at home (%)
Residents speaking English at home - Born in the United States (%)
Residents speaking English at home - Native, born elsewhere (%)
Residents speaking English at home - Foreign born (%)
Residents speaking Spanish at home (%)
Residents speaking Spanish at home - Born in the United States (%)
Residents speaking Spanish at home - Native, born elsewhere (%)
Residents speaking Spanish at home - Foreign born (%)
Residents speaking other language at home (%)
Residents speaking other language at home - Born in the United States (%)
Residents speaking other language at home - Native, born elsewhere (%)
Residents speaking other language at home - Foreign born (%)
Marital status - Never married (%)
Marital status - Now married (%)
Marital status - Separated (%)
Marital status - Widowed (%)
Marital status - Divorced (%)
Ancestries Reported - Arab (%)
Ancestries Reported - Czech (%)
Ancestries Reported - Danish (%)
Ancestries Reported - Dutch (%)
Ancestries Reported - English (%)
Ancestries Reported - French (%)
Ancestries Reported - French Canadian (%)
Ancestries Reported - German (%)
Ancestries Reported - Greek (%)
Ancestries Reported - Hungarian (%)
Ancestries Reported - Irish (%)
Ancestries Reported - Italian (%)
Ancestries Reported - Lithuanian (%)
Ancestries Reported - Norwegian (%)
Ancestries Reported - Polish (%)
Ancestries Reported - Portuguese (%)
Ancestries Reported - Russian (%)
Ancestries Reported - Scotch-Irish (%)
Ancestries Reported - Scottish (%)
Ancestries Reported - Slovak (%)
Ancestries Reported - Subsaharan African (%)
Ancestries Reported - Swedish (%)
Ancestries Reported - Swiss (%)
Ancestries Reported - Ukrainian (%)
Ancestries Reported - United States (%)
Ancestries Reported - Welsh (%)
Ancestries Reported - West Indian (%)
Ancestries Reported - Other (%)
Geographical mobility - Same house 1 year ago (%)
Geographical mobility - Same house 1 year ago (%) - White
Geographical mobility - Same house 1 year ago (%) - Black or African American
Geographical mobility - Same house 1 year ago (%) - Asian
Geographical mobility - Same house 1 year ago (%) - Hispanic or Latino
Geographical mobility - Same house 1 year ago (%) - American Indian and Alaska Native
Geographical mobility - Same house 1 year ago (%) - Multirace
Geographical mobility - Same house 1 year ago (%) - Other Race
Geographical mobility - Moved within same county (%)
Geographical mobility - Moved within same county (%) - White
Geographical mobility - Moved within same county (%) - Black or African American
Geographical mobility - Moved within same county (%) - Asian
Geographical mobility - Moved within same county (%) - Hispanic or Latino
Geographical mobility - Moved within same county (%) - American Indian and Alaska Native
Geographical mobility - Moved within same county (%) - Multirace
Geographical mobility - Moved within same county (%) - Other Race
Geographical mobility - Moved from different county within same state (%)
Geographical mobility - Moved from different county within same state (%) - White
Geographical mobility - Moved from different county within same state (%) - Black or African American
Geographical mobility - Moved from different county within same state (%) - Asian
Geographical mobility - Moved from different county within same state (%) - Hispanic or Latino
Geographical mobility - Moved from different county within same state (%) - American Indian and Alaska Native
Geographical mobility - Moved from different county within same state (%) - Multirace
Geographical mobility - Moved from different county within same state (%) - Other Race
Geographical mobility - Moved from different state (%)
Geographical mobility - Moved from different state (%) - White
Geographical mobility - Moved from different state (%) - Black or African American
Geographical mobility - Moved from different state (%) - Asian
Geographical mobility - Moved from different state (%) - Hispanic or Latino
Geographical mobility - Moved from different state (%) - American Indian and Alaska Native
Geographical mobility - Moved from different state (%) - Multirace
Geographical mobility - Moved from different state (%) - Other Race
Geographical mobility - Moved from abroad (%)
Geographical mobility - Moved from abroad (%) - White
Geographical mobility - Moved from abroad (%) - Black or African American
Geographical mobility - Moved from abroad (%) - Asian
Geographical mobility - Moved from abroad (%) - Hispanic or Latino
Geographical mobility - Moved from abroad (%) - American Indian and Alaska Native
Geographical mobility - Moved from abroad (%) - Multirace
Geographical mobility - Moved from abroad (%) - Other Race
Place of birth for the foreign-born population - Ireland (%)
Place of birth for the foreign-born population - Denmark (%)
Place of birth for the foreign-born population - Norway (%)
Place of birth for the foreign-born population - Sweden (%)
Place of birth for the foreign-born population - United Kingdom (%)
Place of birth for the foreign-born population - England (%)
Place of birth for the foreign-born population - Scotland (%)
Place of birth for the foreign-born population - Other Northern Europe (%)
Place of birth for the foreign-born population - Austria (%)
Place of birth for the foreign-born population - Belgium (%)
Place of birth for the foreign-born population - France (%)
Place of birth for the foreign-born population - Germany (%)
Place of birth for the foreign-born population - Netherlands (%)
Place of birth for the foreign-born population - Switzerland (%)
Place of birth for the foreign-born population - Other Western Europe (%)
Place of birth for the foreign-born population - Greece (%)
Place of birth for the foreign-born population - Italy (%)
Place of birth for the foreign-born population - Portugal (%)
Place of birth for the foreign-born population - Spain (%)
Place of birth for the foreign-born population - Other Southern Europe (%)
Place of birth for the foreign-born population - Albania (%)
Place of birth for the foreign-born population - Belarus (%)
Place of birth for the foreign-born population - Bosnia and Herzegovina (%)
Place of birth for the foreign-born population - Bulgaria (%)
Place of birth for the foreign-born population - Croatia (%)
Place of birth for the foreign-born population - Czechoslovakia (%)
Place of birth for the foreign-born population - Hungary (%)
Place of birth for the foreign-born population - Latvia (%)
Place of birth for the foreign-born population - Lithuania (%)
Place of birth for the foreign-born population - North Macedonia (Macedonia) (%)
Place of birth for the foreign-born population - Moldova (%)
Place of birth for the foreign-born population - Poland (%)
Place of birth for the foreign-born population - Romania (%)
Place of birth for the foreign-born population - Russia (%)
Place of birth for the foreign-born population - Serbia (%)
Place of birth for the foreign-born population - Ukraine (%)
Place of birth for the foreign-born population - Other Eastern Europe (%)
Place of birth for the foreign-born population - China (%)
Place of birth for the foreign-born population - Hong Kong (%)
Place of birth for the foreign-born population - Taiwan (%)
Place of birth for the foreign-born population - Japan (%)
Place of birth for the foreign-born population - Korea (%)
Place of birth for the foreign-born population - Other Eastern Asia (%)
Place of birth for the foreign-born population - Afghanistan (%)
Place of birth for the foreign-born population - Bangladesh (%)
Place of birth for the foreign-born population - India (%)
Place of birth for the foreign-born population - Iran (%)
Place of birth for the foreign-born population - Kazakhstan (%)
Place of birth for the foreign-born population - Nepal (%)
Place of birth for the foreign-born population - Pakistan (%)
Place of birth for the foreign-born population - Sri Lanka (%)
Place of birth for the foreign-born population - Uzbekistan (%)
Place of birth for the foreign-born population - Other South Central Asia (%)
Place of birth for the foreign-born population - Burma (%)
Place of birth for the foreign-born population - Cambodia (%)
Place of birth for the foreign-born population - Indonesia (%)
Place of birth for the foreign-born population - Laos (%)
Place of birth for the foreign-born population - Malaysia (%)
Place of birth for the foreign-born population - Philippines (%)
Place of birth for the foreign-born population - Singapore (%)
Place of birth for the foreign-born population - Thailand (%)
Place of birth for the foreign-born population - Vietnam (%)
Place of birth for the foreign-born population - Other South Eastern Asia (%)
Place of birth for the foreign-born population - Armenia (%)
Place of birth for the foreign-born population - Iraq (%)
Place of birth for the foreign-born population - Israel (%)
Place of birth for the foreign-born population - Jordan (%)
Place of birth for the foreign-born population - Kuwait (%)
Place of birth for the foreign-born population - Lebanon (%)
Place of birth for the foreign-born population - Saudi Arabia (%)
Place of birth for the foreign-born population - Syria (%)
Place of birth for the foreign-born population - Turkey (%)
Place of birth for the foreign-born population - Yemen (%)
Place of birth for the foreign-born population - Other Western Asia (%)
Place of birth for the foreign-born population - Eritrea (%)
Place of birth for the foreign-born population - Ethiopia (%)
Place of birth for the foreign-born population - Kenya (%)
Place of birth for the foreign-born population - Somalia (%)
Place of birth for the foreign-born population - Uganda (%)
Place of birth for the foreign-born population - Zimbabwe (%)
Place of birth for the foreign-born population - Other Eastern Africa (%)
Place of birth for the foreign-born population - Cameroon (%)
Place of birth for the foreign-born population - Congo (%)
Place of birth for the foreign-born population - Democratic Republic of Congo (Zaire) (%)
Place of birth for the foreign-born population - Other Middle Africa (%)
Place of birth for the foreign-born population - Egypt (%)
Place of birth for the foreign-born population - Morocco (%)
Place of birth for the foreign-born population - Sudan (%)
Place of birth for the foreign-born population - Other Northern Africa (%)
Place of birth for the foreign-born population - South Africa (%)
Place of birth for the foreign-born population - Other Southern Africa (%)
Place of birth for the foreign-born population - Cabo Verde (%)
Place of birth for the foreign-born population - Ghana (%)
Place of birth for the foreign-born population - Liberia (%)
Place of birth for the foreign-born population - Nigeria (%)
Place of birth for the foreign-born population - Senegal (%)
Place of birth for the foreign-born population - Sierra Leone (%)
Place of birth for the foreign-born population - Other Western Africa (%)
Place of birth for the foreign-born population - Australia (%)
Place of birth for the foreign-born population - New Zealand (%)
Place of birth for the foreign-born population - Fiji (%)
Place of birth for the foreign-born population - Micronesia (%)
Place of birth for the foreign-born population - Bahamas (%)
Place of birth for the foreign-born population - Barbados (%)
Place of birth for the foreign-born population - Cuba (%)
Place of birth for the foreign-born population - Dominica (%)
Place of birth for the foreign-born population - Dominican Republic (%)
Place of birth for the foreign-born population - Grenada (%)
Place of birth for the foreign-born population - Haiti (%)
Place of birth for the foreign-born population - Jamaica (%)
Place of birth for the foreign-born population - St. Vincent and the Grenadines (%)
Place of birth for the foreign-born population - Trinidad and Tobago (%)
Place of birth for the foreign-born population - West Indies (%)
Place of birth for the foreign-born population - Other Caribbean (%)
Place of birth for the foreign-born population - Belize (%)
Place of birth for the foreign-born population - Costa Rica (%)
Place of birth for the foreign-born population - El Salvador (%)
Place of birth for the foreign-born population - Guatemala (%)
Place of birth for the foreign-born population - Honduras (%)
Place of birth for the foreign-born population - Mexico (%)
Place of birth for the foreign-born population - Nicaragua (%)
Place of birth for the foreign-born population - Panama (%)
Place of birth for the foreign-born population - Other Central America (%)
Place of birth for the foreign-born population - Argentina (%)
Place of birth for the foreign-born population - Bolivia (%)
Place of birth for the foreign-born population - Brazil (%)
Place of birth for the foreign-born population - Chile (%)
Place of birth for the foreign-born population - Colombia (%)
Place of birth for the foreign-born population - Ecuador (%)
Place of birth for the foreign-born population - Guyana (%)
Place of birth for the foreign-born population - Peru (%)
Place of birth for the foreign-born population - Uruguay (%)
Place of birth for the foreign-born population - Venezuela (%)
Place of birth for the foreign-born population - Other South America (%)
Place of birth for the foreign-born population - Canada (%)
Place of birth for the foreign-born population - Other Northern America (%)
Place of birth for the foreign-born population - Other (%)
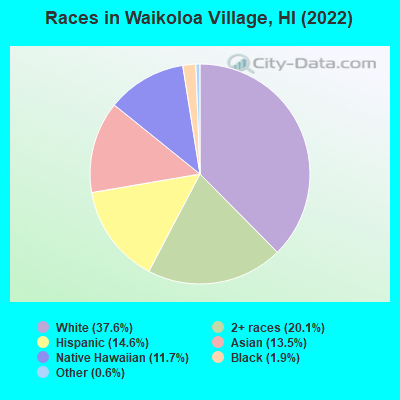
According to 2022 data, the most numerous races in Waikoloa Village, HI are Asian alone (1,019 residents), Two or more races (1,518 residents), and White alone (2,843 residents). 66.6% of Waikoloa Village residents speak English at home. 18.9% of Waikoloa Village, HI residents are foreign-born (7.4% born in Asia, 4.2% born in Latin America, 4.2% born in Oceania), which is 4.6% greater than the foreign-born rate of 18.0% across the entire state of Hawaii.
Race distribution in Waikoloa Village
2000 2022
494,149 40.8% Asian alone 277,091 22.9% White alone 218,700 18.1% Two or more races 108,441 9.0% Native Hawaiian and Other 87,699 7.2% Hispanic 20,829 1.7% Black alone 2,089 0.2% Other race alone 2,539 0.2% American Indian alone
498,125 34.6% Asian alone 318,574 22.1% Two or more races 297,937 20.7% White alone 160,103 11.1% Hispanic 134,567 9.3% Native Hawaiian and Other 23,682 1.6% Black alone 5,378 0.4% Other race alone 1,830 0.1% American Indian alone
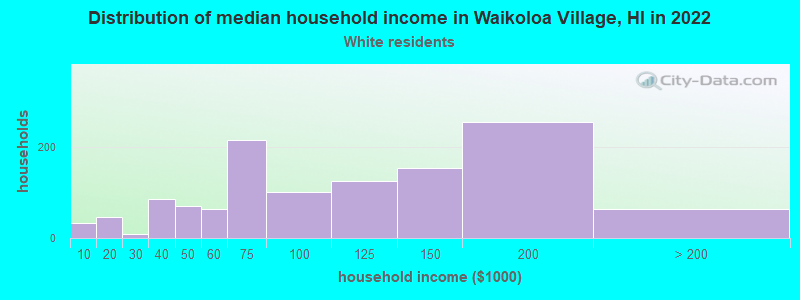
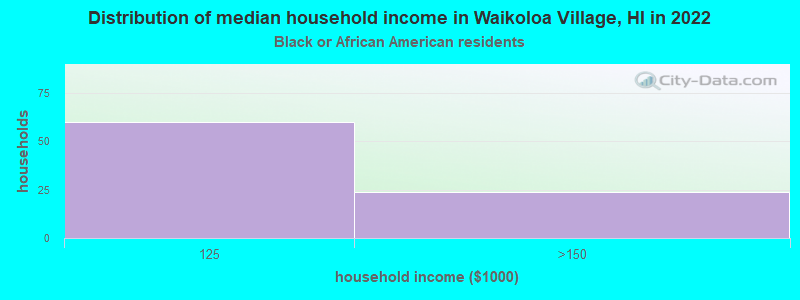
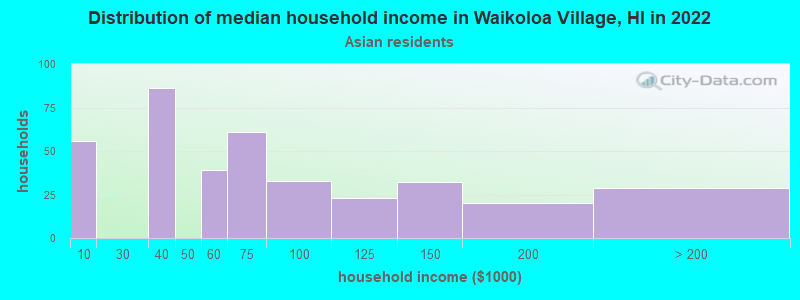
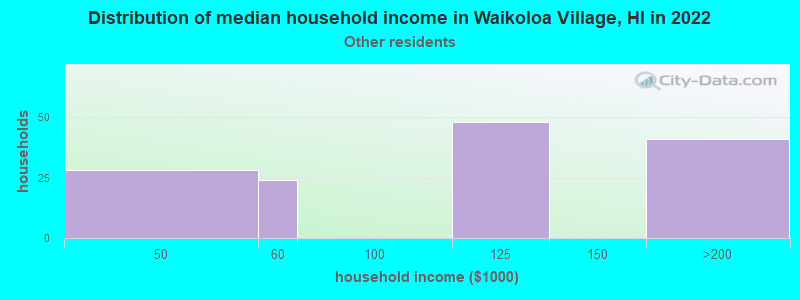
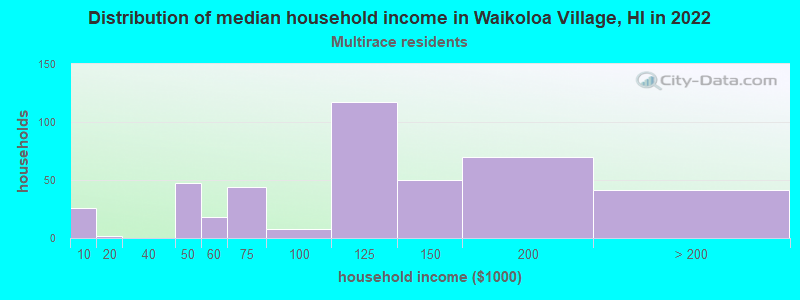
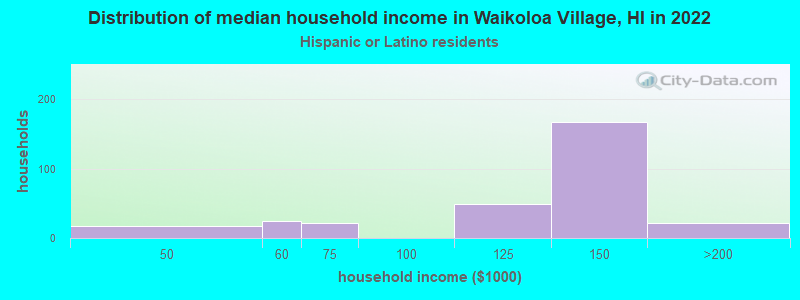
Income and house value in Waikoloa Village Median household income in 2022 $89,481 White non-Hispanic householders$59,675 Asian householdersover $200,000 Some other race householders$104,016 Two or more races householders$140,368 Hispanic or Latino race householdersMedian 2022 house value $786,159 White Non-Hispanic householders$833,188 American Indian or Alaska Native householders $714,690 Asian householders$604,339 Native Hawaiian and other Pacific Islander householders$651,368 Two or more races householders$625,076 Hispanic or Latino householders
Median age by race in Waikoloa Village
54.3 Median age for White residents54.8 49.2 36.8 Median age for Black or African American residents38.9 -646,651,269.6 30.9 Median age for American Indian / Alaska Native residents-1,082,456,139.3 30.6 42.8 Median age for Asian residents49.6 38.5 31.4 Median age for Native Hawaiian / Pacific Islander residents22.8 47.6 36.9 Median age for Other race residents47.9 34.5 17.7 Median age for Two or more races residents25.5 13.8 54.2 Median age for White alone residents54.7 49.4 25.6 Median age for Hispanic or Latino residents44.6 18.1
Owner/renter occupied households by race in Waikoloa Village
House owners and renters - White residents 1,038 83.4% Owner occupied206 16.6% Renter occupiedHouse owners and renters - Black or African American residents 120 100.0% Owner occupiedHouse owners and renters - American Indian / Alaska Native residents 71 100.0% Owner occupiedHouse owners and renters - Asian residents 243 67.6% Owner occupied116 32.4% Renter occupiedHouse owners and renters - Native Hawaiian / Pacific Islander residents 128 40.6% Owner occupied188 59.4% Renter occupiedHouse owners and renters - Other race residents 87 64.2% Owner occupied48 35.8% Renter occupiedHouse owners and renters - Two or more races residents 345 80.8% Owner occupied82 19.2% Renter occupiedHouse owners and renters - White alone residents 993 82.2% Owner occupied215 17.8% Renter occupiedHouse owners and renters - Hispanic or Latino residents 212 73.6% Owner occupied76 26.4% Renter occupied
Language usage in Waikoloa Village
English speakers - Total 66.6% of residents of Waikoloa Village speak English at home.
6.7% of residents speak Spanish at home 264 55.5% Speak English very well212 44.5% Speak English less than very well24.1% of residents speak other language at home 1,261 74.2% Speak English very well438 25.8% Speak English less than very well
English speakers - Born in the United States 85.1% of residents of Waikoloa Village speak English at home.
6.6% of residents speak Spanish at home 157 74.4% Speak English very well54 25.6% Speak English less than very well8.0% of residents speak other language at home 235 91.8% Speak English very well21 8.2% Speak English less than very well
English speakers - Native, born elsewhere 10.2% of residents of Waikoloa Village speak English at home.
22.7% of residents speak Spanish at home 20 100.0% Speak English very well96.6% of residents speak other language at home 75 88.2% Speak English very well10 11.8% Speak English less than very well
English speakers - Foreign-born 20.4% of residents of Waikoloa Village speak English at home.
16.1% of residents speak Spanish at home 21 9.5% Speak English very well201 90.5% Speak English less than very well59.9% of residents speak other language at home 409 49.6% Speak English very well416 50.4% Speak English less than very well
White (Caucasian) - Speak only English Native:
96.1% (2,296)Foreign-born:
40.2% (128)
White (Caucasian) - Speak another language Native:
4.5% (107)Foreign-born:
61.1% (195)
American Indian / Alaska Native - Speak another language Native:
100.0% (116)Foreign-born:
100.0% (143)
Asian - Speak only English Native:
61.9% (335)Foreign-born:
16.5% (67)
Asian - Speak another language Native:
27.4% (148)Foreign-born:
84.5% (344)
Native Hawaiian / Pacific Islander - Speak only English Native:
63.7% (369)Foreign-born:
6.0% (23)
Native Hawaiian / Pacific Islander - Speak another language Native:
34.5% (200)Foreign-born:
92.0% (346)
Other race - Speak only English Native:
32.8% (44)Foreign-born:
12.6% (34)
Other race - Speak another language Native:
44.9% (60)Foreign-born:
68.7% (185)
White alone - Speak only English Native:
94.6% (2,250)Foreign-born:
40.4% (129)
White alone - Speak another language Native:
5.5% (131)Foreign-born:
61.6% (197)
Hispanic or Latino - Speak only English Native:
62.6% (436)Foreign-born:
12.0% (49)
Hispanic or Latino - Speak another language Native:
29.8% (207)Foreign-born:
64.6% (262)
Foreign-born residents in Waikoloa Village 1,429 residents are foreign born (7.4% Asia , 4.2% Latin America , 4.2% Oceania ).
This city:
18.9%Hawaii:
18.0%
Marital status for residents in Waikoloa Village Marital status - White (Caucasian) population 15 years and over
Males 18.5% Never married69.7% Now married0.0% Separated0.0% Widowed11.8% DivorcedFemales 26.0% Never married59.1% Now married3.0% Separated5.9% Widowed6.0% DivorcedWomen who gave birth in the past 12 months Now married:
100.0% (84)Unmarried:
0.0% (0)
Women who did not give birth in the past 12 months Now married:
38.7% (157)Unmarried:
61.3% (249)
Marital status - Black or African American population 15 years and over
Males 0.0% Never married100.0% Now married0.0% Separated0.0% Widowed0.0% DivorcedFemales 100.0% Never married0.0% Now married0.0% Separated0.0% Widowed0.0% DivorcedWomen who did not give birth in the past 12 months Now married:
0.0% (0)Unmarried:
100.0% (23)
Marital status - American Indian / Alaska Native population 15 years and over
Males 0.0% Never married100.0% Now married0.0% Separated0.0% Widowed0.0% DivorcedFemales 55.9% Never married44.1% Now married0.0% Separated0.0% Widowed0.0% DivorcedWomen who did not give birth in the past 12 months Now married:
44.1% (48)Unmarried:
55.9% (61)
Marital status - Asian population 15 years and over
Males 34.9% Never married58.5% Now married0.0% Separated0.0% Widowed6.6% DivorcedFemales 7.8% Never married84.0% Now married0.0% Separated2.6% Widowed5.6% DivorcedWomen who gave birth in the past 12 months Now married:
0.0% (0)Unmarried:
100.0% (26)
Women who did not give birth in the past 12 months Now married:
89.8% (241)Unmarried:
10.2% (27)
Marital status - Native Hawaiian / Pacific Islander population 15 years and over
Males 41.8% Never married36.7% Now married7.6% Separated0.0% Widowed13.9% DivorcedFemales 31.0% Never married63.3% Now married0.0% Separated0.0% Widowed5.7% DivorcedWomen who did not give birth in the past 12 months Now married:
58.9% (105)Unmarried:
41.1% (73)
Marital status - Other race population 15 years and over
Males 24.3% Never married75.7% Now married0.0% Separated0.0% Widowed0.0% DivorcedFemales 0.0% Never married86.3% Now married0.0% Separated0.0% Widowed13.7% DivorcedWomen who did not give birth in the past 12 months Now married:
82.9% (117)Unmarried:
17.1% (24)
Marital status - Two or more races population 15 years and over
Males 34.6% Never married56.4% Now married0.0% Separated3.4% Widowed5.6% DivorcedFemales 41.6% Never married47.7% Now married4.3% Separated0.0% Widowed6.5% DivorcedWomen who did not give birth in the past 12 months Now married:
46.4% (185)Unmarried:
53.6% (214)
Marital status - White alone, not Hispanic / Latino population 15 years and over
Males 15.3% Never married72.4% Now married0.0% Separated0.0% Widowed12.3% DivorcedFemales 23.9% Never married60.8% Now married3.1% Separated6.1% Widowed6.2% DivorcedWomen who gave birth in the past 12 months Now married:
100.0% (91)Unmarried:
0.0% (0)
Women who did not give birth in the past 12 months Now married:
41.9% (169)Unmarried:
58.1% (234)
Marital status - Hispanic or Latino population 15 years and over
Males 41.0% Never married59.0% Now married0.0% Separated0.0% Widowed0.0% DivorcedFemales 36.5% Never married49.0% Now married5.4% Separated0.0% Widowed9.1% DivorcedWomen who did not give birth in the past 12 months Now married:
51.8% (175)Unmarried:
48.2% (163)
Ancestries in Waikoloa Village
192 5.0% European190 4.9% German165 4.3% Irish128 3.3% English97 2.5% Italian48 1.2% American37 1.0% French29 0.7% African26 0.7% Hungarian20 0.5% Iranian11 0.3% Greek11 0.3% Polish10 0.3% Austrian9 0.2% Eastern European5 0.1% British3 0.08% Slovene
Children Nativity (place of birth) in Waikoloa Village
Children under 6 years - Living with two parents Both parents native 209 100.0% NativeBoth parents foreign-born 124 100.0% NativeOne native, one foreign-born parent 116 100.0% NativeChildren under 6 years - Living with one parent Native parent 157 100.0% NativeChildren 6 to 17 years - Living with two parents Both parents native 457 100.0% NativeBoth parents foreign-born 396 89.3% Native47 10.7% Foreign-bornOne native, one foreign-born parent 109 100.0% NativeChildren 6 to 17 years - Living with one parent Native parent 455 100.0% NativeForeign-born parent 28 44.1% Native36 55.9% Foreign-born