Races in Versailles, Kentucky (KY) Detailed Stats
Data:
Races - White alone (%)
Races - White alone (% change since 2000)
Races - Black alone (%)
Races - Black alone (% change since 2000)
Races - American Indian alone (%)
Races - American Indian alone (% change since 2000)
Races - Asian alone (%)
Races - Asian alone (% change since 2000)
Races - Hispanic (%)
Races - Hispanic (% change since 2000)
Races - Native Hawaiian and Other Pacific Islander alone (%)
Races - Native Hawaiian and Other Pacific Islander alone (% change since 2000)
Races - Two or more races(%)
Races - Two or more races(% change since 2000)
Races - Other race alone (%)
Races - Other race alone (% change since 2000)
Racial diversity
Place of birth - Born in state of residence (%)
Place of birth - Born in state of residence (%) - White
Place of birth - Born in state of residence (%) - Black or African American
Place of birth - Born in state of residence (%) - Asian
Place of birth - Born in state of residence (%) - Hispanic or Latino
Place of birth - Born in state of residence (%) - American Indian and Alaska Native
Place of birth - Born in state of residence (%) - Multirace
Place of birth - Born in state of residence (%) - Other Race
Place of birth - Born in other state (%)
Place of birth - Born in other state (%) - White
Place of birth - Born in other state (%) - Black or African American
Place of birth - Born in other state (%) - Asian
Place of birth - Born in other state (%) - Hispanic or Latino
Place of birth - Born in other state (%) - American Indian and Alaska Native
Place of birth - Born in other state (%) - Multirace
Place of birth - Born in other state (%) - Other Race
Place of birth - Native, outside of US (%)
Place of birth - Native, outside of US (%) - White
Place of birth - Native, outside of US (%) - Black or African American
Place of birth - Native, outside of US (%) - Asian
Place of birth - Native, outside of US (%) - Hispanic or Latino
Place of birth - Native, outside of US (%) - American Indian and Alaska Native
Place of birth - Native, outside of US (%) - Multirace
Place of birth - Native, outside of US (%) - Other Race
Place of birth - Foreign born (%)
Place of birth - Foreign born (%) - White
Place of birth - Foreign born (%) - Black or African American
Place of birth - Foreign born (%) - Asian
Place of birth - Foreign born (%) - Hispanic or Latino
Place of birth - Foreign born (%) - American Indian and Alaska Native
Place of birth - Foreign born (%) - Multirace
Place of birth - Foreign born (%) - Other Race
Residents speaking English at home (%)
Residents speaking English at home - Born in the United States (%)
Residents speaking English at home - Native, born elsewhere (%)
Residents speaking English at home - Foreign born (%)
Residents speaking Spanish at home (%)
Residents speaking Spanish at home - Born in the United States (%)
Residents speaking Spanish at home - Native, born elsewhere (%)
Residents speaking Spanish at home - Foreign born (%)
Residents speaking other language at home (%)
Residents speaking other language at home - Born in the United States (%)
Residents speaking other language at home - Native, born elsewhere (%)
Residents speaking other language at home - Foreign born (%)
Marital status - Never married (%)
Marital status - Now married (%)
Marital status - Separated (%)
Marital status - Widowed (%)
Marital status - Divorced (%)
Ancestries Reported - Arab (%)
Ancestries Reported - Czech (%)
Ancestries Reported - Danish (%)
Ancestries Reported - Dutch (%)
Ancestries Reported - English (%)
Ancestries Reported - French (%)
Ancestries Reported - French Canadian (%)
Ancestries Reported - German (%)
Ancestries Reported - Greek (%)
Ancestries Reported - Hungarian (%)
Ancestries Reported - Irish (%)
Ancestries Reported - Italian (%)
Ancestries Reported - Lithuanian (%)
Ancestries Reported - Norwegian (%)
Ancestries Reported - Polish (%)
Ancestries Reported - Portuguese (%)
Ancestries Reported - Russian (%)
Ancestries Reported - Scotch-Irish (%)
Ancestries Reported - Scottish (%)
Ancestries Reported - Slovak (%)
Ancestries Reported - Subsaharan African (%)
Ancestries Reported - Swedish (%)
Ancestries Reported - Swiss (%)
Ancestries Reported - Ukrainian (%)
Ancestries Reported - United States (%)
Ancestries Reported - Welsh (%)
Ancestries Reported - West Indian (%)
Ancestries Reported - Other (%)
Geographical mobility - Same house 1 year ago (%)
Geographical mobility - Same house 1 year ago (%) - White
Geographical mobility - Same house 1 year ago (%) - Black or African American
Geographical mobility - Same house 1 year ago (%) - Asian
Geographical mobility - Same house 1 year ago (%) - Hispanic or Latino
Geographical mobility - Same house 1 year ago (%) - American Indian and Alaska Native
Geographical mobility - Same house 1 year ago (%) - Multirace
Geographical mobility - Same house 1 year ago (%) - Other Race
Geographical mobility - Moved within same county (%)
Geographical mobility - Moved within same county (%) - White
Geographical mobility - Moved within same county (%) - Black or African American
Geographical mobility - Moved within same county (%) - Asian
Geographical mobility - Moved within same county (%) - Hispanic or Latino
Geographical mobility - Moved within same county (%) - American Indian and Alaska Native
Geographical mobility - Moved within same county (%) - Multirace
Geographical mobility - Moved within same county (%) - Other Race
Geographical mobility - Moved from different county within same state (%)
Geographical mobility - Moved from different county within same state (%) - White
Geographical mobility - Moved from different county within same state (%) - Black or African American
Geographical mobility - Moved from different county within same state (%) - Asian
Geographical mobility - Moved from different county within same state (%) - Hispanic or Latino
Geographical mobility - Moved from different county within same state (%) - American Indian and Alaska Native
Geographical mobility - Moved from different county within same state (%) - Multirace
Geographical mobility - Moved from different county within same state (%) - Other Race
Geographical mobility - Moved from different state (%)
Geographical mobility - Moved from different state (%) - White
Geographical mobility - Moved from different state (%) - Black or African American
Geographical mobility - Moved from different state (%) - Asian
Geographical mobility - Moved from different state (%) - Hispanic or Latino
Geographical mobility - Moved from different state (%) - American Indian and Alaska Native
Geographical mobility - Moved from different state (%) - Multirace
Geographical mobility - Moved from different state (%) - Other Race
Geographical mobility - Moved from abroad (%)
Geographical mobility - Moved from abroad (%) - White
Geographical mobility - Moved from abroad (%) - Black or African American
Geographical mobility - Moved from abroad (%) - Asian
Geographical mobility - Moved from abroad (%) - Hispanic or Latino
Geographical mobility - Moved from abroad (%) - American Indian and Alaska Native
Geographical mobility - Moved from abroad (%) - Multirace
Geographical mobility - Moved from abroad (%) - Other Race
Place of birth for the foreign-born population - Ireland (%)
Place of birth for the foreign-born population - Denmark (%)
Place of birth for the foreign-born population - Norway (%)
Place of birth for the foreign-born population - Sweden (%)
Place of birth for the foreign-born population - United Kingdom (%)
Place of birth for the foreign-born population - England (%)
Place of birth for the foreign-born population - Scotland (%)
Place of birth for the foreign-born population - Other Northern Europe (%)
Place of birth for the foreign-born population - Austria (%)
Place of birth for the foreign-born population - Belgium (%)
Place of birth for the foreign-born population - France (%)
Place of birth for the foreign-born population - Germany (%)
Place of birth for the foreign-born population - Netherlands (%)
Place of birth for the foreign-born population - Switzerland (%)
Place of birth for the foreign-born population - Other Western Europe (%)
Place of birth for the foreign-born population - Greece (%)
Place of birth for the foreign-born population - Italy (%)
Place of birth for the foreign-born population - Portugal (%)
Place of birth for the foreign-born population - Spain (%)
Place of birth for the foreign-born population - Other Southern Europe (%)
Place of birth for the foreign-born population - Albania (%)
Place of birth for the foreign-born population - Belarus (%)
Place of birth for the foreign-born population - Bosnia and Herzegovina (%)
Place of birth for the foreign-born population - Bulgaria (%)
Place of birth for the foreign-born population - Croatia (%)
Place of birth for the foreign-born population - Czechoslovakia (%)
Place of birth for the foreign-born population - Hungary (%)
Place of birth for the foreign-born population - Latvia (%)
Place of birth for the foreign-born population - Lithuania (%)
Place of birth for the foreign-born population - North Macedonia (Macedonia) (%)
Place of birth for the foreign-born population - Moldova (%)
Place of birth for the foreign-born population - Poland (%)
Place of birth for the foreign-born population - Romania (%)
Place of birth for the foreign-born population - Russia (%)
Place of birth for the foreign-born population - Serbia (%)
Place of birth for the foreign-born population - Ukraine (%)
Place of birth for the foreign-born population - Other Eastern Europe (%)
Place of birth for the foreign-born population - China (%)
Place of birth for the foreign-born population - Hong Kong (%)
Place of birth for the foreign-born population - Taiwan (%)
Place of birth for the foreign-born population - Japan (%)
Place of birth for the foreign-born population - Korea (%)
Place of birth for the foreign-born population - Other Eastern Asia (%)
Place of birth for the foreign-born population - Afghanistan (%)
Place of birth for the foreign-born population - Bangladesh (%)
Place of birth for the foreign-born population - India (%)
Place of birth for the foreign-born population - Iran (%)
Place of birth for the foreign-born population - Kazakhstan (%)
Place of birth for the foreign-born population - Nepal (%)
Place of birth for the foreign-born population - Pakistan (%)
Place of birth for the foreign-born population - Sri Lanka (%)
Place of birth for the foreign-born population - Uzbekistan (%)
Place of birth for the foreign-born population - Other South Central Asia (%)
Place of birth for the foreign-born population - Burma (%)
Place of birth for the foreign-born population - Cambodia (%)
Place of birth for the foreign-born population - Indonesia (%)
Place of birth for the foreign-born population - Laos (%)
Place of birth for the foreign-born population - Malaysia (%)
Place of birth for the foreign-born population - Philippines (%)
Place of birth for the foreign-born population - Singapore (%)
Place of birth for the foreign-born population - Thailand (%)
Place of birth for the foreign-born population - Vietnam (%)
Place of birth for the foreign-born population - Other South Eastern Asia (%)
Place of birth for the foreign-born population - Armenia (%)
Place of birth for the foreign-born population - Iraq (%)
Place of birth for the foreign-born population - Israel (%)
Place of birth for the foreign-born population - Jordan (%)
Place of birth for the foreign-born population - Kuwait (%)
Place of birth for the foreign-born population - Lebanon (%)
Place of birth for the foreign-born population - Saudi Arabia (%)
Place of birth for the foreign-born population - Syria (%)
Place of birth for the foreign-born population - Turkey (%)
Place of birth for the foreign-born population - Yemen (%)
Place of birth for the foreign-born population - Other Western Asia (%)
Place of birth for the foreign-born population - Eritrea (%)
Place of birth for the foreign-born population - Ethiopia (%)
Place of birth for the foreign-born population - Kenya (%)
Place of birth for the foreign-born population - Somalia (%)
Place of birth for the foreign-born population - Uganda (%)
Place of birth for the foreign-born population - Zimbabwe (%)
Place of birth for the foreign-born population - Other Eastern Africa (%)
Place of birth for the foreign-born population - Cameroon (%)
Place of birth for the foreign-born population - Congo (%)
Place of birth for the foreign-born population - Democratic Republic of Congo (Zaire) (%)
Place of birth for the foreign-born population - Other Middle Africa (%)
Place of birth for the foreign-born population - Egypt (%)
Place of birth for the foreign-born population - Morocco (%)
Place of birth for the foreign-born population - Sudan (%)
Place of birth for the foreign-born population - Other Northern Africa (%)
Place of birth for the foreign-born population - South Africa (%)
Place of birth for the foreign-born population - Other Southern Africa (%)
Place of birth for the foreign-born population - Cabo Verde (%)
Place of birth for the foreign-born population - Ghana (%)
Place of birth for the foreign-born population - Liberia (%)
Place of birth for the foreign-born population - Nigeria (%)
Place of birth for the foreign-born population - Senegal (%)
Place of birth for the foreign-born population - Sierra Leone (%)
Place of birth for the foreign-born population - Other Western Africa (%)
Place of birth for the foreign-born population - Australia (%)
Place of birth for the foreign-born population - New Zealand (%)
Place of birth for the foreign-born population - Fiji (%)
Place of birth for the foreign-born population - Micronesia (%)
Place of birth for the foreign-born population - Bahamas (%)
Place of birth for the foreign-born population - Barbados (%)
Place of birth for the foreign-born population - Cuba (%)
Place of birth for the foreign-born population - Dominica (%)
Place of birth for the foreign-born population - Dominican Republic (%)
Place of birth for the foreign-born population - Grenada (%)
Place of birth for the foreign-born population - Haiti (%)
Place of birth for the foreign-born population - Jamaica (%)
Place of birth for the foreign-born population - St. Vincent and the Grenadines (%)
Place of birth for the foreign-born population - Trinidad and Tobago (%)
Place of birth for the foreign-born population - West Indies (%)
Place of birth for the foreign-born population - Other Caribbean (%)
Place of birth for the foreign-born population - Belize (%)
Place of birth for the foreign-born population - Costa Rica (%)
Place of birth for the foreign-born population - El Salvador (%)
Place of birth for the foreign-born population - Guatemala (%)
Place of birth for the foreign-born population - Honduras (%)
Place of birth for the foreign-born population - Mexico (%)
Place of birth for the foreign-born population - Nicaragua (%)
Place of birth for the foreign-born population - Panama (%)
Place of birth for the foreign-born population - Other Central America (%)
Place of birth for the foreign-born population - Argentina (%)
Place of birth for the foreign-born population - Bolivia (%)
Place of birth for the foreign-born population - Brazil (%)
Place of birth for the foreign-born population - Chile (%)
Place of birth for the foreign-born population - Colombia (%)
Place of birth for the foreign-born population - Ecuador (%)
Place of birth for the foreign-born population - Guyana (%)
Place of birth for the foreign-born population - Peru (%)
Place of birth for the foreign-born population - Uruguay (%)
Place of birth for the foreign-born population - Venezuela (%)
Place of birth for the foreign-born population - Other South America (%)
Place of birth for the foreign-born population - Canada (%)
Place of birth for the foreign-born population - Other Northern America (%)
Place of birth for the foreign-born population - Other (%)
Latest news about races in Versailles, KY collected exclusively by city-data.com from local newspapers, TV, and radio stations
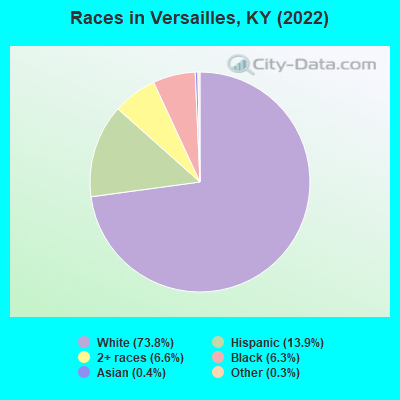
According to 2022 data, the most numerous races in Versailles, KY are White alone (7,616 residents), Black alone (648 residents), and Hispanic (1,431 residents). 90.5% of Versailles residents speak English at home. 6.7% of Versailles, KY residents are foreign-born (5.8% born in Latin America), which is 40.6% greater than the foreign-born rate of 4.0% across the entire state of Kentucky.
Race distribution in Versailles
2000 2022
3,608,013 89.3% White alone 293,639 7.3% Black alone 59,939 1.5% Hispanic 37,750 0.9% Two or more races 29,368 0.7% Asian alone 7,939 0.2% American Indian alone 3,846 0.10% Other race alone 1,275 0.03% Native Hawaiian and Other
3,710,998 82.2% White alone 343,194 7.6% Black alone 187,483 4.2% Hispanic 187,394 4.2% Two or more races 62,240 1.4% Asian alone 13,529 0.3% Other race alone 4,302 0.10% American Indian alone 3,170 0.07% Native Hawaiian and Other
Income and house value in Versailles Median household income in 2022 $55,612 White non-Hispanic householders$52,239 Black householders$67,219 Some other race householdersMedian 2022 house value $296,917 White Non-Hispanic householders$255,044 Black or African American householders$142,748 Some other race householders$155,437 Hispanic or Latino householders
Median age by race in Versailles
43.0 Median age for White residents41.8 45.0 46.7 Median age for Black or African American residents43.0 46.5 -521,556,256.1 Median age for American Indian / Alaska Native residents-607,449,856.1 -630,065,358.8 49.2 Median age for Asian residents-688,492,062.8 52.1 -755,186,721.2 Median age for Native Hawaiian / Pacific Islander residents-724,043,715.1 -853,801,168.7 5.1 Median age for Other race residents21.2 5.1 14.9 Median age for Two or more races residents14.9 19.8 46.2 Median age for White alone residents44.1 48.9 19.2 Median age for Hispanic or Latino residents27.6 18.1
Owner/renter occupied households by race in Versailles
House owners and renters - White residents 2,303 61.8% Owner occupied1,425 38.2% Renter occupiedHouse owners and renters - Black or African American residents 196 54.6% Owner occupied163 45.4% Renter occupiedHouse owners and renters - American Indian / Alaska Native residents 8 100.0% Renter occupiedHouse owners and renters - Asian residents 5 87.0% Owner occupied1 13.0% Renter occupiedHouse owners and renters - Other race residents 9 9.3% Owner occupied87 90.7% Renter occupiedHouse owners and renters - Two or more races residents 53 29.0% Owner occupied130 71.0% Renter occupiedHouse owners and renters - White alone residents 2,308 64.6% Owner occupied1,265 35.4% Renter occupiedHouse owners and renters - Hispanic or Latino residents 245 100.0% Renter occupied
Language usage in Versailles
English speakers - Total 90.5% of residents of Versailles speak English at home.
8.1% of residents speak Spanish at home 255 32.5% Speak English very well529 67.5% Speak English less than very well1.4% of residents speak other language at home 131 96.3% Speak English very well5 3.7% Speak English less than very well
English speakers - Born in the United States 97.8% of residents of Versailles speak English at home.
0.1% of residents speak Spanish at home 3 100.0% Speak English very well2.1% of residents speak other language at home 52 100.0% Speak English very well
English speakers - Native, born elsewhere 96.1% of residents of Versailles speak English at home.
English speakers - Foreign-born 9.7% of residents of Versailles speak English at home.
89.1% of residents speak Spanish at home 134 22.5% Speak English very well462 77.5% Speak English less than very well3.3% of residents speak other language at home 17 77.3% Speak English very well5 22.7% Speak English less than very well
White (Caucasian) - Speak only English Native:
97.1% (7,374)Foreign-born:
9.4% (32)
White (Caucasian) - Speak another language Native:
2.8% (213)Foreign-born:
83.2% (286)
Other race - Speak only English Native:
58.6% (77)Foreign-born:
4.3% (9)
Other race - Speak another language Native:
41.8% (55)Foreign-born:
94.8% (187)
White alone - Speak only English Native:
98.3% (7,145)Foreign-born:
95.0% (34)
White alone - Speak another language Native:
1.7% (124)Foreign-born:
11.6% (4)
Hispanic or Latino - Speak another language Native:
32.0% (167)Foreign-born:
100.0% (587)
Foreign-born residents in Versailles 695 residents are foreign born (5.8% Latin America ).
This city:
6.7%Kentucky:
4.1%
Marital status for residents in Versailles Marital status - White (Caucasian) population 15 years and over
Males 31.3% Never married50.8% Now married1.2% Separated1.6% Widowed15.0% DivorcedFemales 24.0% Never married47.1% Now married2.6% Separated11.5% Widowed14.8% DivorcedWomen who gave birth in the past 12 months Now married:
55.3% (56)Unmarried:
44.7% (45)
Women who did not give birth in the past 12 months Now married:
46.1% (742)Unmarried:
53.9% (869)
Marital status - Black or African American population 15 years and over
Males 39.6% Never married22.3% Now married0.0% Separated0.0% Widowed38.2% DivorcedFemales 52.1% Never married10.9% Now married0.0% Separated15.2% Widowed21.8% DivorcedWomen who did not give birth in the past 12 months Now married:
19.4% (33)Unmarried:
80.6% (138)
Marital status - Asian population 15 years and over
Males 0.0% Never married100.0% Now married0.0% Separated0.0% Widowed0.0% DivorcedFemales 21.4% Never married75.0% Now married0.0% Separated0.0% Widowed3.6% DivorcedWomen who did not give birth in the past 12 months Now married:
75.0% (19)Unmarried:
25.0% (6)
Marital status - Other race population 15 years and over
Males 94.3% Never married5.7% Now married0.0% Separated0.0% Widowed0.0% DivorcedFemales 48.6% Never married50.0% Now married0.0% Separated0.0% Widowed1.4% DivorcedWomen who did not give birth in the past 12 months Now married:
45.6% (41)Unmarried:
54.4% (49)
Marital status - Two or more races population 15 years and over
Males 48.3% Never married46.7% Now married0.0% Separated0.0% Widowed5.0% DivorcedFemales 48.6% Never married17.9% Now married33.6% Separated0.0% Widowed0.0% DivorcedWomen who did not give birth in the past 12 months Now married:
48.5% (92)Unmarried:
51.5% (98)
Marital status - White alone, not Hispanic / Latino population 15 years and over
Males 27.2% Never married53.1% Now married1.4% Separated1.8% Widowed16.6% DivorcedFemales 17.2% Never married51.1% Now married3.0% Separated11.8% Widowed16.9% DivorcedWomen who gave birth in the past 12 months Now married:
55.3% (56)Unmarried:
44.7% (45)
Women who did not give birth in the past 12 months Now married:
56.3% (722)Unmarried:
43.7% (560)
Marital status - Hispanic or Latino population 15 years and over
Males 79.0% Never married21.0% Now married0.0% Separated0.0% Widowed0.0% DivorcedFemales 72.0% Never married20.5% Now married0.0% Separated7.5% Widowed0.0% DivorcedWomen who did not give birth in the past 12 months Now married:
13.7% (64)Unmarried:
86.3% (405)
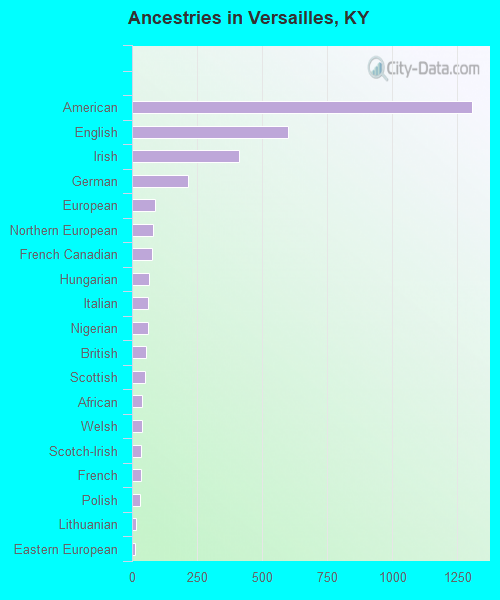
Ancestries in Versailles
1,306 24.2% American598 11.1% English412 7.6% Irish215 4.0% German88 1.6% European82 1.5% Northern European75 1.4% French Canadian64 1.2% Hungarian62 1.2% Italian62 1.2% Nigerian53 1.0% British49 0.9% Scottish40 0.7% African37 0.7% Welsh36 0.7% Scotch-Irish35 0.6% French30 0.6% Polish15 0.3% Lithuanian12 0.2% Eastern European6 0.1% Russian5 0.09% Slovene4 0.07% Greek
Children Nativity (place of birth) in Versailles
Children under 6 years - Living with two parents Both parents native 270 100.0% NativeOne native, one foreign-born parent 256 100.0% NativeChildren under 6 years - Living with one parent Native parent 311 100.0% NativeChildren 6 to 17 years - Living with two parents Both parents native 635 99.1% Native6 0.9% Foreign-bornBoth parents foreign-born 91 94.0% Native6 6.0% Foreign-bornOne native, one foreign-born parent 51 100.0% NativeChildren 6 to 17 years - Living with one parent Native parent 543 100.0% NativeForeign-born parent 55 49.5% Native56 50.5% Foreign-born
Grandparents responsible for own grandchildren in Versailles
Grandparents (30 to 59 years) White / Caucasian 56 81.8% Responsible for grandchildren12 18.2% Not responsible for grandchildrenWhite alone, not Hispanic / Latino 56 81.6% Responsible for grandchildren13 18.4% Not responsible for grandchildren
Grandparents (60 years and over) White / Caucasian 15 100.0% Not responsible for grandchildrenWhite alone, not Hispanic / Latino 15 100.0% Not responsible for grandchildren