Races in Vernon, Texas (TX) Detailed Stats
Data:
Races - White alone (%)
Races - White alone (% change since 2000)
Races - Black alone (%)
Races - Black alone (% change since 2000)
Races - American Indian alone (%)
Races - American Indian alone (% change since 2000)
Races - Asian alone (%)
Races - Asian alone (% change since 2000)
Races - Hispanic (%)
Races - Hispanic (% change since 2000)
Races - Native Hawaiian and Other Pacific Islander alone (%)
Races - Native Hawaiian and Other Pacific Islander alone (% change since 2000)
Races - Two or more races(%)
Races - Two or more races(% change since 2000)
Races - Other race alone (%)
Races - Other race alone (% change since 2000)
Racial diversity
Place of birth - Born in state of residence (%)
Place of birth - Born in state of residence (%) - White
Place of birth - Born in state of residence (%) - Black or African American
Place of birth - Born in state of residence (%) - Asian
Place of birth - Born in state of residence (%) - Hispanic or Latino
Place of birth - Born in state of residence (%) - American Indian and Alaska Native
Place of birth - Born in state of residence (%) - Multirace
Place of birth - Born in state of residence (%) - Other Race
Place of birth - Born in other state (%)
Place of birth - Born in other state (%) - White
Place of birth - Born in other state (%) - Black or African American
Place of birth - Born in other state (%) - Asian
Place of birth - Born in other state (%) - Hispanic or Latino
Place of birth - Born in other state (%) - American Indian and Alaska Native
Place of birth - Born in other state (%) - Multirace
Place of birth - Born in other state (%) - Other Race
Place of birth - Native, outside of US (%)
Place of birth - Native, outside of US (%) - White
Place of birth - Native, outside of US (%) - Black or African American
Place of birth - Native, outside of US (%) - Asian
Place of birth - Native, outside of US (%) - Hispanic or Latino
Place of birth - Native, outside of US (%) - American Indian and Alaska Native
Place of birth - Native, outside of US (%) - Multirace
Place of birth - Native, outside of US (%) - Other Race
Place of birth - Foreign born (%)
Place of birth - Foreign born (%) - White
Place of birth - Foreign born (%) - Black or African American
Place of birth - Foreign born (%) - Asian
Place of birth - Foreign born (%) - Hispanic or Latino
Place of birth - Foreign born (%) - American Indian and Alaska Native
Place of birth - Foreign born (%) - Multirace
Place of birth - Foreign born (%) - Other Race
Residents speaking English at home (%)
Residents speaking English at home - Born in the United States (%)
Residents speaking English at home - Native, born elsewhere (%)
Residents speaking English at home - Foreign born (%)
Residents speaking Spanish at home (%)
Residents speaking Spanish at home - Born in the United States (%)
Residents speaking Spanish at home - Native, born elsewhere (%)
Residents speaking Spanish at home - Foreign born (%)
Residents speaking other language at home (%)
Residents speaking other language at home - Born in the United States (%)
Residents speaking other language at home - Native, born elsewhere (%)
Residents speaking other language at home - Foreign born (%)
Marital status - Never married (%)
Marital status - Now married (%)
Marital status - Separated (%)
Marital status - Widowed (%)
Marital status - Divorced (%)
Ancestries Reported - Arab (%)
Ancestries Reported - Czech (%)
Ancestries Reported - Danish (%)
Ancestries Reported - Dutch (%)
Ancestries Reported - English (%)
Ancestries Reported - French (%)
Ancestries Reported - French Canadian (%)
Ancestries Reported - German (%)
Ancestries Reported - Greek (%)
Ancestries Reported - Hungarian (%)
Ancestries Reported - Irish (%)
Ancestries Reported - Italian (%)
Ancestries Reported - Lithuanian (%)
Ancestries Reported - Norwegian (%)
Ancestries Reported - Polish (%)
Ancestries Reported - Portuguese (%)
Ancestries Reported - Russian (%)
Ancestries Reported - Scotch-Irish (%)
Ancestries Reported - Scottish (%)
Ancestries Reported - Slovak (%)
Ancestries Reported - Subsaharan African (%)
Ancestries Reported - Swedish (%)
Ancestries Reported - Swiss (%)
Ancestries Reported - Ukrainian (%)
Ancestries Reported - United States (%)
Ancestries Reported - Welsh (%)
Ancestries Reported - West Indian (%)
Ancestries Reported - Other (%)
Geographical mobility - Same house 1 year ago (%)
Geographical mobility - Same house 1 year ago (%) - White
Geographical mobility - Same house 1 year ago (%) - Black or African American
Geographical mobility - Same house 1 year ago (%) - Asian
Geographical mobility - Same house 1 year ago (%) - Hispanic or Latino
Geographical mobility - Same house 1 year ago (%) - American Indian and Alaska Native
Geographical mobility - Same house 1 year ago (%) - Multirace
Geographical mobility - Same house 1 year ago (%) - Other Race
Geographical mobility - Moved within same county (%)
Geographical mobility - Moved within same county (%) - White
Geographical mobility - Moved within same county (%) - Black or African American
Geographical mobility - Moved within same county (%) - Asian
Geographical mobility - Moved within same county (%) - Hispanic or Latino
Geographical mobility - Moved within same county (%) - American Indian and Alaska Native
Geographical mobility - Moved within same county (%) - Multirace
Geographical mobility - Moved within same county (%) - Other Race
Geographical mobility - Moved from different county within same state (%)
Geographical mobility - Moved from different county within same state (%) - White
Geographical mobility - Moved from different county within same state (%) - Black or African American
Geographical mobility - Moved from different county within same state (%) - Asian
Geographical mobility - Moved from different county within same state (%) - Hispanic or Latino
Geographical mobility - Moved from different county within same state (%) - American Indian and Alaska Native
Geographical mobility - Moved from different county within same state (%) - Multirace
Geographical mobility - Moved from different county within same state (%) - Other Race
Geographical mobility - Moved from different state (%)
Geographical mobility - Moved from different state (%) - White
Geographical mobility - Moved from different state (%) - Black or African American
Geographical mobility - Moved from different state (%) - Asian
Geographical mobility - Moved from different state (%) - Hispanic or Latino
Geographical mobility - Moved from different state (%) - American Indian and Alaska Native
Geographical mobility - Moved from different state (%) - Multirace
Geographical mobility - Moved from different state (%) - Other Race
Geographical mobility - Moved from abroad (%)
Geographical mobility - Moved from abroad (%) - White
Geographical mobility - Moved from abroad (%) - Black or African American
Geographical mobility - Moved from abroad (%) - Asian
Geographical mobility - Moved from abroad (%) - Hispanic or Latino
Geographical mobility - Moved from abroad (%) - American Indian and Alaska Native
Geographical mobility - Moved from abroad (%) - Multirace
Geographical mobility - Moved from abroad (%) - Other Race
Place of birth for the foreign-born population - Ireland (%)
Place of birth for the foreign-born population - Denmark (%)
Place of birth for the foreign-born population - Norway (%)
Place of birth for the foreign-born population - Sweden (%)
Place of birth for the foreign-born population - United Kingdom (%)
Place of birth for the foreign-born population - England (%)
Place of birth for the foreign-born population - Scotland (%)
Place of birth for the foreign-born population - Other Northern Europe (%)
Place of birth for the foreign-born population - Austria (%)
Place of birth for the foreign-born population - Belgium (%)
Place of birth for the foreign-born population - France (%)
Place of birth for the foreign-born population - Germany (%)
Place of birth for the foreign-born population - Netherlands (%)
Place of birth for the foreign-born population - Switzerland (%)
Place of birth for the foreign-born population - Other Western Europe (%)
Place of birth for the foreign-born population - Greece (%)
Place of birth for the foreign-born population - Italy (%)
Place of birth for the foreign-born population - Portugal (%)
Place of birth for the foreign-born population - Spain (%)
Place of birth for the foreign-born population - Other Southern Europe (%)
Place of birth for the foreign-born population - Albania (%)
Place of birth for the foreign-born population - Belarus (%)
Place of birth for the foreign-born population - Bosnia and Herzegovina (%)
Place of birth for the foreign-born population - Bulgaria (%)
Place of birth for the foreign-born population - Croatia (%)
Place of birth for the foreign-born population - Czechoslovakia (%)
Place of birth for the foreign-born population - Hungary (%)
Place of birth for the foreign-born population - Latvia (%)
Place of birth for the foreign-born population - Lithuania (%)
Place of birth for the foreign-born population - North Macedonia (Macedonia) (%)
Place of birth for the foreign-born population - Moldova (%)
Place of birth for the foreign-born population - Poland (%)
Place of birth for the foreign-born population - Romania (%)
Place of birth for the foreign-born population - Russia (%)
Place of birth for the foreign-born population - Serbia (%)
Place of birth for the foreign-born population - Ukraine (%)
Place of birth for the foreign-born population - Other Eastern Europe (%)
Place of birth for the foreign-born population - China (%)
Place of birth for the foreign-born population - Hong Kong (%)
Place of birth for the foreign-born population - Taiwan (%)
Place of birth for the foreign-born population - Japan (%)
Place of birth for the foreign-born population - Korea (%)
Place of birth for the foreign-born population - Other Eastern Asia (%)
Place of birth for the foreign-born population - Afghanistan (%)
Place of birth for the foreign-born population - Bangladesh (%)
Place of birth for the foreign-born population - India (%)
Place of birth for the foreign-born population - Iran (%)
Place of birth for the foreign-born population - Kazakhstan (%)
Place of birth for the foreign-born population - Nepal (%)
Place of birth for the foreign-born population - Pakistan (%)
Place of birth for the foreign-born population - Sri Lanka (%)
Place of birth for the foreign-born population - Uzbekistan (%)
Place of birth for the foreign-born population - Other South Central Asia (%)
Place of birth for the foreign-born population - Burma (%)
Place of birth for the foreign-born population - Cambodia (%)
Place of birth for the foreign-born population - Indonesia (%)
Place of birth for the foreign-born population - Laos (%)
Place of birth for the foreign-born population - Malaysia (%)
Place of birth for the foreign-born population - Philippines (%)
Place of birth for the foreign-born population - Singapore (%)
Place of birth for the foreign-born population - Thailand (%)
Place of birth for the foreign-born population - Vietnam (%)
Place of birth for the foreign-born population - Other South Eastern Asia (%)
Place of birth for the foreign-born population - Armenia (%)
Place of birth for the foreign-born population - Iraq (%)
Place of birth for the foreign-born population - Israel (%)
Place of birth for the foreign-born population - Jordan (%)
Place of birth for the foreign-born population - Kuwait (%)
Place of birth for the foreign-born population - Lebanon (%)
Place of birth for the foreign-born population - Saudi Arabia (%)
Place of birth for the foreign-born population - Syria (%)
Place of birth for the foreign-born population - Turkey (%)
Place of birth for the foreign-born population - Yemen (%)
Place of birth for the foreign-born population - Other Western Asia (%)
Place of birth for the foreign-born population - Eritrea (%)
Place of birth for the foreign-born population - Ethiopia (%)
Place of birth for the foreign-born population - Kenya (%)
Place of birth for the foreign-born population - Somalia (%)
Place of birth for the foreign-born population - Uganda (%)
Place of birth for the foreign-born population - Zimbabwe (%)
Place of birth for the foreign-born population - Other Eastern Africa (%)
Place of birth for the foreign-born population - Cameroon (%)
Place of birth for the foreign-born population - Congo (%)
Place of birth for the foreign-born population - Democratic Republic of Congo (Zaire) (%)
Place of birth for the foreign-born population - Other Middle Africa (%)
Place of birth for the foreign-born population - Egypt (%)
Place of birth for the foreign-born population - Morocco (%)
Place of birth for the foreign-born population - Sudan (%)
Place of birth for the foreign-born population - Other Northern Africa (%)
Place of birth for the foreign-born population - South Africa (%)
Place of birth for the foreign-born population - Other Southern Africa (%)
Place of birth for the foreign-born population - Cabo Verde (%)
Place of birth for the foreign-born population - Ghana (%)
Place of birth for the foreign-born population - Liberia (%)
Place of birth for the foreign-born population - Nigeria (%)
Place of birth for the foreign-born population - Senegal (%)
Place of birth for the foreign-born population - Sierra Leone (%)
Place of birth for the foreign-born population - Other Western Africa (%)
Place of birth for the foreign-born population - Australia (%)
Place of birth for the foreign-born population - New Zealand (%)
Place of birth for the foreign-born population - Fiji (%)
Place of birth for the foreign-born population - Micronesia (%)
Place of birth for the foreign-born population - Bahamas (%)
Place of birth for the foreign-born population - Barbados (%)
Place of birth for the foreign-born population - Cuba (%)
Place of birth for the foreign-born population - Dominica (%)
Place of birth for the foreign-born population - Dominican Republic (%)
Place of birth for the foreign-born population - Grenada (%)
Place of birth for the foreign-born population - Haiti (%)
Place of birth for the foreign-born population - Jamaica (%)
Place of birth for the foreign-born population - St. Vincent and the Grenadines (%)
Place of birth for the foreign-born population - Trinidad and Tobago (%)
Place of birth for the foreign-born population - West Indies (%)
Place of birth for the foreign-born population - Other Caribbean (%)
Place of birth for the foreign-born population - Belize (%)
Place of birth for the foreign-born population - Costa Rica (%)
Place of birth for the foreign-born population - El Salvador (%)
Place of birth for the foreign-born population - Guatemala (%)
Place of birth for the foreign-born population - Honduras (%)
Place of birth for the foreign-born population - Mexico (%)
Place of birth for the foreign-born population - Nicaragua (%)
Place of birth for the foreign-born population - Panama (%)
Place of birth for the foreign-born population - Other Central America (%)
Place of birth for the foreign-born population - Argentina (%)
Place of birth for the foreign-born population - Bolivia (%)
Place of birth for the foreign-born population - Brazil (%)
Place of birth for the foreign-born population - Chile (%)
Place of birth for the foreign-born population - Colombia (%)
Place of birth for the foreign-born population - Ecuador (%)
Place of birth for the foreign-born population - Guyana (%)
Place of birth for the foreign-born population - Peru (%)
Place of birth for the foreign-born population - Uruguay (%)
Place of birth for the foreign-born population - Venezuela (%)
Place of birth for the foreign-born population - Other South America (%)
Place of birth for the foreign-born population - Canada (%)
Place of birth for the foreign-born population - Other Northern America (%)
Place of birth for the foreign-born population - Other (%)
Latest news about races in Vernon, TX collected exclusively by city-data.com from local newspapers, TV, and radio stations
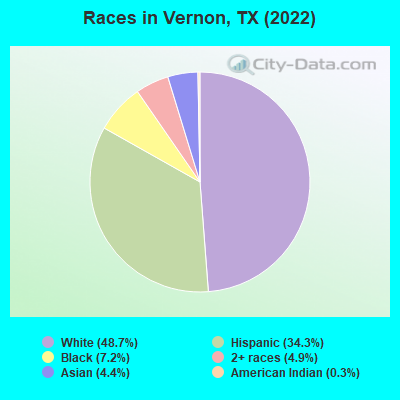
According to 2022 data, the most numerous races in Vernon, TX are Hispanic (3,530 residents), White alone (5,009 residents), and Black alone (744 residents). 76.0% of Vernon residents speak English at home. 6.7% of Vernon, TX residents are foreign-born (4.3% born in Latin America, 2.2% born in Asia), which is 154.2% less than the foreign-born rate of 17.0% across the entire state of Texas.
Race distribution in Vernon
2000 2022
10,933,313 52.4% White alone 6,669,666 32.0% Hispanic 2,364,255 11.3% Black alone 554,445 2.7% Asian alone 230,567 1.1% Two or more races 68,859 0.3% American Indian alone 19,958 0.10% Other race alone 10,757 0.05% Native Hawaiian and Other
12,070,642 40.2% Hispanic 11,683,430 38.9% White alone 3,508,706 11.7% Black alone 1,608,173 5.4% Asian alone 956,560 3.2% Two or more races 125,763 0.4% Other race alone 47,023 0.2% American Indian alone 29,275 0.10% Native Hawaiian and Other
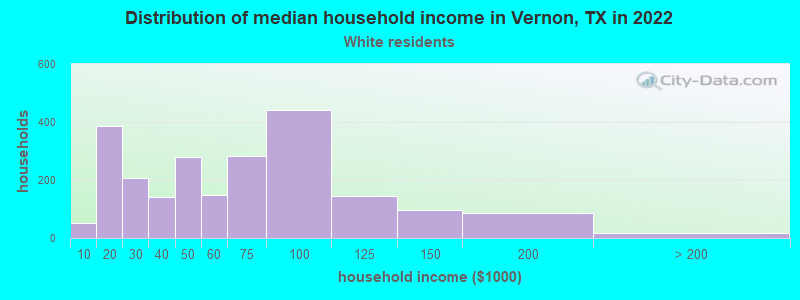
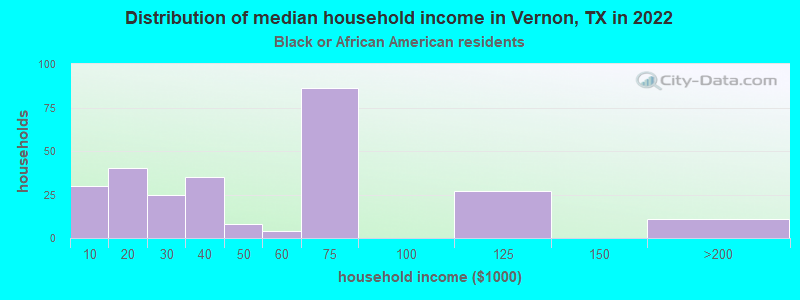
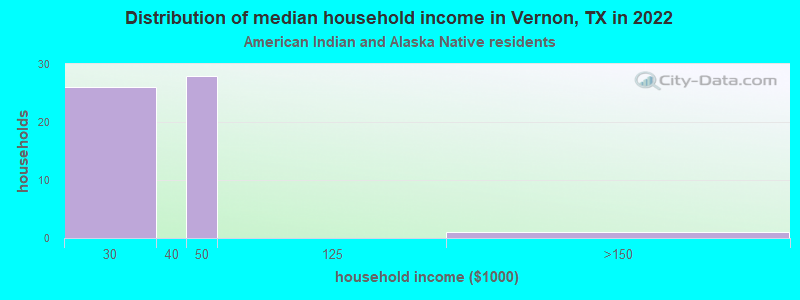
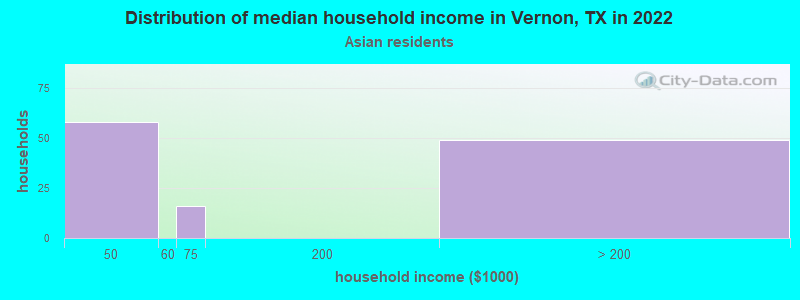
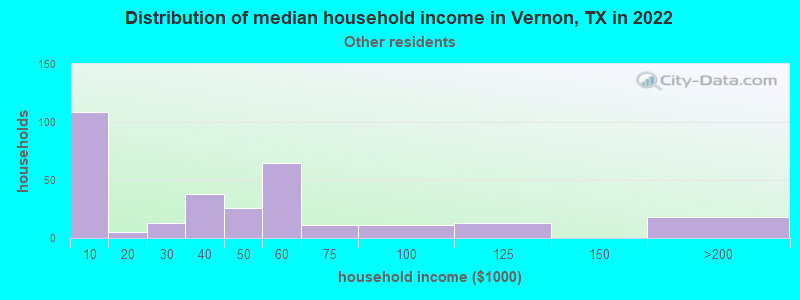
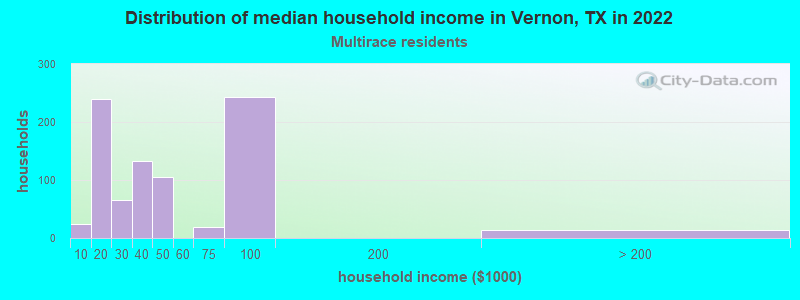
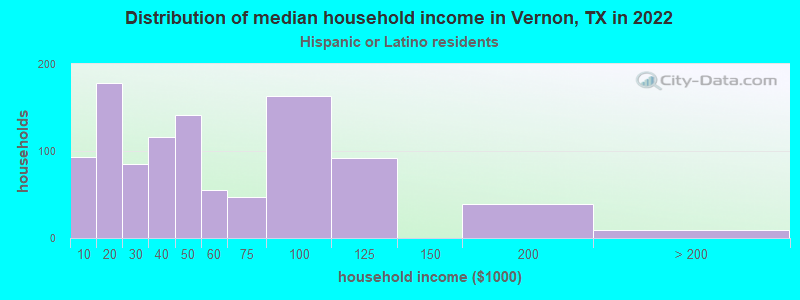
Income and house value in Vernon Median household income in 2022 $50,003 White non-Hispanic householders$48,734 Black householders$36,301 American Indian and Alaska Native householders$33,982 Some other race householders$36,956 Two or more races householders$41,515 Hispanic or Latino race householdersMedian 2022 house value $111,337 White Non-Hispanic householders$59,032 Black or African American householders$184,477 American Indian or Alaska Native householders $206,180 Asian householders$49,917 Some other race householders$27,129 Two or more races householders$51,653 Hispanic or Latino householders
Median age by race in Vernon
45.3 Median age for White residents38.9 46.9 32.3 Median age for Black or African American residents51.3 31.6 47.4 Median age for American Indian / Alaska Native residents44.0 59.7 15.5 Median age for Asian residents12.0 17.8 -581,560,283.1 Median age for Native Hawaiian / Pacific Islander residents-612,729,233.5 -577,777,777.2 36.0 Median age for Other race residents28.7 36.3 37.7 Median age for Two or more races residents42.6 28.6 45.7 Median age for White alone residents43.9 46.2 31.3 Median age for Hispanic or Latino residents30.1 32.6
Owner/renter occupied households by race in Vernon
House owners and renters - White residents 1,456 62.2% Owner occupied886 37.8% Renter occupiedHouse owners and renters - Black or African American residents 85 32.5% Owner occupied176 67.5% Renter occupiedHouse owners and renters - American Indian / Alaska Native residents 12 28.3% Owner occupied30 71.7% Renter occupiedHouse owners and renters - Asian residents 121 100.0% Owner occupiedHouse owners and renters - Other race residents 250 80.7% Owner occupied60 19.3% Renter occupiedHouse owners and renters - Two or more races residents 221 26.2% Owner occupied623 73.8% Renter occupiedHouse owners and renters - White alone residents 1,392 59.7% Owner occupied939 40.3% Renter occupiedHouse owners and renters - Hispanic or Latino residents 570 55.8% Owner occupied452 44.2% Renter occupied
Language usage in Vernon
English speakers - Total 76.0% of residents of Vernon speak English at home.
20.9% of residents speak Spanish at home 1,510 75.0% Speak English very well504 25.0% Speak English less than very well3.0% of residents speak other language at home 262 90.0% Speak English very well29 10.0% Speak English less than very well
English speakers - Born in the United States 85.2% of residents of Vernon speak English at home.
13.2% of residents speak Spanish at home 295 97.0% Speak English very well9 3.0% Speak English less than very well1.6% of residents speak other language at home 36 100.0% Speak English very well
English speakers - Native, born elsewhere 70.4% of residents of Vernon speak English at home.
25.9% of residents speak Spanish at home 14 100.0% Speak English less than very well
English speakers - Foreign-born 4.4% of residents of Vernon speak English at home.
59.9% of residents speak Spanish at home 135 32.8% Speak English very well277 67.2% Speak English less than very well36.5% of residents speak other language at home 222 88.4% Speak English very well29 11.6% Speak English less than very well
White (Caucasian) - Speak only English Native:
98.0% (5,086)Foreign-born:
5.2% (4)
White (Caucasian) - Speak another language Native:
5.8% (302)Foreign-born:
85.7% (67)
Asian - Speak another language Native:
98.9% (42)Foreign-born:
99.6% (222)
Other race - Speak only English Native:
13.2% (113)Foreign-born:
15.3% (34)
Other race - Speak another language Native:
85.3% (729)Foreign-born:
85.4% (188)
Two or more races - Speak another language Native:
34.2% (701)Foreign-born:
100.0% (199)
White alone - Speak only English Native:
99.5% (4,842)Foreign-born:
20.9% (5)
White alone - Speak another language Native:
0.7% (33)Foreign-born:
79.0% (18)
Hispanic or Latino - Speak only English Native:
44.5% (1,259)Foreign-born:
6.2% (27)
Hispanic or Latino - Speak another language Native:
55.6% (1,575)Foreign-born:
93.9% (405)
Foreign-born residents in Vernon 688 residents are foreign born (4.3% Latin America , 2.2% Asia ).
This city:
6.7%Texas:
17.1%
Marital status for residents in Vernon Marital status - White (Caucasian) population 15 years and over
Males 37.5% Never married37.7% Now married3.9% Separated7.8% Widowed13.1% DivorcedFemales 18.8% Never married45.0% Now married0.3% Separated13.6% Widowed22.3% DivorcedWomen who gave birth in the past 12 months Now married:
65.8% (62)Unmarried:
34.2% (32)
Women who did not give birth in the past 12 months Now married:
48.4% (484)Unmarried:
51.6% (515)
Marital status - Black or African American population 15 years and over
Males 34.5% Never married35.4% Now married0.0% Separated24.3% Widowed5.8% DivorcedFemales 86.0% Never married7.7% Now married4.0% Separated0.5% Widowed1.7% DivorcedWomen who gave birth in the past 12 months Now married:
0.0% (0)Unmarried:
100.0% (6)
Women who did not give birth in the past 12 months Now married:
1.2% (3)Unmarried:
98.8% (243)
Marital status - American Indian / Alaska Native population 15 years and over
Males 37.5% Never married50.0% Now married0.0% Separated0.0% Widowed12.5% DivorcedFemales 20.5% Never married43.6% Now married0.0% Separated0.0% Widowed35.9% DivorcedWomen who did not give birth in the past 12 months Now married:
55.6% (14)Unmarried:
44.4% (11)
Marital status - Asian population 15 years and over
Males 37.4% Never married62.6% Now married0.0% Separated0.0% Widowed0.0% DivorcedFemales 24.8% Never married75.2% Now married0.0% Separated0.0% Widowed0.0% DivorcedWomen who did not give birth in the past 12 months Now married:
60.8% (48)Unmarried:
39.2% (31)
Marital status - Other race population 15 years and over
Males 55.8% Never married30.8% Now married0.0% Separated5.8% Widowed7.6% DivorcedFemales 10.4% Never married78.3% Now married0.0% Separated5.2% Widowed6.1% DivorcedWomen who did not give birth in the past 12 months Now married:
82.0% (150)Unmarried:
18.0% (33)
Marital status - Two or more races population 15 years and over
Males 22.0% Never married47.4% Now married0.0% Separated6.1% Widowed24.6% DivorcedFemales 64.8% Never married25.8% Now married2.0% Separated6.1% Widowed1.4% DivorcedWomen who gave birth in the past 12 months Now married:
0.0% (0)Unmarried:
100.0% (24)
Women who did not give birth in the past 12 months Now married:
27.8% (205)Unmarried:
72.2% (535)
Marital status - White alone, not Hispanic / Latino population 15 years and over
Males 30.8% Never married40.3% Now married3.8% Separated9.1% Widowed15.9% DivorcedFemales 15.9% Never married45.6% Now married0.1% Separated15.3% Widowed23.0% DivorcedWomen who gave birth in the past 12 months Now married:
100.0% (71)Unmarried:
0.0% (0)
Women who did not give birth in the past 12 months Now married:
53.8% (537)Unmarried:
46.2% (461)
Marital status - Hispanic or Latino population 15 years and over
Males 47.6% Never married35.2% Now married1.8% Separated4.0% Widowed11.4% DivorcedFemales 43.7% Never married42.9% Now married1.5% Separated4.4% Widowed7.5% DivorcedWomen who gave birth in the past 12 months Now married:
9.4% (5)Unmarried:
90.6% (50)
Women who did not give birth in the past 12 months Now married:
39.1% (300)Unmarried:
60.9% (468)
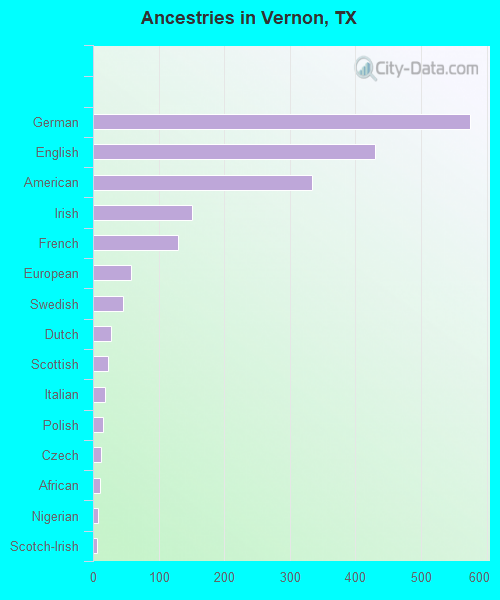
Ancestries in Vernon
575 12.0% German430 9.0% English334 7.0% American151 3.2% Irish130 2.7% French58 1.2% European45 0.9% Swedish27 0.6% Dutch23 0.5% Scottish18 0.4% Italian15 0.3% Polish12 0.3% Czech11 0.2% African7 0.1% Nigerian6 0.1% Scotch-Irish4 0.08% Austrian
Children Nativity (place of birth) in Vernon
Children under 6 years - Living with two parents Both parents native 347 100.0% NativeBoth parents foreign-born 166 100.0% NativeChildren under 6 years - Living with one parent Native parent 239 100.0% NativeChildren 6 to 17 years - Living with two parents Both parents native 478 99.9% Native0 0.1% Foreign-bornBoth parents foreign-born 59 48.5% Native62 51.5% Foreign-bornOne native, one foreign-born parent 97 100.0% NativeChildren 6 to 17 years - Living with one parent Native parent 858 100.0% Native
Grandparents responsible for own grandchildren in Vernon
Grandparents (30 to 59 years) White / Caucasian 12 100.0% Responsible for grandchildrenBlack or African American 9 100.0% Not responsible for grandchildrenTwo or more races 18 100.0% Responsible for grandchildrenWhite alone, not Hispanic / Latino 12 100.0% Responsible for grandchildrenHispanic or Latino 15 100.0% Responsible for grandchildrenGrandparents (60 years and over) White / Caucasian 46 100.0% Responsible for grandchildrenBlack or African American 15 26.7% Responsible for grandchildren42 73.3% Not responsible for grandchildrenWhite alone, not Hispanic / Latino 55 100.0% Responsible for grandchildrenHispanic or Latino 6 100.0% Not responsible for grandchildren