Races in Upper Grand Lagoon, Florida (FL) Detailed Stats
Data:
Races - White alone (%)
Races - White alone (% change since 2000)
Races - Black alone (%)
Races - Black alone (% change since 2000)
Races - American Indian alone (%)
Races - American Indian alone (% change since 2000)
Races - Asian alone (%)
Races - Asian alone (% change since 2000)
Races - Hispanic (%)
Races - Hispanic (% change since 2000)
Races - Native Hawaiian and Other Pacific Islander alone (%)
Races - Native Hawaiian and Other Pacific Islander alone (% change since 2000)
Races - Two or more races(%)
Races - Two or more races(% change since 2000)
Races - Other race alone (%)
Races - Other race alone (% change since 2000)
Racial diversity
Place of birth - Born in state of residence (%)
Place of birth - Born in state of residence (%) - White
Place of birth - Born in state of residence (%) - Black or African American
Place of birth - Born in state of residence (%) - Asian
Place of birth - Born in state of residence (%) - Hispanic or Latino
Place of birth - Born in state of residence (%) - American Indian and Alaska Native
Place of birth - Born in state of residence (%) - Multirace
Place of birth - Born in state of residence (%) - Other Race
Place of birth - Born in other state (%)
Place of birth - Born in other state (%) - White
Place of birth - Born in other state (%) - Black or African American
Place of birth - Born in other state (%) - Asian
Place of birth - Born in other state (%) - Hispanic or Latino
Place of birth - Born in other state (%) - American Indian and Alaska Native
Place of birth - Born in other state (%) - Multirace
Place of birth - Born in other state (%) - Other Race
Place of birth - Native, outside of US (%)
Place of birth - Native, outside of US (%) - White
Place of birth - Native, outside of US (%) - Black or African American
Place of birth - Native, outside of US (%) - Asian
Place of birth - Native, outside of US (%) - Hispanic or Latino
Place of birth - Native, outside of US (%) - American Indian and Alaska Native
Place of birth - Native, outside of US (%) - Multirace
Place of birth - Native, outside of US (%) - Other Race
Place of birth - Foreign born (%)
Place of birth - Foreign born (%) - White
Place of birth - Foreign born (%) - Black or African American
Place of birth - Foreign born (%) - Asian
Place of birth - Foreign born (%) - Hispanic or Latino
Place of birth - Foreign born (%) - American Indian and Alaska Native
Place of birth - Foreign born (%) - Multirace
Place of birth - Foreign born (%) - Other Race
Residents speaking English at home (%)
Residents speaking English at home - Born in the United States (%)
Residents speaking English at home - Native, born elsewhere (%)
Residents speaking English at home - Foreign born (%)
Residents speaking Spanish at home (%)
Residents speaking Spanish at home - Born in the United States (%)
Residents speaking Spanish at home - Native, born elsewhere (%)
Residents speaking Spanish at home - Foreign born (%)
Residents speaking other language at home (%)
Residents speaking other language at home - Born in the United States (%)
Residents speaking other language at home - Native, born elsewhere (%)
Residents speaking other language at home - Foreign born (%)
Marital status - Never married (%)
Marital status - Now married (%)
Marital status - Separated (%)
Marital status - Widowed (%)
Marital status - Divorced (%)
Ancestries Reported - Arab (%)
Ancestries Reported - Czech (%)
Ancestries Reported - Danish (%)
Ancestries Reported - Dutch (%)
Ancestries Reported - English (%)
Ancestries Reported - French (%)
Ancestries Reported - French Canadian (%)
Ancestries Reported - German (%)
Ancestries Reported - Greek (%)
Ancestries Reported - Hungarian (%)
Ancestries Reported - Irish (%)
Ancestries Reported - Italian (%)
Ancestries Reported - Lithuanian (%)
Ancestries Reported - Norwegian (%)
Ancestries Reported - Polish (%)
Ancestries Reported - Portuguese (%)
Ancestries Reported - Russian (%)
Ancestries Reported - Scotch-Irish (%)
Ancestries Reported - Scottish (%)
Ancestries Reported - Slovak (%)
Ancestries Reported - Subsaharan African (%)
Ancestries Reported - Swedish (%)
Ancestries Reported - Swiss (%)
Ancestries Reported - Ukrainian (%)
Ancestries Reported - United States (%)
Ancestries Reported - Welsh (%)
Ancestries Reported - West Indian (%)
Ancestries Reported - Other (%)
Geographical mobility - Same house 1 year ago (%)
Geographical mobility - Same house 1 year ago (%) - White
Geographical mobility - Same house 1 year ago (%) - Black or African American
Geographical mobility - Same house 1 year ago (%) - Asian
Geographical mobility - Same house 1 year ago (%) - Hispanic or Latino
Geographical mobility - Same house 1 year ago (%) - American Indian and Alaska Native
Geographical mobility - Same house 1 year ago (%) - Multirace
Geographical mobility - Same house 1 year ago (%) - Other Race
Geographical mobility - Moved within same county (%)
Geographical mobility - Moved within same county (%) - White
Geographical mobility - Moved within same county (%) - Black or African American
Geographical mobility - Moved within same county (%) - Asian
Geographical mobility - Moved within same county (%) - Hispanic or Latino
Geographical mobility - Moved within same county (%) - American Indian and Alaska Native
Geographical mobility - Moved within same county (%) - Multirace
Geographical mobility - Moved within same county (%) - Other Race
Geographical mobility - Moved from different county within same state (%)
Geographical mobility - Moved from different county within same state (%) - White
Geographical mobility - Moved from different county within same state (%) - Black or African American
Geographical mobility - Moved from different county within same state (%) - Asian
Geographical mobility - Moved from different county within same state (%) - Hispanic or Latino
Geographical mobility - Moved from different county within same state (%) - American Indian and Alaska Native
Geographical mobility - Moved from different county within same state (%) - Multirace
Geographical mobility - Moved from different county within same state (%) - Other Race
Geographical mobility - Moved from different state (%)
Geographical mobility - Moved from different state (%) - White
Geographical mobility - Moved from different state (%) - Black or African American
Geographical mobility - Moved from different state (%) - Asian
Geographical mobility - Moved from different state (%) - Hispanic or Latino
Geographical mobility - Moved from different state (%) - American Indian and Alaska Native
Geographical mobility - Moved from different state (%) - Multirace
Geographical mobility - Moved from different state (%) - Other Race
Geographical mobility - Moved from abroad (%)
Geographical mobility - Moved from abroad (%) - White
Geographical mobility - Moved from abroad (%) - Black or African American
Geographical mobility - Moved from abroad (%) - Asian
Geographical mobility - Moved from abroad (%) - Hispanic or Latino
Geographical mobility - Moved from abroad (%) - American Indian and Alaska Native
Geographical mobility - Moved from abroad (%) - Multirace
Geographical mobility - Moved from abroad (%) - Other Race
Place of birth for the foreign-born population - Ireland (%)
Place of birth for the foreign-born population - Denmark (%)
Place of birth for the foreign-born population - Norway (%)
Place of birth for the foreign-born population - Sweden (%)
Place of birth for the foreign-born population - United Kingdom (%)
Place of birth for the foreign-born population - England (%)
Place of birth for the foreign-born population - Scotland (%)
Place of birth for the foreign-born population - Other Northern Europe (%)
Place of birth for the foreign-born population - Austria (%)
Place of birth for the foreign-born population - Belgium (%)
Place of birth for the foreign-born population - France (%)
Place of birth for the foreign-born population - Germany (%)
Place of birth for the foreign-born population - Netherlands (%)
Place of birth for the foreign-born population - Switzerland (%)
Place of birth for the foreign-born population - Other Western Europe (%)
Place of birth for the foreign-born population - Greece (%)
Place of birth for the foreign-born population - Italy (%)
Place of birth for the foreign-born population - Portugal (%)
Place of birth for the foreign-born population - Spain (%)
Place of birth for the foreign-born population - Other Southern Europe (%)
Place of birth for the foreign-born population - Albania (%)
Place of birth for the foreign-born population - Belarus (%)
Place of birth for the foreign-born population - Bosnia and Herzegovina (%)
Place of birth for the foreign-born population - Bulgaria (%)
Place of birth for the foreign-born population - Croatia (%)
Place of birth for the foreign-born population - Czechoslovakia (%)
Place of birth for the foreign-born population - Hungary (%)
Place of birth for the foreign-born population - Latvia (%)
Place of birth for the foreign-born population - Lithuania (%)
Place of birth for the foreign-born population - North Macedonia (Macedonia) (%)
Place of birth for the foreign-born population - Moldova (%)
Place of birth for the foreign-born population - Poland (%)
Place of birth for the foreign-born population - Romania (%)
Place of birth for the foreign-born population - Russia (%)
Place of birth for the foreign-born population - Serbia (%)
Place of birth for the foreign-born population - Ukraine (%)
Place of birth for the foreign-born population - Other Eastern Europe (%)
Place of birth for the foreign-born population - China (%)
Place of birth for the foreign-born population - Hong Kong (%)
Place of birth for the foreign-born population - Taiwan (%)
Place of birth for the foreign-born population - Japan (%)
Place of birth for the foreign-born population - Korea (%)
Place of birth for the foreign-born population - Other Eastern Asia (%)
Place of birth for the foreign-born population - Afghanistan (%)
Place of birth for the foreign-born population - Bangladesh (%)
Place of birth for the foreign-born population - India (%)
Place of birth for the foreign-born population - Iran (%)
Place of birth for the foreign-born population - Kazakhstan (%)
Place of birth for the foreign-born population - Nepal (%)
Place of birth for the foreign-born population - Pakistan (%)
Place of birth for the foreign-born population - Sri Lanka (%)
Place of birth for the foreign-born population - Uzbekistan (%)
Place of birth for the foreign-born population - Other South Central Asia (%)
Place of birth for the foreign-born population - Burma (%)
Place of birth for the foreign-born population - Cambodia (%)
Place of birth for the foreign-born population - Indonesia (%)
Place of birth for the foreign-born population - Laos (%)
Place of birth for the foreign-born population - Malaysia (%)
Place of birth for the foreign-born population - Philippines (%)
Place of birth for the foreign-born population - Singapore (%)
Place of birth for the foreign-born population - Thailand (%)
Place of birth for the foreign-born population - Vietnam (%)
Place of birth for the foreign-born population - Other South Eastern Asia (%)
Place of birth for the foreign-born population - Armenia (%)
Place of birth for the foreign-born population - Iraq (%)
Place of birth for the foreign-born population - Israel (%)
Place of birth for the foreign-born population - Jordan (%)
Place of birth for the foreign-born population - Kuwait (%)
Place of birth for the foreign-born population - Lebanon (%)
Place of birth for the foreign-born population - Saudi Arabia (%)
Place of birth for the foreign-born population - Syria (%)
Place of birth for the foreign-born population - Turkey (%)
Place of birth for the foreign-born population - Yemen (%)
Place of birth for the foreign-born population - Other Western Asia (%)
Place of birth for the foreign-born population - Eritrea (%)
Place of birth for the foreign-born population - Ethiopia (%)
Place of birth for the foreign-born population - Kenya (%)
Place of birth for the foreign-born population - Somalia (%)
Place of birth for the foreign-born population - Uganda (%)
Place of birth for the foreign-born population - Zimbabwe (%)
Place of birth for the foreign-born population - Other Eastern Africa (%)
Place of birth for the foreign-born population - Cameroon (%)
Place of birth for the foreign-born population - Congo (%)
Place of birth for the foreign-born population - Democratic Republic of Congo (Zaire) (%)
Place of birth for the foreign-born population - Other Middle Africa (%)
Place of birth for the foreign-born population - Egypt (%)
Place of birth for the foreign-born population - Morocco (%)
Place of birth for the foreign-born population - Sudan (%)
Place of birth for the foreign-born population - Other Northern Africa (%)
Place of birth for the foreign-born population - South Africa (%)
Place of birth for the foreign-born population - Other Southern Africa (%)
Place of birth for the foreign-born population - Cabo Verde (%)
Place of birth for the foreign-born population - Ghana (%)
Place of birth for the foreign-born population - Liberia (%)
Place of birth for the foreign-born population - Nigeria (%)
Place of birth for the foreign-born population - Senegal (%)
Place of birth for the foreign-born population - Sierra Leone (%)
Place of birth for the foreign-born population - Other Western Africa (%)
Place of birth for the foreign-born population - Australia (%)
Place of birth for the foreign-born population - New Zealand (%)
Place of birth for the foreign-born population - Fiji (%)
Place of birth for the foreign-born population - Micronesia (%)
Place of birth for the foreign-born population - Bahamas (%)
Place of birth for the foreign-born population - Barbados (%)
Place of birth for the foreign-born population - Cuba (%)
Place of birth for the foreign-born population - Dominica (%)
Place of birth for the foreign-born population - Dominican Republic (%)
Place of birth for the foreign-born population - Grenada (%)
Place of birth for the foreign-born population - Haiti (%)
Place of birth for the foreign-born population - Jamaica (%)
Place of birth for the foreign-born population - St. Vincent and the Grenadines (%)
Place of birth for the foreign-born population - Trinidad and Tobago (%)
Place of birth for the foreign-born population - West Indies (%)
Place of birth for the foreign-born population - Other Caribbean (%)
Place of birth for the foreign-born population - Belize (%)
Place of birth for the foreign-born population - Costa Rica (%)
Place of birth for the foreign-born population - El Salvador (%)
Place of birth for the foreign-born population - Guatemala (%)
Place of birth for the foreign-born population - Honduras (%)
Place of birth for the foreign-born population - Mexico (%)
Place of birth for the foreign-born population - Nicaragua (%)
Place of birth for the foreign-born population - Panama (%)
Place of birth for the foreign-born population - Other Central America (%)
Place of birth for the foreign-born population - Argentina (%)
Place of birth for the foreign-born population - Bolivia (%)
Place of birth for the foreign-born population - Brazil (%)
Place of birth for the foreign-born population - Chile (%)
Place of birth for the foreign-born population - Colombia (%)
Place of birth for the foreign-born population - Ecuador (%)
Place of birth for the foreign-born population - Guyana (%)
Place of birth for the foreign-born population - Peru (%)
Place of birth for the foreign-born population - Uruguay (%)
Place of birth for the foreign-born population - Venezuela (%)
Place of birth for the foreign-born population - Other South America (%)
Place of birth for the foreign-born population - Canada (%)
Place of birth for the foreign-born population - Other Northern America (%)
Place of birth for the foreign-born population - Other (%)
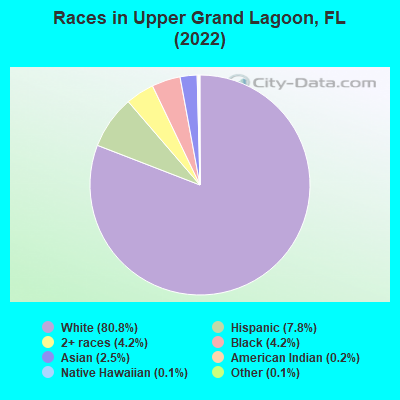
According to 2022 data, the most numerous races in Upper Grand Lagoon, FL are White alone (14,091 residents), Hispanic (1,368 residents), and Black alone (725 residents). 86.4% of Upper Grand Lagoon residents speak English at home. 13.0% of Upper Grand Lagoon, FL residents are foreign-born (5.6% born in Europe, 3.4% born in Latin America, 2.0% born in Asia), which is 61.5% less than the foreign-born rate of 21.0% across the entire state of Florida.
Race distribution in Upper Grand Lagoon
2000 2022
10,458,509 65.4% White alone 2,682,715 16.8% Hispanic 2,264,268 14.2% Black alone 261,693 1.6% Asian alone 236,954 1.5% Two or more races 42,358 0.3% American Indian alone 28,994 0.2% Other race alone 6,887 0.04% Native Hawaiian and Other
11,309,403 50.8% White alone 6,025,039 27.1% Hispanic 3,241,015 14.6% Black alone 861,630 3.9% Two or more races 623,692 2.8% Asian alone 152,054 0.7% Other race alone 22,504 0.1% American Indian alone 9,486 0.04% Native Hawaiian and Other
Income and house value in Upper Grand Lagoon Median household income in 2022 $70,659 White non-Hispanic householders$43,092 Black householders$72,269 Two or more races householders$66,643 Hispanic or Latino race householdersMedian 2022 house value $460,591 White Non-Hispanic householders$359,110 Black or African American householders$769,289 American Indian or Alaska Native householders $227,513 Asian householders$399,048 Some other race householders$368,276 Hispanic or Latino householders
Median age by race in Upper Grand Lagoon
47.1 Median age for White residents43.9 47.8 29.0 Median age for Black or African American residents31.1 23.9 47.0 Median age for American Indian / Alaska Native residents-611,418,047.3 46.9 43.5 Median age for Asian residents45.8 40.6 -679,849,340.2 Median age for Native Hawaiian / Pacific Islander residents-858,307,848.3 -443,298,968.6 21.7 Median age for Other race residents29.7 16.2 39.1 Median age for Two or more races residents32.1 43.0 46.9 Median age for White alone residents44.9 47.8 31.2 Median age for Hispanic or Latino residents35.4 28.8
Owner/renter occupied households by race in Upper Grand Lagoon
House owners and renters - White residents 5,102 75.1% Owner occupied1,695 24.9% Renter occupiedHouse owners and renters - Black or African American residents 208 55.6% Owner occupied166 44.4% Renter occupiedHouse owners and renters - American Indian / Alaska Native residents 11 100.0% Renter occupiedHouse owners and renters - Asian residents 146 87.5% Owner occupied21 12.5% Renter occupiedHouse owners and renters - Other race residents 6 3.5% Owner occupied165 96.5% Renter occupiedHouse owners and renters - Two or more races residents 118 18.9% Owner occupied505 81.1% Renter occupiedHouse owners and renters - White alone residents 4,976 74.9% Owner occupied1,671 25.1% Renter occupiedHouse owners and renters - Hispanic or Latino residents 182 43.0% Owner occupied242 57.0% Renter occupied
Language usage in Upper Grand Lagoon
English speakers - Total 86.4% of residents of Upper Grand Lagoon speak English at home.
6.1% of residents speak Spanish at home 513 50.7% Speak English very well499 49.3% Speak English less than very well7.1% of residents speak other language at home 1,020 85.9% Speak English very well167 14.1% Speak English less than very well
English speakers - Born in the United States 94.9% of residents of Upper Grand Lagoon speak English at home.
3.0% of residents speak Spanish at home 309 96.9% Speak English very well10 3.1% Speak English less than very well2.0% of residents speak other language at home 166 78.3% Speak English very well46 21.7% Speak English less than very well
English speakers - Native, born elsewhere 89.5% of residents of Upper Grand Lagoon speak English at home.
1.7% of residents speak Spanish at home 8 100.0% Speak English very well
English speakers - Foreign-born 20.0% of residents of Upper Grand Lagoon speak English at home.
31.5% of residents speak Spanish at home 233 37.2% Speak English very well394 62.8% Speak English less than very well50.9% of residents speak other language at home 884 87.4% Speak English very well127 12.6% Speak English less than very well
White (Caucasian) - Speak only English Native:
97.5% (12,234)Foreign-born:
31.6% (403)
White (Caucasian) - Speak another language Native:
2.5% (309)Foreign-born:
68.1% (868)
Black or African American - Speak only English Native:
96.7% (652)Foreign-born:
36.2% (22)
Black or African American - Speak another language Native:
3.2% (21)Foreign-born:
64.1% (39)
Asian - Speak only English Native:
82.2% (144)Foreign-born:
8.2% (21)
Asian - Speak another language Native:
18.9% (33)Foreign-born:
88.4% (228)
Other race - Speak another language Native:
8.9% (5)Foreign-born:
98.4% (371)
Two or more races - Speak only English Native:
82.9% (694)Foreign-born:
27.6% (77)
Two or more races - Speak another language Native:
16.2% (136)Foreign-born:
72.9% (204)
White alone - Speak only English Native:
97.0% (11,864)Foreign-born:
34.9% (447)
White alone - Speak another language Native:
2.8% (345)Foreign-born:
64.6% (828)
Hispanic or Latino - Speak another language Native:
16.7% (111)Foreign-born:
100.0% (588)
Foreign-born residents in Upper Grand Lagoon 2,269 residents are foreign born (5.6% Europe , 3.4% Latin America , 2.0% Asia ).
This city:
13.0%Florida:
21.1%
Marital status for residents in Upper Grand Lagoon Marital status - White (Caucasian) population 15 years and over
Males 26.7% Never married56.9% Now married0.0% Separated3.3% Widowed13.1% DivorcedFemales 18.7% Never married55.6% Now married2.7% Separated10.0% Widowed13.0% DivorcedWomen who gave birth in the past 12 months Now married:
75.2% (87)Unmarried:
24.8% (29)
Women who did not give birth in the past 12 months Now married:
47.3% (1,200)Unmarried:
52.7% (1,339)
Marital status - Black or African American population 15 years and over
Males 27.2% Never married24.3% Now married15.4% Separated0.0% Widowed33.2% DivorcedFemales 57.3% Never married31.7% Now married10.9% Separated0.0% Widowed0.0% DivorcedWomen who did not give birth in the past 12 months Now married:
25.7% (57)Unmarried:
74.3% (166)
Marital status - American Indian / Alaska Native population 15 years and over
Males 0.0% Never married100.0% Now married0.0% Separated0.0% Widowed0.0% DivorcedFemales 14.0% Never married86.0% Now married0.0% Separated0.0% Widowed0.0% DivorcedWomen who did not give birth in the past 12 months Now married:
0.0% (0)Unmarried:
100.0% (10)
Marital status - Asian population 15 years and over
Males 19.2% Never married62.2% Now married0.0% Separated0.0% Widowed18.6% DivorcedFemales 19.4% Never married72.2% Now married7.8% Separated0.6% Widowed0.0% DivorcedWomen who did not give birth in the past 12 months Now married:
67.6% (76)Unmarried:
32.4% (36)
Marital status - Other race population 15 years and over
Males 49.1% Never married50.9% Now married0.0% Separated0.0% Widowed0.0% DivorcedFemales 81.4% Never married16.7% Now married0.0% Separated0.0% Widowed1.9% DivorcedWomen who did not give birth in the past 12 months Now married:
17.1% (52)Unmarried:
82.9% (251)
Marital status - Two or more races population 15 years and over
Males 51.0% Never married36.9% Now married0.0% Separated0.0% Widowed12.0% DivorcedFemales 18.5% Never married54.2% Now married0.0% Separated15.5% Widowed11.8% DivorcedWomen who gave birth in the past 12 months Now married:
100.0% (14)Unmarried:
0.0% (0)
Women who did not give birth in the past 12 months Now married:
48.4% (113)Unmarried:
51.6% (120)
Marital status - White alone, not Hispanic / Latino population 15 years and over
Males 26.6% Never married56.3% Now married0.0% Separated3.4% Widowed13.6% DivorcedFemales 18.8% Never married55.7% Now married2.8% Separated10.3% Widowed12.4% DivorcedWomen who gave birth in the past 12 months Now married:
75.2% (89)Unmarried:
24.8% (29)
Women who did not give birth in the past 12 months Now married:
46.6% (1,152)Unmarried:
53.4% (1,320)
Marital status - Hispanic or Latino population 15 years and over
Males 33.1% Never married66.9% Now married0.0% Separated0.0% Widowed0.0% DivorcedFemales 46.6% Never married33.2% Now married0.0% Separated2.6% Widowed17.7% DivorcedWomen who did not give birth in the past 12 months Now married:
32.2% (137)Unmarried:
67.8% (288)
Ancestries in Upper Grand Lagoon
1,479 17.2% English898 10.4% American664 7.7% German649 7.5% Irish439 5.1% Italian424 4.9% Polish273 3.2% Swedish250 2.9% European215 2.5% Scottish151 1.8% Russian141 1.6% Norwegian83 1.0% British81 0.9% Scotch-Irish71 0.8% Dutch61 0.7% Bulgarian56 0.6% Scandinavian44 0.5% Syrian41 0.5% French Canadian26 0.3% French26 0.3% Lithuanian26 0.3% Northern European25 0.3% Czech22 0.3% Romanian20 0.2% Kenyan17 0.2% Austrian16 0.2% Iranian15 0.2% Ethiopian14 0.2% Celtic13 0.2% Danish12 0.1% Brazilian2 0.02% West Indian
Geographical mobility in Upper Grand Lagoon Same house 1 year ago 12,269 85.8% White (Caucasian)734 100.0% Black or African American71 92.9% American Indian / Alaska Native367 86.9% Asian10 100.0% Native Hawaiian / Pacific Islander526 85.7% Other race920 79.4% Two or more races11,941 85.5% White alone, not Hispanic / Latino1,136 84.1% Hispanic or LatinoMoved within same county 861 6.0% White / Caucasian37 5.0% Black or African American50 11.9% Asian22 3.6% Other race171 14.7% Two or more races810 5.8% White alone, not Hispanic / Latino125 9.2% Hispanic or LatinoMoved within same state 70 0.5% White / Caucasian60 9.8% Other race67 0.5% White alone, not Hispanic / Latino26 1.9% Hispanic or LatinoMoved from different state 1,039 7.3% White / Caucasian14 1.9% Black or African American6 7.8% American Indian / Alaska Native84 7.2% Two or more races1,067 7.6% White alone, not Hispanic / Latino63 4.7% Hispanic or LatinoMoved from abroad 72 0.5% White87 0.6% White alone, not Hispanic / Latino
Children Nativity (place of birth) in Upper Grand Lagoon
Children under 6 years - Living with two parents Both parents native 653 100.0% NativeBoth parents foreign-born 86 100.0% NativeOne native, one foreign-born parent 96 100.0% NativeChildren under 6 years - Living with one parent Native parent 92 100.0% NativeForeign-born parent 89 100.0% NativeChildren 6 to 17 years - Living with two parents Both parents native 887 100.0% Native0 0.0% Foreign-bornBoth parents foreign-born 43 41.6% Native61 58.4% Foreign-bornOne native, one foreign-born parent 63 47.1% Native71 52.9% Foreign-bornChildren 6 to 17 years - Living with one parent Native parent 373 99.6% Native1 0.4% Foreign-bornForeign-born parent 401 60.5% Native262 39.5% Foreign-born
Grandparents responsible for own grandchildren in Upper Grand Lagoon
Grandparents (30 to 59 years) White / Caucasian 58 100.0% Responsible for grandchildrenWhite alone, not Hispanic / Latino 62 100.0% Responsible for grandchildrenGrandparents (60 years and over) White / Caucasian 44 73.2% Responsible for grandchildren16 26.8% Not responsible for grandchildrenWhite alone, not Hispanic / Latino 44 68.3% Responsible for grandchildren20 31.7% Not responsible for grandchildren