Races in Timberwood Park, Texas (TX) Detailed Stats
Data:
Races - White alone (%)
Races - White alone (% change since 2000)
Races - Black alone (%)
Races - Black alone (% change since 2000)
Races - American Indian alone (%)
Races - American Indian alone (% change since 2000)
Races - Asian alone (%)
Races - Asian alone (% change since 2000)
Races - Hispanic (%)
Races - Hispanic (% change since 2000)
Races - Native Hawaiian and Other Pacific Islander alone (%)
Races - Native Hawaiian and Other Pacific Islander alone (% change since 2000)
Races - Two or more races(%)
Races - Two or more races(% change since 2000)
Races - Other race alone (%)
Races - Other race alone (% change since 2000)
Racial diversity
Place of birth - Born in state of residence (%)
Place of birth - Born in state of residence (%) - White
Place of birth - Born in state of residence (%) - Black or African American
Place of birth - Born in state of residence (%) - Asian
Place of birth - Born in state of residence (%) - Hispanic or Latino
Place of birth - Born in state of residence (%) - American Indian and Alaska Native
Place of birth - Born in state of residence (%) - Multirace
Place of birth - Born in state of residence (%) - Other Race
Place of birth - Born in other state (%)
Place of birth - Born in other state (%) - White
Place of birth - Born in other state (%) - Black or African American
Place of birth - Born in other state (%) - Asian
Place of birth - Born in other state (%) - Hispanic or Latino
Place of birth - Born in other state (%) - American Indian and Alaska Native
Place of birth - Born in other state (%) - Multirace
Place of birth - Born in other state (%) - Other Race
Place of birth - Native, outside of US (%)
Place of birth - Native, outside of US (%) - White
Place of birth - Native, outside of US (%) - Black or African American
Place of birth - Native, outside of US (%) - Asian
Place of birth - Native, outside of US (%) - Hispanic or Latino
Place of birth - Native, outside of US (%) - American Indian and Alaska Native
Place of birth - Native, outside of US (%) - Multirace
Place of birth - Native, outside of US (%) - Other Race
Place of birth - Foreign born (%)
Place of birth - Foreign born (%) - White
Place of birth - Foreign born (%) - Black or African American
Place of birth - Foreign born (%) - Asian
Place of birth - Foreign born (%) - Hispanic or Latino
Place of birth - Foreign born (%) - American Indian and Alaska Native
Place of birth - Foreign born (%) - Multirace
Place of birth - Foreign born (%) - Other Race
Residents speaking English at home (%)
Residents speaking English at home - Born in the United States (%)
Residents speaking English at home - Native, born elsewhere (%)
Residents speaking English at home - Foreign born (%)
Residents speaking Spanish at home (%)
Residents speaking Spanish at home - Born in the United States (%)
Residents speaking Spanish at home - Native, born elsewhere (%)
Residents speaking Spanish at home - Foreign born (%)
Residents speaking other language at home (%)
Residents speaking other language at home - Born in the United States (%)
Residents speaking other language at home - Native, born elsewhere (%)
Residents speaking other language at home - Foreign born (%)
Marital status - Never married (%)
Marital status - Now married (%)
Marital status - Separated (%)
Marital status - Widowed (%)
Marital status - Divorced (%)
Ancestries Reported - Arab (%)
Ancestries Reported - Czech (%)
Ancestries Reported - Danish (%)
Ancestries Reported - Dutch (%)
Ancestries Reported - English (%)
Ancestries Reported - French (%)
Ancestries Reported - French Canadian (%)
Ancestries Reported - German (%)
Ancestries Reported - Greek (%)
Ancestries Reported - Hungarian (%)
Ancestries Reported - Irish (%)
Ancestries Reported - Italian (%)
Ancestries Reported - Lithuanian (%)
Ancestries Reported - Norwegian (%)
Ancestries Reported - Polish (%)
Ancestries Reported - Portuguese (%)
Ancestries Reported - Russian (%)
Ancestries Reported - Scotch-Irish (%)
Ancestries Reported - Scottish (%)
Ancestries Reported - Slovak (%)
Ancestries Reported - Subsaharan African (%)
Ancestries Reported - Swedish (%)
Ancestries Reported - Swiss (%)
Ancestries Reported - Ukrainian (%)
Ancestries Reported - United States (%)
Ancestries Reported - Welsh (%)
Ancestries Reported - West Indian (%)
Ancestries Reported - Other (%)
Geographical mobility - Same house 1 year ago (%)
Geographical mobility - Same house 1 year ago (%) - White
Geographical mobility - Same house 1 year ago (%) - Black or African American
Geographical mobility - Same house 1 year ago (%) - Asian
Geographical mobility - Same house 1 year ago (%) - Hispanic or Latino
Geographical mobility - Same house 1 year ago (%) - American Indian and Alaska Native
Geographical mobility - Same house 1 year ago (%) - Multirace
Geographical mobility - Same house 1 year ago (%) - Other Race
Geographical mobility - Moved within same county (%)
Geographical mobility - Moved within same county (%) - White
Geographical mobility - Moved within same county (%) - Black or African American
Geographical mobility - Moved within same county (%) - Asian
Geographical mobility - Moved within same county (%) - Hispanic or Latino
Geographical mobility - Moved within same county (%) - American Indian and Alaska Native
Geographical mobility - Moved within same county (%) - Multirace
Geographical mobility - Moved within same county (%) - Other Race
Geographical mobility - Moved from different county within same state (%)
Geographical mobility - Moved from different county within same state (%) - White
Geographical mobility - Moved from different county within same state (%) - Black or African American
Geographical mobility - Moved from different county within same state (%) - Asian
Geographical mobility - Moved from different county within same state (%) - Hispanic or Latino
Geographical mobility - Moved from different county within same state (%) - American Indian and Alaska Native
Geographical mobility - Moved from different county within same state (%) - Multirace
Geographical mobility - Moved from different county within same state (%) - Other Race
Geographical mobility - Moved from different state (%)
Geographical mobility - Moved from different state (%) - White
Geographical mobility - Moved from different state (%) - Black or African American
Geographical mobility - Moved from different state (%) - Asian
Geographical mobility - Moved from different state (%) - Hispanic or Latino
Geographical mobility - Moved from different state (%) - American Indian and Alaska Native
Geographical mobility - Moved from different state (%) - Multirace
Geographical mobility - Moved from different state (%) - Other Race
Geographical mobility - Moved from abroad (%)
Geographical mobility - Moved from abroad (%) - White
Geographical mobility - Moved from abroad (%) - Black or African American
Geographical mobility - Moved from abroad (%) - Asian
Geographical mobility - Moved from abroad (%) - Hispanic or Latino
Geographical mobility - Moved from abroad (%) - American Indian and Alaska Native
Geographical mobility - Moved from abroad (%) - Multirace
Geographical mobility - Moved from abroad (%) - Other Race
Place of birth for the foreign-born population - Ireland (%)
Place of birth for the foreign-born population - Denmark (%)
Place of birth for the foreign-born population - Norway (%)
Place of birth for the foreign-born population - Sweden (%)
Place of birth for the foreign-born population - United Kingdom (%)
Place of birth for the foreign-born population - England (%)
Place of birth for the foreign-born population - Scotland (%)
Place of birth for the foreign-born population - Other Northern Europe (%)
Place of birth for the foreign-born population - Austria (%)
Place of birth for the foreign-born population - Belgium (%)
Place of birth for the foreign-born population - France (%)
Place of birth for the foreign-born population - Germany (%)
Place of birth for the foreign-born population - Netherlands (%)
Place of birth for the foreign-born population - Switzerland (%)
Place of birth for the foreign-born population - Other Western Europe (%)
Place of birth for the foreign-born population - Greece (%)
Place of birth for the foreign-born population - Italy (%)
Place of birth for the foreign-born population - Portugal (%)
Place of birth for the foreign-born population - Spain (%)
Place of birth for the foreign-born population - Other Southern Europe (%)
Place of birth for the foreign-born population - Albania (%)
Place of birth for the foreign-born population - Belarus (%)
Place of birth for the foreign-born population - Bosnia and Herzegovina (%)
Place of birth for the foreign-born population - Bulgaria (%)
Place of birth for the foreign-born population - Croatia (%)
Place of birth for the foreign-born population - Czechoslovakia (%)
Place of birth for the foreign-born population - Hungary (%)
Place of birth for the foreign-born population - Latvia (%)
Place of birth for the foreign-born population - Lithuania (%)
Place of birth for the foreign-born population - North Macedonia (Macedonia) (%)
Place of birth for the foreign-born population - Moldova (%)
Place of birth for the foreign-born population - Poland (%)
Place of birth for the foreign-born population - Romania (%)
Place of birth for the foreign-born population - Russia (%)
Place of birth for the foreign-born population - Serbia (%)
Place of birth for the foreign-born population - Ukraine (%)
Place of birth for the foreign-born population - Other Eastern Europe (%)
Place of birth for the foreign-born population - China (%)
Place of birth for the foreign-born population - Hong Kong (%)
Place of birth for the foreign-born population - Taiwan (%)
Place of birth for the foreign-born population - Japan (%)
Place of birth for the foreign-born population - Korea (%)
Place of birth for the foreign-born population - Other Eastern Asia (%)
Place of birth for the foreign-born population - Afghanistan (%)
Place of birth for the foreign-born population - Bangladesh (%)
Place of birth for the foreign-born population - India (%)
Place of birth for the foreign-born population - Iran (%)
Place of birth for the foreign-born population - Kazakhstan (%)
Place of birth for the foreign-born population - Nepal (%)
Place of birth for the foreign-born population - Pakistan (%)
Place of birth for the foreign-born population - Sri Lanka (%)
Place of birth for the foreign-born population - Uzbekistan (%)
Place of birth for the foreign-born population - Other South Central Asia (%)
Place of birth for the foreign-born population - Burma (%)
Place of birth for the foreign-born population - Cambodia (%)
Place of birth for the foreign-born population - Indonesia (%)
Place of birth for the foreign-born population - Laos (%)
Place of birth for the foreign-born population - Malaysia (%)
Place of birth for the foreign-born population - Philippines (%)
Place of birth for the foreign-born population - Singapore (%)
Place of birth for the foreign-born population - Thailand (%)
Place of birth for the foreign-born population - Vietnam (%)
Place of birth for the foreign-born population - Other South Eastern Asia (%)
Place of birth for the foreign-born population - Armenia (%)
Place of birth for the foreign-born population - Iraq (%)
Place of birth for the foreign-born population - Israel (%)
Place of birth for the foreign-born population - Jordan (%)
Place of birth for the foreign-born population - Kuwait (%)
Place of birth for the foreign-born population - Lebanon (%)
Place of birth for the foreign-born population - Saudi Arabia (%)
Place of birth for the foreign-born population - Syria (%)
Place of birth for the foreign-born population - Turkey (%)
Place of birth for the foreign-born population - Yemen (%)
Place of birth for the foreign-born population - Other Western Asia (%)
Place of birth for the foreign-born population - Eritrea (%)
Place of birth for the foreign-born population - Ethiopia (%)
Place of birth for the foreign-born population - Kenya (%)
Place of birth for the foreign-born population - Somalia (%)
Place of birth for the foreign-born population - Uganda (%)
Place of birth for the foreign-born population - Zimbabwe (%)
Place of birth for the foreign-born population - Other Eastern Africa (%)
Place of birth for the foreign-born population - Cameroon (%)
Place of birth for the foreign-born population - Congo (%)
Place of birth for the foreign-born population - Democratic Republic of Congo (Zaire) (%)
Place of birth for the foreign-born population - Other Middle Africa (%)
Place of birth for the foreign-born population - Egypt (%)
Place of birth for the foreign-born population - Morocco (%)
Place of birth for the foreign-born population - Sudan (%)
Place of birth for the foreign-born population - Other Northern Africa (%)
Place of birth for the foreign-born population - South Africa (%)
Place of birth for the foreign-born population - Other Southern Africa (%)
Place of birth for the foreign-born population - Cabo Verde (%)
Place of birth for the foreign-born population - Ghana (%)
Place of birth for the foreign-born population - Liberia (%)
Place of birth for the foreign-born population - Nigeria (%)
Place of birth for the foreign-born population - Senegal (%)
Place of birth for the foreign-born population - Sierra Leone (%)
Place of birth for the foreign-born population - Other Western Africa (%)
Place of birth for the foreign-born population - Australia (%)
Place of birth for the foreign-born population - New Zealand (%)
Place of birth for the foreign-born population - Fiji (%)
Place of birth for the foreign-born population - Micronesia (%)
Place of birth for the foreign-born population - Bahamas (%)
Place of birth for the foreign-born population - Barbados (%)
Place of birth for the foreign-born population - Cuba (%)
Place of birth for the foreign-born population - Dominica (%)
Place of birth for the foreign-born population - Dominican Republic (%)
Place of birth for the foreign-born population - Grenada (%)
Place of birth for the foreign-born population - Haiti (%)
Place of birth for the foreign-born population - Jamaica (%)
Place of birth for the foreign-born population - St. Vincent and the Grenadines (%)
Place of birth for the foreign-born population - Trinidad and Tobago (%)
Place of birth for the foreign-born population - West Indies (%)
Place of birth for the foreign-born population - Other Caribbean (%)
Place of birth for the foreign-born population - Belize (%)
Place of birth for the foreign-born population - Costa Rica (%)
Place of birth for the foreign-born population - El Salvador (%)
Place of birth for the foreign-born population - Guatemala (%)
Place of birth for the foreign-born population - Honduras (%)
Place of birth for the foreign-born population - Mexico (%)
Place of birth for the foreign-born population - Nicaragua (%)
Place of birth for the foreign-born population - Panama (%)
Place of birth for the foreign-born population - Other Central America (%)
Place of birth for the foreign-born population - Argentina (%)
Place of birth for the foreign-born population - Bolivia (%)
Place of birth for the foreign-born population - Brazil (%)
Place of birth for the foreign-born population - Chile (%)
Place of birth for the foreign-born population - Colombia (%)
Place of birth for the foreign-born population - Ecuador (%)
Place of birth for the foreign-born population - Guyana (%)
Place of birth for the foreign-born population - Peru (%)
Place of birth for the foreign-born population - Uruguay (%)
Place of birth for the foreign-born population - Venezuela (%)
Place of birth for the foreign-born population - Other South America (%)
Place of birth for the foreign-born population - Canada (%)
Place of birth for the foreign-born population - Other Northern America (%)
Place of birth for the foreign-born population - Other (%)
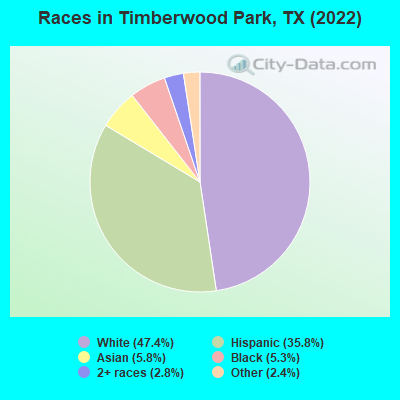
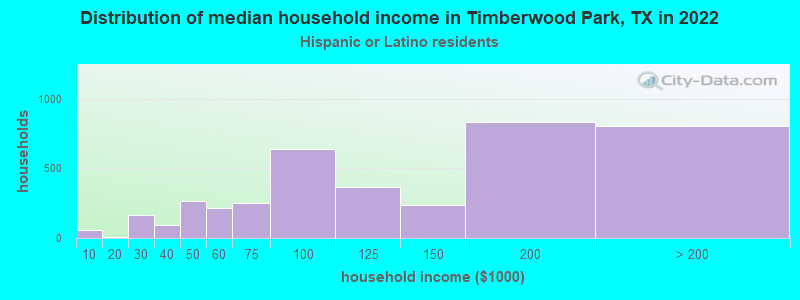
According to 2022 data, the most numerous races in Timberwood Park, TX are Hispanic (12,536 residents), White alone (16,611 residents), and Black alone (1,857 residents). 75.5% of Timberwood Park residents speak English at home. 14.8% of Timberwood Park, TX residents are foreign-born (6.4% born in Asia, 6.3% born in Latin America), which is 15.2% less than the foreign-born rate of 17.0% across the entire state of Texas.
Race distribution in Timberwood Park
2000 2022
10,933,313 52.4% White alone 6,669,666 32.0% Hispanic 2,364,255 11.3% Black alone 554,445 2.7% Asian alone 230,567 1.1% Two or more races 68,859 0.3% American Indian alone 19,958 0.10% Other race alone 10,757 0.05% Native Hawaiian and Other
12,070,642 40.2% Hispanic 11,683,430 38.9% White alone 3,508,706 11.7% Black alone 1,608,173 5.4% Asian alone 956,560 3.2% Two or more races 125,763 0.4% Other race alone 47,023 0.2% American Indian alone 29,275 0.10% Native Hawaiian and Other
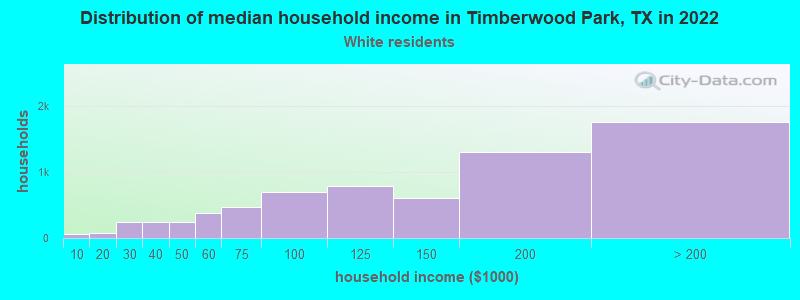
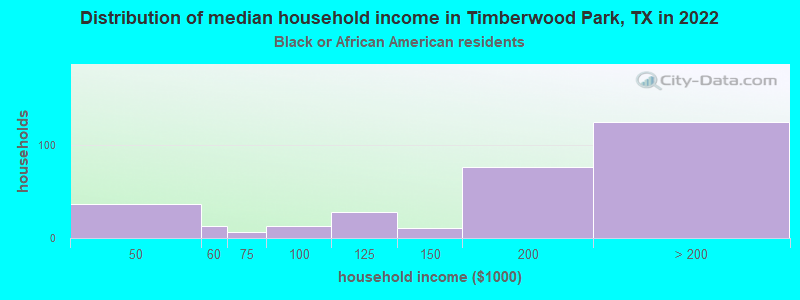
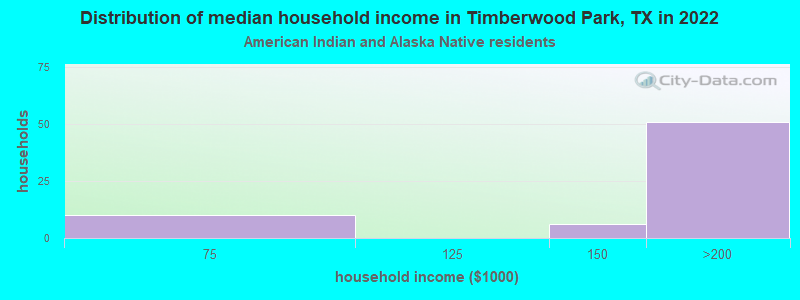
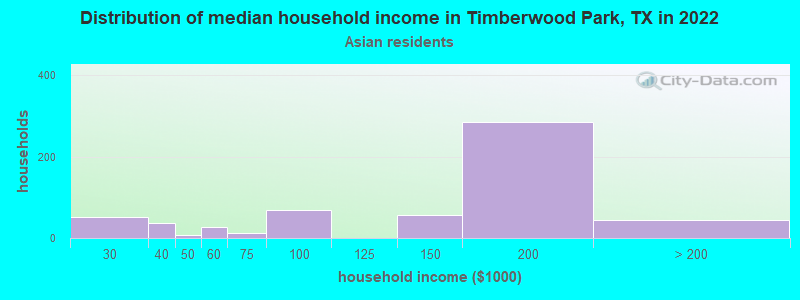
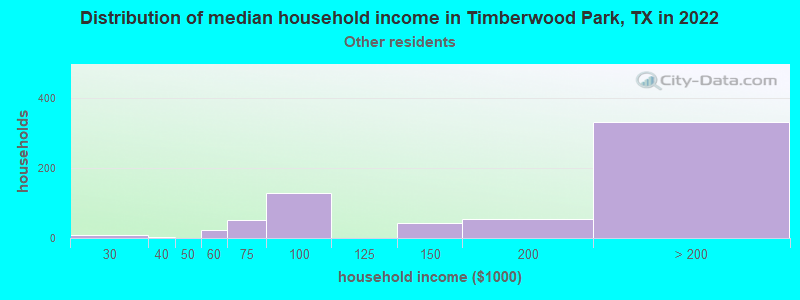
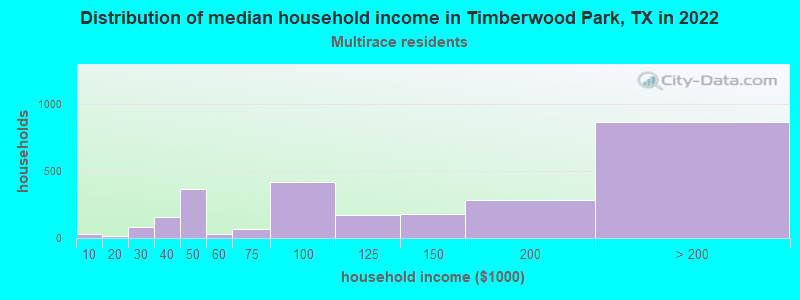
Income and house value in Timberwood Park Median household income in 2022 $137,510 White non-Hispanic householders$153,446 Black householders$176,074 American Indian and Alaska Native householders$182,109 Asian householders$168,925 Some other race householders$122,640 Two or more races householders$115,118 Hispanic or Latino race householdersMedian 2022 house value $513,668 White Non-Hispanic householders$740,111 Black or African American householders$469,262 Native Hawaiian and other Pacific Islander householders$383,913 Some other race householders$715,545 Two or more races householders$507,369 Hispanic or Latino householders
Median age by race in Timberwood Park
41.5 Median age for White residents40.9 42.3 40.4 Median age for Black or African American residents47.7 14.3 39.6 Median age for American Indian / Alaska Native residents37.3 40.2 37.8 Median age for Asian residents36.5 39.7 -674,441,204.4 Median age for Native Hawaiian / Pacific Islander residents-596,986,816.7 -748,387,096.0 53.4 Median age for Other race residents51.6 53.8 28.3 Median age for Two or more races residents38.3 24.6 42.0 Median age for White alone residents41.7 42.0 31.2 Median age for Hispanic or Latino residents33.3 28.3
Owner/renter occupied households by race in Timberwood Park
House owners and renters - White residents 6,009 89.0% Owner occupied739 11.0% Renter occupiedHouse owners and renters - Black or African American residents 297 84.5% Owner occupied54 15.5% Renter occupiedHouse owners and renters - American Indian / Alaska Native residents 49 100.0% Owner occupiedHouse owners and renters - Asian residents 533 89.5% Owner occupied62 10.5% Renter occupiedHouse owners and renters - Other race residents 425 67.9% Owner occupied201 32.1% Renter occupiedHouse owners and renters - Two or more races residents 2,136 78.6% Owner occupied580 21.4% Renter occupiedHouse owners and renters - White alone residents 5,475 88.9% Owner occupied685 11.1% Renter occupiedHouse owners and renters - Hispanic or Latino residents 3,164 80.7% Owner occupied758 19.3% Renter occupied
Language usage in Timberwood Park
English speakers - Total 75.5% of residents of Timberwood Park speak English at home.
17.9% of residents speak Spanish at home 4,464 75.2% Speak English very well1,472 24.8% Speak English less than very well7.2% of residents speak other language at home 1,470 61.3% Speak English very well929 38.7% Speak English less than very well
English speakers - Born in the United States 93.1% of residents of Timberwood Park speak English at home.
6.8% of residents speak Spanish at home 741 90.5% Speak English very well78 9.5% Speak English less than very well0.8% of residents speak other language at home 67 69.1% Speak English very well30 30.9% Speak English less than very well
English speakers - Native, born elsewhere 53.8% of residents of Timberwood Park speak English at home.
21.9% of residents speak Spanish at home 120 71.4% Speak English very well48 28.6% Speak English less than very well35.9% of residents speak other language at home 275 100.0% Speak English very well
English speakers - Foreign-born 19.9% of residents of Timberwood Park speak English at home.
43.1% of residents speak Spanish at home 1,117 51.6% Speak English very well1,048 48.4% Speak English less than very well38.7% of residents speak other language at home 1,052 54.1% Speak English very well893 45.9% Speak English less than very well
White (Caucasian) - Speak only English Native:
98.3% (15,522)Foreign-born:
36.4% (237)
White (Caucasian) - Speak another language Native:
8.0% (1,260)Foreign-born:
71.3% (464)
Black or African American - Speak only English Native:
100.0% (1,946)Foreign-born:
88.2% (25)
American Indian / Alaska Native - Speak another language Native:
64.2% (61)Foreign-born:
93.0% (5)
Asian - Speak only English Native:
97.2% (311)Foreign-born:
29.0% (490)
Asian - Speak another language Native:
9.8% (31)Foreign-born:
72.3% (1,221)
Other race - Speak only English Native:
62.0% (666)Foreign-born:
23.0% (196)
Other race - Speak another language Native:
37.2% (399)Foreign-born:
73.6% (627)
Two or more races - Speak only English Native:
62.6% (4,024)Foreign-born:
2.8% (59)
Two or more races - Speak another language Native:
36.8% (2,366)Foreign-born:
97.4% (2,024)
White alone - Speak only English Native:
96.2% (14,579)Foreign-born:
41.8% (256)
White alone - Speak another language Native:
3.9% (591)Foreign-born:
58.0% (355)
Hispanic or Latino - Speak only English Native:
62.9% (5,902)Foreign-born:
1.7% (36)
Hispanic or Latino - Speak another language Native:
37.5% (3,523)Foreign-born:
98.1% (2,124)
Foreign-born residents in Timberwood Park 5,168 residents are foreign born (6.4% Asia , 6.3% Latin America ).
This city:
14.8%Texas:
17.1%
Marital status for residents in Timberwood Park Marital status - White (Caucasian) population 15 years and over
Males 25.5% Never married67.5% Now married1.6% Separated1.7% Widowed3.7% DivorcedFemales 18.8% Never married69.0% Now married0.8% Separated4.7% Widowed6.6% DivorcedWomen who gave birth in the past 12 months Now married:
94.6% (114)Unmarried:
5.4% (6)
Women who did not give birth in the past 12 months Now married:
67.9% (2,424)Unmarried:
32.1% (1,147)
Marital status - Black or African American population 15 years and over
Males 30.9% Never married68.7% Now married0.0% Separated0.0% Widowed0.4% DivorcedFemales 23.5% Never married68.7% Now married0.0% Separated7.8% Widowed0.0% DivorcedWomen who did not give birth in the past 12 months Now married:
40.9% (59)Unmarried:
59.1% (86)
Marital status - American Indian / Alaska Native population 15 years and over
Males 0.0% Never married100.0% Now married0.0% Separated0.0% Widowed0.0% DivorcedFemales 0.0% Never married100.0% Now married0.0% Separated0.0% Widowed0.0% DivorcedWomen who did not give birth in the past 12 months Now married:
100.0% (16)Unmarried:
0.0% (0)
Marital status - Asian population 15 years and over
Males 12.4% Never married83.7% Now married0.0% Separated0.0% Widowed3.8% DivorcedFemales 21.8% Never married64.0% Now married0.0% Separated9.1% Widowed5.1% DivorcedWomen who did not give birth in the past 12 months Now married:
57.9% (286)Unmarried:
42.1% (208)
Marital status - Native Hawaiian / Pacific Islander population 15 years and over
Males 0.0% Never married100.0% Now married0.0% Separated0.0% Widowed0.0% DivorcedFemales 0.0% Never married0.0% Now married0.0% Separated0.0% Widowed100.0% DivorcedMarital status - Other race population 15 years and over
Males 22.7% Never married40.1% Now married0.0% Separated23.8% Widowed13.5% DivorcedFemales 17.3% Never married69.5% Now married0.0% Separated8.8% Widowed4.4% DivorcedWomen who did not give birth in the past 12 months Now married:
49.1% (117)Unmarried:
50.9% (121)
Marital status - Two or more races population 15 years and over
Males 28.5% Never married66.8% Now married1.0% Separated3.2% Widowed0.5% DivorcedFemales 48.4% Never married40.8% Now married0.0% Separated1.0% Widowed9.8% DivorcedWomen who gave birth in the past 12 months Now married:
65.5% (30)Unmarried:
34.5% (16)
Women who did not give birth in the past 12 months Now married:
40.1% (1,287)Unmarried:
59.9% (1,919)
Marital status - White alone, not Hispanic / Latino population 15 years and over
Males 21.8% Never married72.0% Now married0.8% Separated2.4% Widowed3.1% DivorcedFemales 15.2% Never married70.6% Now married0.8% Separated5.6% Widowed7.7% DivorcedWomen who gave birth in the past 12 months Now married:
86.8% (58)Unmarried:
13.2% (9)
Women who did not give birth in the past 12 months Now married:
70.9% (2,260)Unmarried:
29.1% (929)
Marital status - Hispanic or Latino population 15 years and over
Males 33.7% Never married57.2% Now married2.1% Separated1.3% Widowed5.7% DivorcedFemales 40.2% Never married51.8% Now married0.4% Separated2.4% Widowed5.2% DivorcedWomen who gave birth in the past 12 months Now married:
92.2% (122)Unmarried:
7.8% (10)
Women who did not give birth in the past 12 months Now married:
48.3% (1,878)Unmarried:
51.7% (2,009)
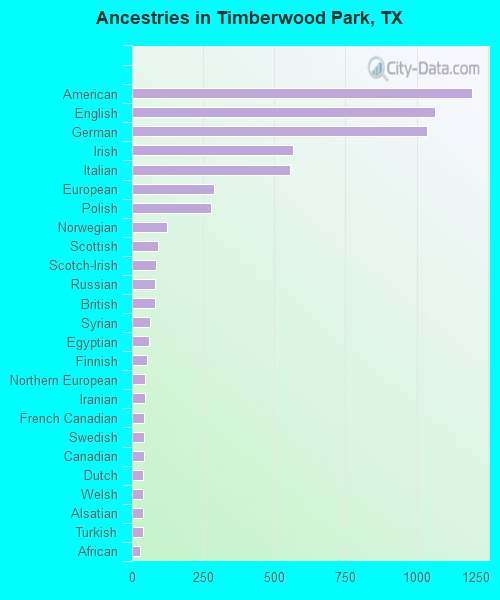
Ancestries in Timberwood Park
1,195 6.6% American1,066 5.9% English1,036 5.7% German566 3.1% Irish556 3.1% Italian287 1.6% European276 1.5% Polish122 0.7% Norwegian92 0.5% Scottish85 0.5% Scotch-Irish82 0.5% Russian81 0.4% British63 0.3% Syrian58 0.3% Egyptian51 0.3% Finnish46 0.3% Northern European45 0.2% Iranian43 0.2% French Canadian43 0.2% Swedish41 0.2% Canadian38 0.2% Dutch38 0.2% Welsh37 0.2% Alsatian37 0.2% Turkish29 0.2% African23 0.1% Czech23 0.1% Greek20 0.1% Danish19 0.1% French12 0.07% Yugoslavian10 0.06% Scandinavian6 0.03% Croatian
Geographical mobility in Timberwood Park Same house 1 year ago 14,857 87.6% White (Caucasian)1,725 86.4% Black or African American75 80.2% American Indian / Alaska Native1,868 90.3% Asian29 98.2% Native Hawaiian / Pacific Islander1,615 83.9% Other race7,635 81.8% Two or more races14,429 87.4% White alone, not Hispanic / Latino10,766 86.7% Hispanic or LatinoMoved within same county 950 5.6% White / Caucasian150 7.5% Black or African American17 17.8% American Indian / Alaska Native141 6.8% Asian117 6.1% Other race1,072 11.5% Two or more races1,009 6.1% White alone, not Hispanic / Latino865 7.0% Hispanic or LatinoMoved within same state 191 1.1% White / Caucasian15 0.7% Black or African American68 3.3% Asian13 0.7% Other race204 2.2% Two or more races133 0.8% White alone, not Hispanic / Latino267 2.2% Hispanic or LatinoMoved from different state 975 5.7% White / Caucasian95 4.8% Black or African American184 9.5% Other race359 3.8% Two or more races891 5.4% White alone, not Hispanic / Latino421 3.4% Hispanic or LatinoMoved from abroad 69 0.4% White37 1.8% Asian42 2.2% Other race40 0.2% White alone, not Hispanic / Latino97 0.8% Hispanic or Latino
Children Nativity (place of birth) in Timberwood Park
Children under 6 years - Living with two parents Both parents native 1,813 100.0% NativeBoth parents foreign-born 318 96.5% Native12 3.5% Foreign-bornOne native, one foreign-born parent 100 100.0% NativeChildren under 6 years - Living with one parent Native parent 320 100.0% NativeForeign-born parent 78 100.0% NativeChildren 6 to 17 years - Living with two parents Both parents native 4,409 99.0% Native46 1.0% Foreign-bornBoth parents foreign-born 712 77.6% Native206 22.4% Foreign-bornOne native, one foreign-born parent 447 100.0% NativeChildren 6 to 17 years - Living with one parent Native parent 547 100.0% NativeForeign-born parent 73 59.0% Native51 41.0% Foreign-born
Grandparents responsible for own grandchildren in Timberwood Park
Grandparents (30 to 59 years) White / Caucasian 18 45.6% Responsible for grandchildren22 54.4% Not responsible for grandchildrenAsian 112 100.0% Not responsible for grandchildrenTwo or more races 18 11.5% Responsible for grandchildren136 88.5% Not responsible for grandchildrenWhite alone, not Hispanic / Latino 23 62.2% Responsible for grandchildren14 37.8% Not responsible for grandchildrenHispanic or Latino 11 10.9% Responsible for grandchildren88 89.1% Not responsible for grandchildrenGrandparents (60 years and over) White / Caucasian 45 14.8% Responsible for grandchildren260 85.2% Not responsible for grandchildrenAsian 259 100.0% Not responsible for grandchildrenTwo or more races 322 100.0% Not responsible for grandchildrenWhite alone, not Hispanic / Latino 34 10.0% Responsible for grandchildren310 90.0% Not responsible for grandchildrenHispanic or Latino 26 7.4% Responsible for grandchildren324 92.6% Not responsible for grandchildren