Races in Sulphur Springs, Texas (TX) Detailed Stats
Data:
Races - White alone (%)
Races - White alone (% change since 2000)
Races - Black alone (%)
Races - Black alone (% change since 2000)
Races - American Indian alone (%)
Races - American Indian alone (% change since 2000)
Races - Asian alone (%)
Races - Asian alone (% change since 2000)
Races - Hispanic (%)
Races - Hispanic (% change since 2000)
Races - Native Hawaiian and Other Pacific Islander alone (%)
Races - Native Hawaiian and Other Pacific Islander alone (% change since 2000)
Races - Two or more races(%)
Races - Two or more races(% change since 2000)
Races - Other race alone (%)
Races - Other race alone (% change since 2000)
Racial diversity
Place of birth - Born in state of residence (%)
Place of birth - Born in state of residence (%) - White
Place of birth - Born in state of residence (%) - Black or African American
Place of birth - Born in state of residence (%) - Asian
Place of birth - Born in state of residence (%) - Hispanic or Latino
Place of birth - Born in state of residence (%) - American Indian and Alaska Native
Place of birth - Born in state of residence (%) - Multirace
Place of birth - Born in state of residence (%) - Other Race
Place of birth - Born in other state (%)
Place of birth - Born in other state (%) - White
Place of birth - Born in other state (%) - Black or African American
Place of birth - Born in other state (%) - Asian
Place of birth - Born in other state (%) - Hispanic or Latino
Place of birth - Born in other state (%) - American Indian and Alaska Native
Place of birth - Born in other state (%) - Multirace
Place of birth - Born in other state (%) - Other Race
Place of birth - Native, outside of US (%)
Place of birth - Native, outside of US (%) - White
Place of birth - Native, outside of US (%) - Black or African American
Place of birth - Native, outside of US (%) - Asian
Place of birth - Native, outside of US (%) - Hispanic or Latino
Place of birth - Native, outside of US (%) - American Indian and Alaska Native
Place of birth - Native, outside of US (%) - Multirace
Place of birth - Native, outside of US (%) - Other Race
Place of birth - Foreign born (%)
Place of birth - Foreign born (%) - White
Place of birth - Foreign born (%) - Black or African American
Place of birth - Foreign born (%) - Asian
Place of birth - Foreign born (%) - Hispanic or Latino
Place of birth - Foreign born (%) - American Indian and Alaska Native
Place of birth - Foreign born (%) - Multirace
Place of birth - Foreign born (%) - Other Race
Residents speaking English at home (%)
Residents speaking English at home - Born in the United States (%)
Residents speaking English at home - Native, born elsewhere (%)
Residents speaking English at home - Foreign born (%)
Residents speaking Spanish at home (%)
Residents speaking Spanish at home - Born in the United States (%)
Residents speaking Spanish at home - Native, born elsewhere (%)
Residents speaking Spanish at home - Foreign born (%)
Residents speaking other language at home (%)
Residents speaking other language at home - Born in the United States (%)
Residents speaking other language at home - Native, born elsewhere (%)
Residents speaking other language at home - Foreign born (%)
Marital status - Never married (%)
Marital status - Now married (%)
Marital status - Separated (%)
Marital status - Widowed (%)
Marital status - Divorced (%)
Ancestries Reported - Arab (%)
Ancestries Reported - Czech (%)
Ancestries Reported - Danish (%)
Ancestries Reported - Dutch (%)
Ancestries Reported - English (%)
Ancestries Reported - French (%)
Ancestries Reported - French Canadian (%)
Ancestries Reported - German (%)
Ancestries Reported - Greek (%)
Ancestries Reported - Hungarian (%)
Ancestries Reported - Irish (%)
Ancestries Reported - Italian (%)
Ancestries Reported - Lithuanian (%)
Ancestries Reported - Norwegian (%)
Ancestries Reported - Polish (%)
Ancestries Reported - Portuguese (%)
Ancestries Reported - Russian (%)
Ancestries Reported - Scotch-Irish (%)
Ancestries Reported - Scottish (%)
Ancestries Reported - Slovak (%)
Ancestries Reported - Subsaharan African (%)
Ancestries Reported - Swedish (%)
Ancestries Reported - Swiss (%)
Ancestries Reported - Ukrainian (%)
Ancestries Reported - United States (%)
Ancestries Reported - Welsh (%)
Ancestries Reported - West Indian (%)
Ancestries Reported - Other (%)
Geographical mobility - Same house 1 year ago (%)
Geographical mobility - Same house 1 year ago (%) - White
Geographical mobility - Same house 1 year ago (%) - Black or African American
Geographical mobility - Same house 1 year ago (%) - Asian
Geographical mobility - Same house 1 year ago (%) - Hispanic or Latino
Geographical mobility - Same house 1 year ago (%) - American Indian and Alaska Native
Geographical mobility - Same house 1 year ago (%) - Multirace
Geographical mobility - Same house 1 year ago (%) - Other Race
Geographical mobility - Moved within same county (%)
Geographical mobility - Moved within same county (%) - White
Geographical mobility - Moved within same county (%) - Black or African American
Geographical mobility - Moved within same county (%) - Asian
Geographical mobility - Moved within same county (%) - Hispanic or Latino
Geographical mobility - Moved within same county (%) - American Indian and Alaska Native
Geographical mobility - Moved within same county (%) - Multirace
Geographical mobility - Moved within same county (%) - Other Race
Geographical mobility - Moved from different county within same state (%)
Geographical mobility - Moved from different county within same state (%) - White
Geographical mobility - Moved from different county within same state (%) - Black or African American
Geographical mobility - Moved from different county within same state (%) - Asian
Geographical mobility - Moved from different county within same state (%) - Hispanic or Latino
Geographical mobility - Moved from different county within same state (%) - American Indian and Alaska Native
Geographical mobility - Moved from different county within same state (%) - Multirace
Geographical mobility - Moved from different county within same state (%) - Other Race
Geographical mobility - Moved from different state (%)
Geographical mobility - Moved from different state (%) - White
Geographical mobility - Moved from different state (%) - Black or African American
Geographical mobility - Moved from different state (%) - Asian
Geographical mobility - Moved from different state (%) - Hispanic or Latino
Geographical mobility - Moved from different state (%) - American Indian and Alaska Native
Geographical mobility - Moved from different state (%) - Multirace
Geographical mobility - Moved from different state (%) - Other Race
Geographical mobility - Moved from abroad (%)
Geographical mobility - Moved from abroad (%) - White
Geographical mobility - Moved from abroad (%) - Black or African American
Geographical mobility - Moved from abroad (%) - Asian
Geographical mobility - Moved from abroad (%) - Hispanic or Latino
Geographical mobility - Moved from abroad (%) - American Indian and Alaska Native
Geographical mobility - Moved from abroad (%) - Multirace
Geographical mobility - Moved from abroad (%) - Other Race
Place of birth for the foreign-born population - Ireland (%)
Place of birth for the foreign-born population - Denmark (%)
Place of birth for the foreign-born population - Norway (%)
Place of birth for the foreign-born population - Sweden (%)
Place of birth for the foreign-born population - United Kingdom (%)
Place of birth for the foreign-born population - England (%)
Place of birth for the foreign-born population - Scotland (%)
Place of birth for the foreign-born population - Other Northern Europe (%)
Place of birth for the foreign-born population - Austria (%)
Place of birth for the foreign-born population - Belgium (%)
Place of birth for the foreign-born population - France (%)
Place of birth for the foreign-born population - Germany (%)
Place of birth for the foreign-born population - Netherlands (%)
Place of birth for the foreign-born population - Switzerland (%)
Place of birth for the foreign-born population - Other Western Europe (%)
Place of birth for the foreign-born population - Greece (%)
Place of birth for the foreign-born population - Italy (%)
Place of birth for the foreign-born population - Portugal (%)
Place of birth for the foreign-born population - Spain (%)
Place of birth for the foreign-born population - Other Southern Europe (%)
Place of birth for the foreign-born population - Albania (%)
Place of birth for the foreign-born population - Belarus (%)
Place of birth for the foreign-born population - Bosnia and Herzegovina (%)
Place of birth for the foreign-born population - Bulgaria (%)
Place of birth for the foreign-born population - Croatia (%)
Place of birth for the foreign-born population - Czechoslovakia (%)
Place of birth for the foreign-born population - Hungary (%)
Place of birth for the foreign-born population - Latvia (%)
Place of birth for the foreign-born population - Lithuania (%)
Place of birth for the foreign-born population - North Macedonia (Macedonia) (%)
Place of birth for the foreign-born population - Moldova (%)
Place of birth for the foreign-born population - Poland (%)
Place of birth for the foreign-born population - Romania (%)
Place of birth for the foreign-born population - Russia (%)
Place of birth for the foreign-born population - Serbia (%)
Place of birth for the foreign-born population - Ukraine (%)
Place of birth for the foreign-born population - Other Eastern Europe (%)
Place of birth for the foreign-born population - China (%)
Place of birth for the foreign-born population - Hong Kong (%)
Place of birth for the foreign-born population - Taiwan (%)
Place of birth for the foreign-born population - Japan (%)
Place of birth for the foreign-born population - Korea (%)
Place of birth for the foreign-born population - Other Eastern Asia (%)
Place of birth for the foreign-born population - Afghanistan (%)
Place of birth for the foreign-born population - Bangladesh (%)
Place of birth for the foreign-born population - India (%)
Place of birth for the foreign-born population - Iran (%)
Place of birth for the foreign-born population - Kazakhstan (%)
Place of birth for the foreign-born population - Nepal (%)
Place of birth for the foreign-born population - Pakistan (%)
Place of birth for the foreign-born population - Sri Lanka (%)
Place of birth for the foreign-born population - Uzbekistan (%)
Place of birth for the foreign-born population - Other South Central Asia (%)
Place of birth for the foreign-born population - Burma (%)
Place of birth for the foreign-born population - Cambodia (%)
Place of birth for the foreign-born population - Indonesia (%)
Place of birth for the foreign-born population - Laos (%)
Place of birth for the foreign-born population - Malaysia (%)
Place of birth for the foreign-born population - Philippines (%)
Place of birth for the foreign-born population - Singapore (%)
Place of birth for the foreign-born population - Thailand (%)
Place of birth for the foreign-born population - Vietnam (%)
Place of birth for the foreign-born population - Other South Eastern Asia (%)
Place of birth for the foreign-born population - Armenia (%)
Place of birth for the foreign-born population - Iraq (%)
Place of birth for the foreign-born population - Israel (%)
Place of birth for the foreign-born population - Jordan (%)
Place of birth for the foreign-born population - Kuwait (%)
Place of birth for the foreign-born population - Lebanon (%)
Place of birth for the foreign-born population - Saudi Arabia (%)
Place of birth for the foreign-born population - Syria (%)
Place of birth for the foreign-born population - Turkey (%)
Place of birth for the foreign-born population - Yemen (%)
Place of birth for the foreign-born population - Other Western Asia (%)
Place of birth for the foreign-born population - Eritrea (%)
Place of birth for the foreign-born population - Ethiopia (%)
Place of birth for the foreign-born population - Kenya (%)
Place of birth for the foreign-born population - Somalia (%)
Place of birth for the foreign-born population - Uganda (%)
Place of birth for the foreign-born population - Zimbabwe (%)
Place of birth for the foreign-born population - Other Eastern Africa (%)
Place of birth for the foreign-born population - Cameroon (%)
Place of birth for the foreign-born population - Congo (%)
Place of birth for the foreign-born population - Democratic Republic of Congo (Zaire) (%)
Place of birth for the foreign-born population - Other Middle Africa (%)
Place of birth for the foreign-born population - Egypt (%)
Place of birth for the foreign-born population - Morocco (%)
Place of birth for the foreign-born population - Sudan (%)
Place of birth for the foreign-born population - Other Northern Africa (%)
Place of birth for the foreign-born population - South Africa (%)
Place of birth for the foreign-born population - Other Southern Africa (%)
Place of birth for the foreign-born population - Cabo Verde (%)
Place of birth for the foreign-born population - Ghana (%)
Place of birth for the foreign-born population - Liberia (%)
Place of birth for the foreign-born population - Nigeria (%)
Place of birth for the foreign-born population - Senegal (%)
Place of birth for the foreign-born population - Sierra Leone (%)
Place of birth for the foreign-born population - Other Western Africa (%)
Place of birth for the foreign-born population - Australia (%)
Place of birth for the foreign-born population - New Zealand (%)
Place of birth for the foreign-born population - Fiji (%)
Place of birth for the foreign-born population - Micronesia (%)
Place of birth for the foreign-born population - Bahamas (%)
Place of birth for the foreign-born population - Barbados (%)
Place of birth for the foreign-born population - Cuba (%)
Place of birth for the foreign-born population - Dominica (%)
Place of birth for the foreign-born population - Dominican Republic (%)
Place of birth for the foreign-born population - Grenada (%)
Place of birth for the foreign-born population - Haiti (%)
Place of birth for the foreign-born population - Jamaica (%)
Place of birth for the foreign-born population - St. Vincent and the Grenadines (%)
Place of birth for the foreign-born population - Trinidad and Tobago (%)
Place of birth for the foreign-born population - West Indies (%)
Place of birth for the foreign-born population - Other Caribbean (%)
Place of birth for the foreign-born population - Belize (%)
Place of birth for the foreign-born population - Costa Rica (%)
Place of birth for the foreign-born population - El Salvador (%)
Place of birth for the foreign-born population - Guatemala (%)
Place of birth for the foreign-born population - Honduras (%)
Place of birth for the foreign-born population - Mexico (%)
Place of birth for the foreign-born population - Nicaragua (%)
Place of birth for the foreign-born population - Panama (%)
Place of birth for the foreign-born population - Other Central America (%)
Place of birth for the foreign-born population - Argentina (%)
Place of birth for the foreign-born population - Bolivia (%)
Place of birth for the foreign-born population - Brazil (%)
Place of birth for the foreign-born population - Chile (%)
Place of birth for the foreign-born population - Colombia (%)
Place of birth for the foreign-born population - Ecuador (%)
Place of birth for the foreign-born population - Guyana (%)
Place of birth for the foreign-born population - Peru (%)
Place of birth for the foreign-born population - Uruguay (%)
Place of birth for the foreign-born population - Venezuela (%)
Place of birth for the foreign-born population - Other South America (%)
Place of birth for the foreign-born population - Canada (%)
Place of birth for the foreign-born population - Other Northern America (%)
Place of birth for the foreign-born population - Other (%)
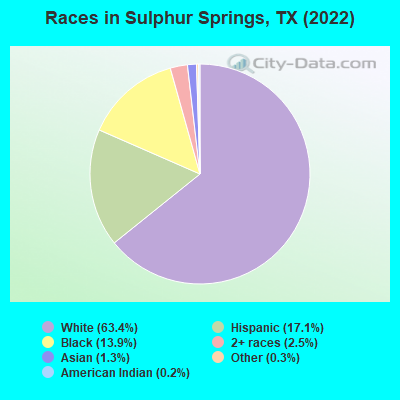
According to 2022 data, the most numerous races in Sulphur Springs, TX are Hispanic (2,821 residents), White alone (10,435 residents), and Black alone (2,285 residents). 85.6% of Sulphur Springs residents speak English at home. 8.3% of Sulphur Springs, TX residents are foreign-born (6.6% born in Latin America, 1.1% born in Asia), which is 104.7% less than the foreign-born rate of 17.0% across the entire state of Texas.
Race distribution in Sulphur Springs
2000 2022
10,933,313 52.4% White alone 6,669,666 32.0% Hispanic 2,364,255 11.3% Black alone 554,445 2.7% Asian alone 230,567 1.1% Two or more races 68,859 0.3% American Indian alone 19,958 0.10% Other race alone 10,757 0.05% Native Hawaiian and Other
12,070,642 40.2% Hispanic 11,683,430 38.9% White alone 3,508,706 11.7% Black alone 1,608,173 5.4% Asian alone 956,560 3.2% Two or more races 125,763 0.4% Other race alone 47,023 0.2% American Indian alone 29,275 0.10% Native Hawaiian and Other
Income and house value in Sulphur Springs Median household income in 2022 $62,624 White non-Hispanic householders$34,129 Black householders$41,675 Some other race householders$28,284 Two or more races householders$45,330 Hispanic or Latino race householdersMedian 2022 house value $219,861 White Non-Hispanic householders$129,368 Black or African American householders$138,842 American Indian or Alaska Native householders$127,408 Some other race householders$149,623 Two or more races householders$128,062 Hispanic or Latino householders
Median age by race in Sulphur Springs
42.1 Median age for White residents40.5 43.1 37.3 Median age for Black or African American residents37.1 37.3 41.5 Median age for American Indian / Alaska Native residents41.3 -684,418,145.3 35.4 Median age for Asian residents34.1 35.5 -581,560,283.1 Median age for Native Hawaiian / Pacific Islander residents-612,729,233.5 -577,777,777.2 26.7 Median age for Other race residents35.1 24.2 46.8 Median age for Two or more races residents45.5 51.4 45.2 Median age for White alone residents43.4 46.3 25.4 Median age for Hispanic or Latino residents27.2 25.0
Owner/renter occupied households by race in Sulphur Springs
House owners and renters - White residents 2,487 57.7% Owner occupied1,824 42.3% Renter occupiedHouse owners and renters - Black or African American residents 440 45.0% Owner occupied537 55.0% Renter occupiedHouse owners and renters - Asian residents 82 100.0% Owner occupiedHouse owners and renters - Other race residents 85 33.6% Owner occupied168 66.4% Renter occupiedHouse owners and renters - Two or more races residents 264 74.2% Owner occupied92 25.8% Renter occupiedHouse owners and renters - White alone residents 2,657 57.6% Owner occupied1,959 42.4% Renter occupiedHouse owners and renters - Hispanic or Latino residents 354 51.5% Owner occupied334 48.5% Renter occupied
Language usage in Sulphur Springs
English speakers - Total 85.6% of residents of Sulphur Springs speak English at home.
12.9% of residents speak Spanish at home 1,071 53.4% Speak English very well936 46.6% Speak English less than very well1.4% of residents speak other language at home 103 48.1% Speak English very well111 51.9% Speak English less than very well
English speakers - Born in the United States 95.1% of residents of Sulphur Springs speak English at home.
4.6% of residents speak Spanish at home 115 100.0% Speak English very well
English speakers - Native, born elsewhere 67.5% of residents of Sulphur Springs speak English at home.
29.8% of residents speak Spanish at home 34 100.0% Speak English less than very well
English speakers - Foreign-born 9.6% of residents of Sulphur Springs speak English at home.
75.4% of residents speak Spanish at home 318 30.8% Speak English very well713 69.2% Speak English less than very well14.2% of residents speak other language at home 85 43.8% Speak English very well109 56.2% Speak English less than very well
White (Caucasian) - Speak only English Native:
100.0% (9,610)Foreign-born:
30.8% (68)
White (Caucasian) - Speak another language Native:
3.8% (364)Foreign-born:
73.0% (161)
Asian - Speak only English Native:
100.0% (13)Foreign-born:
19.2% (38)
Other race - Speak only English Native:
48.3% (227)Foreign-born:
3.0% (13)
Other race - Speak another language Native:
52.6% (248)Foreign-born:
96.7% (403)
Two or more races - Speak another language Native:
21.6% (136)Foreign-born:
100.0% (562)
White alone - Speak only English Native:
99.6% (9,902)Foreign-born:
45.1% (30)
White alone - Speak another language Native:
0.5% (51)Foreign-born:
55.0% (37)
Hispanic or Latino - Speak only English Native:
39.5% (607)Foreign-born:
6.4% (68)
Hispanic or Latino - Speak another language Native:
60.4% (928)Foreign-born:
93.7% (994)
Foreign-born residents in Sulphur Springs 1,367 residents are foreign born (6.6% Latin America , 1.1% Asia ).
This city:
8.3%Texas:
17.1%
Marital status for residents in Sulphur Springs Marital status - White (Caucasian) population 15 years and over
Males 29.1% Never married54.0% Now married1.8% Separated3.4% Widowed11.7% DivorcedFemales 18.8% Never married50.5% Now married2.3% Separated10.4% Widowed18.1% DivorcedWomen who gave birth in the past 12 months Now married:
80.0% (113)Unmarried:
20.0% (28)
Women who did not give birth in the past 12 months Now married:
55.0% (1,187)Unmarried:
45.0% (973)
Marital status - Black or African American population 15 years and over
Males 48.4% Never married27.7% Now married3.8% Separated2.7% Widowed17.4% DivorcedFemales 41.6% Never married15.1% Now married6.8% Separated19.0% Widowed17.4% DivorcedWomen who gave birth in the past 12 months Now married:
0.0% (0)Unmarried:
100.0% (21)
Women who did not give birth in the past 12 months Now married:
15.4% (60)Unmarried:
84.6% (327)
Marital status - American Indian / Alaska Native population 15 years and over
Males 0.0% Never married82.6% Now married0.0% Separated0.0% Widowed17.4% DivorcedFemales 0.0% Never married100.0% Now married0.0% Separated0.0% Widowed0.0% DivorcedMarital status - Asian population 15 years and over
Males 35.2% Never married64.8% Now married0.0% Separated0.0% Widowed0.0% DivorcedFemales 15.3% Never married84.7% Now married0.0% Separated0.0% Widowed0.0% DivorcedWomen who did not give birth in the past 12 months Now married:
100.0% (54)Unmarried:
0.0% (0)
Marital status - Other race population 15 years and over
Males 4.7% Never married83.8% Now married0.0% Separated0.0% Widowed11.5% DivorcedFemales 39.2% Never married57.6% Now married3.1% Separated0.0% Widowed0.0% DivorcedWomen who did not give birth in the past 12 months Now married:
58.0% (214)Unmarried:
42.0% (155)
Marital status - Two or more races population 15 years and over
Males 42.4% Never married49.7% Now married0.0% Separated1.2% Widowed6.8% DivorcedFemales 21.3% Never married52.2% Now married1.4% Separated12.4% Widowed12.7% DivorcedWomen who did not give birth in the past 12 months Now married:
45.2% (91)Unmarried:
54.8% (111)
Marital status - White alone, not Hispanic / Latino population 15 years and over
Males 25.8% Never married55.9% Now married2.0% Separated3.8% Widowed12.5% DivorcedFemales 16.3% Never married50.5% Now married2.0% Separated11.8% Widowed19.4% DivorcedWomen who gave birth in the past 12 months Now married:
79.4% (84)Unmarried:
20.6% (22)
Women who did not give birth in the past 12 months Now married:
57.0% (1,234)Unmarried:
43.0% (932)
Marital status - Hispanic or Latino population 15 years and over
Males 36.7% Never married57.8% Now married0.0% Separated0.0% Widowed5.5% DivorcedFemales 35.8% Never married54.4% Now married3.2% Separated1.9% Widowed4.7% DivorcedWomen who gave birth in the past 12 months Now married:
80.9% (57)Unmarried:
19.1% (14)
Women who did not give birth in the past 12 months Now married:
49.9% (403)Unmarried:
50.1% (405)
Ancestries in Sulphur Springs
1,195 14.3% English1,015 12.1% American791 9.5% Irish434 5.2% German187 2.2% Scottish107 1.3% European94 1.1% Scotch-Irish58 0.7% Italian54 0.6% African42 0.5% Belizean38 0.5% Norwegian34 0.4% French16 0.2% Polish14 0.2% Ukrainian13 0.2% Welsh12 0.1% Armenian11 0.1% Dutch8 0.10% Cajun8 0.10% Eastern European8 0.10% Scandinavian
Children Nativity (place of birth) in Sulphur Springs
Children under 6 years - Living with two parents Both parents native 469 100.0% NativeBoth parents foreign-born 140 83.3% Native28 16.7% Foreign-bornOne native, one foreign-born parent 9 100.0% NativeChildren under 6 years - Living with one parent Native parent 415 100.0% NativeForeign-born parent 12 100.0% NativeChildren 6 to 17 years - Living with two parents Both parents native 1,555 100.0% Native0 0.0% Foreign-bornBoth parents foreign-born 273 78.4% Native75 21.6% Foreign-bornOne native, one foreign-born parent 16 100.0% NativeChildren 6 to 17 years - Living with one parent Native parent 445 100.0% NativeForeign-born parent 59 50.5% Native58 49.5% Foreign-born
Grandparents responsible for own grandchildren in Sulphur Springs
Grandparents (30 to 59 years) White / Caucasian 51 69.5% Responsible for grandchildren22 30.5% Not responsible for grandchildrenBlack or African American 180 93.2% Responsible for grandchildren13 6.8% Not responsible for grandchildrenWhite alone, not Hispanic / Latino 66 70.0% Responsible for grandchildren28 30.0% Not responsible for grandchildrenHispanic or Latino 6 100.0% Not responsible for grandchildrenGrandparents (60 years and over) White / Caucasian 103 64.5% Responsible for grandchildren57 35.5% Not responsible for grandchildrenWhite alone, not Hispanic / Latino 74 48.7% Responsible for grandchildren78 51.3% Not responsible for grandchildrenHispanic or Latino 54 100.0% Responsible for grandchildren