Races in Sulphur, Louisiana (LA) Detailed Stats
Data:
Races - White alone (%)
Races - White alone (% change since 2000)
Races - Black alone (%)
Races - Black alone (% change since 2000)
Races - American Indian alone (%)
Races - American Indian alone (% change since 2000)
Races - Asian alone (%)
Races - Asian alone (% change since 2000)
Races - Hispanic (%)
Races - Hispanic (% change since 2000)
Races - Native Hawaiian and Other Pacific Islander alone (%)
Races - Native Hawaiian and Other Pacific Islander alone (% change since 2000)
Races - Two or more races(%)
Races - Two or more races(% change since 2000)
Races - Other race alone (%)
Races - Other race alone (% change since 2000)
Racial diversity
Place of birth - Born in state of residence (%)
Place of birth - Born in state of residence (%) - White
Place of birth - Born in state of residence (%) - Black or African American
Place of birth - Born in state of residence (%) - Asian
Place of birth - Born in state of residence (%) - Hispanic or Latino
Place of birth - Born in state of residence (%) - American Indian and Alaska Native
Place of birth - Born in state of residence (%) - Multirace
Place of birth - Born in state of residence (%) - Other Race
Place of birth - Born in other state (%)
Place of birth - Born in other state (%) - White
Place of birth - Born in other state (%) - Black or African American
Place of birth - Born in other state (%) - Asian
Place of birth - Born in other state (%) - Hispanic or Latino
Place of birth - Born in other state (%) - American Indian and Alaska Native
Place of birth - Born in other state (%) - Multirace
Place of birth - Born in other state (%) - Other Race
Place of birth - Native, outside of US (%)
Place of birth - Native, outside of US (%) - White
Place of birth - Native, outside of US (%) - Black or African American
Place of birth - Native, outside of US (%) - Asian
Place of birth - Native, outside of US (%) - Hispanic or Latino
Place of birth - Native, outside of US (%) - American Indian and Alaska Native
Place of birth - Native, outside of US (%) - Multirace
Place of birth - Native, outside of US (%) - Other Race
Place of birth - Foreign born (%)
Place of birth - Foreign born (%) - White
Place of birth - Foreign born (%) - Black or African American
Place of birth - Foreign born (%) - Asian
Place of birth - Foreign born (%) - Hispanic or Latino
Place of birth - Foreign born (%) - American Indian and Alaska Native
Place of birth - Foreign born (%) - Multirace
Place of birth - Foreign born (%) - Other Race
Residents speaking English at home (%)
Residents speaking English at home - Born in the United States (%)
Residents speaking English at home - Native, born elsewhere (%)
Residents speaking English at home - Foreign born (%)
Residents speaking Spanish at home (%)
Residents speaking Spanish at home - Born in the United States (%)
Residents speaking Spanish at home - Native, born elsewhere (%)
Residents speaking Spanish at home - Foreign born (%)
Residents speaking other language at home (%)
Residents speaking other language at home - Born in the United States (%)
Residents speaking other language at home - Native, born elsewhere (%)
Residents speaking other language at home - Foreign born (%)
Marital status - Never married (%)
Marital status - Now married (%)
Marital status - Separated (%)
Marital status - Widowed (%)
Marital status - Divorced (%)
Ancestries Reported - Arab (%)
Ancestries Reported - Czech (%)
Ancestries Reported - Danish (%)
Ancestries Reported - Dutch (%)
Ancestries Reported - English (%)
Ancestries Reported - French (%)
Ancestries Reported - French Canadian (%)
Ancestries Reported - German (%)
Ancestries Reported - Greek (%)
Ancestries Reported - Hungarian (%)
Ancestries Reported - Irish (%)
Ancestries Reported - Italian (%)
Ancestries Reported - Lithuanian (%)
Ancestries Reported - Norwegian (%)
Ancestries Reported - Polish (%)
Ancestries Reported - Portuguese (%)
Ancestries Reported - Russian (%)
Ancestries Reported - Scotch-Irish (%)
Ancestries Reported - Scottish (%)
Ancestries Reported - Slovak (%)
Ancestries Reported - Subsaharan African (%)
Ancestries Reported - Swedish (%)
Ancestries Reported - Swiss (%)
Ancestries Reported - Ukrainian (%)
Ancestries Reported - United States (%)
Ancestries Reported - Welsh (%)
Ancestries Reported - West Indian (%)
Ancestries Reported - Other (%)
Geographical mobility - Same house 1 year ago (%)
Geographical mobility - Same house 1 year ago (%) - White
Geographical mobility - Same house 1 year ago (%) - Black or African American
Geographical mobility - Same house 1 year ago (%) - Asian
Geographical mobility - Same house 1 year ago (%) - Hispanic or Latino
Geographical mobility - Same house 1 year ago (%) - American Indian and Alaska Native
Geographical mobility - Same house 1 year ago (%) - Multirace
Geographical mobility - Same house 1 year ago (%) - Other Race
Geographical mobility - Moved within same county (%)
Geographical mobility - Moved within same county (%) - White
Geographical mobility - Moved within same county (%) - Black or African American
Geographical mobility - Moved within same county (%) - Asian
Geographical mobility - Moved within same county (%) - Hispanic or Latino
Geographical mobility - Moved within same county (%) - American Indian and Alaska Native
Geographical mobility - Moved within same county (%) - Multirace
Geographical mobility - Moved within same county (%) - Other Race
Geographical mobility - Moved from different county within same state (%)
Geographical mobility - Moved from different county within same state (%) - White
Geographical mobility - Moved from different county within same state (%) - Black or African American
Geographical mobility - Moved from different county within same state (%) - Asian
Geographical mobility - Moved from different county within same state (%) - Hispanic or Latino
Geographical mobility - Moved from different county within same state (%) - American Indian and Alaska Native
Geographical mobility - Moved from different county within same state (%) - Multirace
Geographical mobility - Moved from different county within same state (%) - Other Race
Geographical mobility - Moved from different state (%)
Geographical mobility - Moved from different state (%) - White
Geographical mobility - Moved from different state (%) - Black or African American
Geographical mobility - Moved from different state (%) - Asian
Geographical mobility - Moved from different state (%) - Hispanic or Latino
Geographical mobility - Moved from different state (%) - American Indian and Alaska Native
Geographical mobility - Moved from different state (%) - Multirace
Geographical mobility - Moved from different state (%) - Other Race
Geographical mobility - Moved from abroad (%)
Geographical mobility - Moved from abroad (%) - White
Geographical mobility - Moved from abroad (%) - Black or African American
Geographical mobility - Moved from abroad (%) - Asian
Geographical mobility - Moved from abroad (%) - Hispanic or Latino
Geographical mobility - Moved from abroad (%) - American Indian and Alaska Native
Geographical mobility - Moved from abroad (%) - Multirace
Geographical mobility - Moved from abroad (%) - Other Race
Place of birth for the foreign-born population - Ireland (%)
Place of birth for the foreign-born population - Denmark (%)
Place of birth for the foreign-born population - Norway (%)
Place of birth for the foreign-born population - Sweden (%)
Place of birth for the foreign-born population - United Kingdom (%)
Place of birth for the foreign-born population - England (%)
Place of birth for the foreign-born population - Scotland (%)
Place of birth for the foreign-born population - Other Northern Europe (%)
Place of birth for the foreign-born population - Austria (%)
Place of birth for the foreign-born population - Belgium (%)
Place of birth for the foreign-born population - France (%)
Place of birth for the foreign-born population - Germany (%)
Place of birth for the foreign-born population - Netherlands (%)
Place of birth for the foreign-born population - Switzerland (%)
Place of birth for the foreign-born population - Other Western Europe (%)
Place of birth for the foreign-born population - Greece (%)
Place of birth for the foreign-born population - Italy (%)
Place of birth for the foreign-born population - Portugal (%)
Place of birth for the foreign-born population - Spain (%)
Place of birth for the foreign-born population - Other Southern Europe (%)
Place of birth for the foreign-born population - Albania (%)
Place of birth for the foreign-born population - Belarus (%)
Place of birth for the foreign-born population - Bosnia and Herzegovina (%)
Place of birth for the foreign-born population - Bulgaria (%)
Place of birth for the foreign-born population - Croatia (%)
Place of birth for the foreign-born population - Czechoslovakia (%)
Place of birth for the foreign-born population - Hungary (%)
Place of birth for the foreign-born population - Latvia (%)
Place of birth for the foreign-born population - Lithuania (%)
Place of birth for the foreign-born population - North Macedonia (Macedonia) (%)
Place of birth for the foreign-born population - Moldova (%)
Place of birth for the foreign-born population - Poland (%)
Place of birth for the foreign-born population - Romania (%)
Place of birth for the foreign-born population - Russia (%)
Place of birth for the foreign-born population - Serbia (%)
Place of birth for the foreign-born population - Ukraine (%)
Place of birth for the foreign-born population - Other Eastern Europe (%)
Place of birth for the foreign-born population - China (%)
Place of birth for the foreign-born population - Hong Kong (%)
Place of birth for the foreign-born population - Taiwan (%)
Place of birth for the foreign-born population - Japan (%)
Place of birth for the foreign-born population - Korea (%)
Place of birth for the foreign-born population - Other Eastern Asia (%)
Place of birth for the foreign-born population - Afghanistan (%)
Place of birth for the foreign-born population - Bangladesh (%)
Place of birth for the foreign-born population - India (%)
Place of birth for the foreign-born population - Iran (%)
Place of birth for the foreign-born population - Kazakhstan (%)
Place of birth for the foreign-born population - Nepal (%)
Place of birth for the foreign-born population - Pakistan (%)
Place of birth for the foreign-born population - Sri Lanka (%)
Place of birth for the foreign-born population - Uzbekistan (%)
Place of birth for the foreign-born population - Other South Central Asia (%)
Place of birth for the foreign-born population - Burma (%)
Place of birth for the foreign-born population - Cambodia (%)
Place of birth for the foreign-born population - Indonesia (%)
Place of birth for the foreign-born population - Laos (%)
Place of birth for the foreign-born population - Malaysia (%)
Place of birth for the foreign-born population - Philippines (%)
Place of birth for the foreign-born population - Singapore (%)
Place of birth for the foreign-born population - Thailand (%)
Place of birth for the foreign-born population - Vietnam (%)
Place of birth for the foreign-born population - Other South Eastern Asia (%)
Place of birth for the foreign-born population - Armenia (%)
Place of birth for the foreign-born population - Iraq (%)
Place of birth for the foreign-born population - Israel (%)
Place of birth for the foreign-born population - Jordan (%)
Place of birth for the foreign-born population - Kuwait (%)
Place of birth for the foreign-born population - Lebanon (%)
Place of birth for the foreign-born population - Saudi Arabia (%)
Place of birth for the foreign-born population - Syria (%)
Place of birth for the foreign-born population - Turkey (%)
Place of birth for the foreign-born population - Yemen (%)
Place of birth for the foreign-born population - Other Western Asia (%)
Place of birth for the foreign-born population - Eritrea (%)
Place of birth for the foreign-born population - Ethiopia (%)
Place of birth for the foreign-born population - Kenya (%)
Place of birth for the foreign-born population - Somalia (%)
Place of birth for the foreign-born population - Uganda (%)
Place of birth for the foreign-born population - Zimbabwe (%)
Place of birth for the foreign-born population - Other Eastern Africa (%)
Place of birth for the foreign-born population - Cameroon (%)
Place of birth for the foreign-born population - Congo (%)
Place of birth for the foreign-born population - Democratic Republic of Congo (Zaire) (%)
Place of birth for the foreign-born population - Other Middle Africa (%)
Place of birth for the foreign-born population - Egypt (%)
Place of birth for the foreign-born population - Morocco (%)
Place of birth for the foreign-born population - Sudan (%)
Place of birth for the foreign-born population - Other Northern Africa (%)
Place of birth for the foreign-born population - South Africa (%)
Place of birth for the foreign-born population - Other Southern Africa (%)
Place of birth for the foreign-born population - Cabo Verde (%)
Place of birth for the foreign-born population - Ghana (%)
Place of birth for the foreign-born population - Liberia (%)
Place of birth for the foreign-born population - Nigeria (%)
Place of birth for the foreign-born population - Senegal (%)
Place of birth for the foreign-born population - Sierra Leone (%)
Place of birth for the foreign-born population - Other Western Africa (%)
Place of birth for the foreign-born population - Australia (%)
Place of birth for the foreign-born population - New Zealand (%)
Place of birth for the foreign-born population - Fiji (%)
Place of birth for the foreign-born population - Micronesia (%)
Place of birth for the foreign-born population - Bahamas (%)
Place of birth for the foreign-born population - Barbados (%)
Place of birth for the foreign-born population - Cuba (%)
Place of birth for the foreign-born population - Dominica (%)
Place of birth for the foreign-born population - Dominican Republic (%)
Place of birth for the foreign-born population - Grenada (%)
Place of birth for the foreign-born population - Haiti (%)
Place of birth for the foreign-born population - Jamaica (%)
Place of birth for the foreign-born population - St. Vincent and the Grenadines (%)
Place of birth for the foreign-born population - Trinidad and Tobago (%)
Place of birth for the foreign-born population - West Indies (%)
Place of birth for the foreign-born population - Other Caribbean (%)
Place of birth for the foreign-born population - Belize (%)
Place of birth for the foreign-born population - Costa Rica (%)
Place of birth for the foreign-born population - El Salvador (%)
Place of birth for the foreign-born population - Guatemala (%)
Place of birth for the foreign-born population - Honduras (%)
Place of birth for the foreign-born population - Mexico (%)
Place of birth for the foreign-born population - Nicaragua (%)
Place of birth for the foreign-born population - Panama (%)
Place of birth for the foreign-born population - Other Central America (%)
Place of birth for the foreign-born population - Argentina (%)
Place of birth for the foreign-born population - Bolivia (%)
Place of birth for the foreign-born population - Brazil (%)
Place of birth for the foreign-born population - Chile (%)
Place of birth for the foreign-born population - Colombia (%)
Place of birth for the foreign-born population - Ecuador (%)
Place of birth for the foreign-born population - Guyana (%)
Place of birth for the foreign-born population - Peru (%)
Place of birth for the foreign-born population - Uruguay (%)
Place of birth for the foreign-born population - Venezuela (%)
Place of birth for the foreign-born population - Other South America (%)
Place of birth for the foreign-born population - Canada (%)
Place of birth for the foreign-born population - Other Northern America (%)
Place of birth for the foreign-born population - Other (%)
Latest news about races in Sulphur, LA collected exclusively by city-data.com from local newspapers, TV, and radio stations
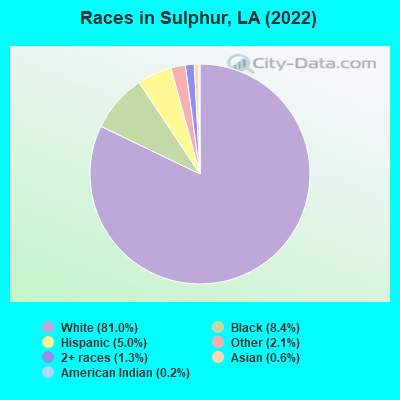
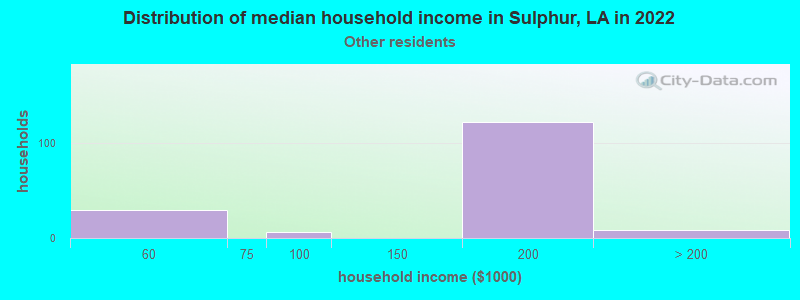
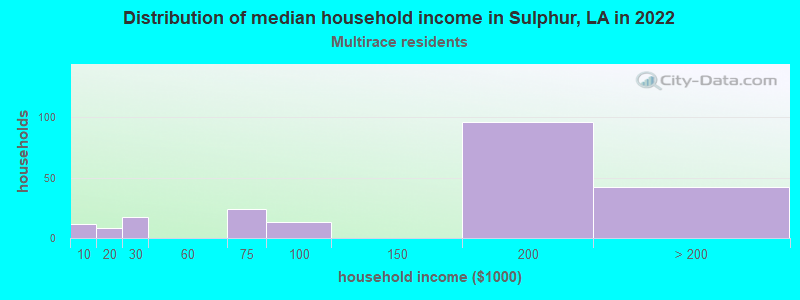
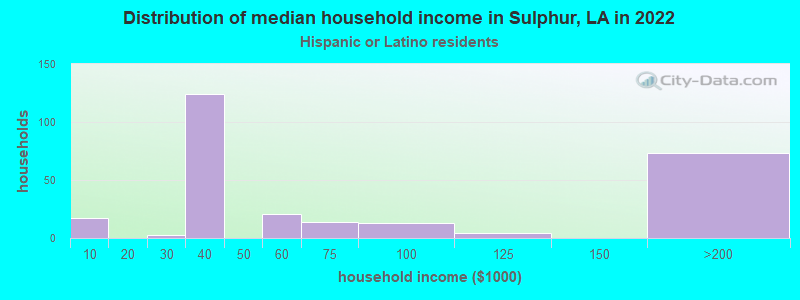
According to 2022 data, the most numerous races in Sulphur, LA are White alone (16,550 residents), Black alone (1,718 residents), and Hispanic (1,015 residents). 93.6% of Sulphur residents speak English at home. 3.9% of Sulphur, LA residents are foreign-born (1.6% born in Latin America, 1.0% born in Europe, 0.6% born in Asia, 0.5% born in Africa), which is 3.2% less than the foreign-born rate of 4.0% across the entire state of Louisiana.
Race distribution in Sulphur
2000 2022
2,794,391 62.5% White alone 1,443,390 32.3% Black alone 107,738 2.4% Hispanic 54,256 1.2% Asian alone 39,260 0.9% Two or more races 24,129 0.5% American Indian alone 4,736 0.1% Other race alone 1,076 0.02% Native Hawaiian and Other
2,603,221 56.7% White alone 1,420,055 30.9% Black alone 262,213 5.7% Hispanic 183,270 4.0% Two or more races 81,169 1.8% Asian alone 19,991 0.4% American Indian alone 18,043 0.4% Other race alone 2,279 0.05% Native Hawaiian and Other
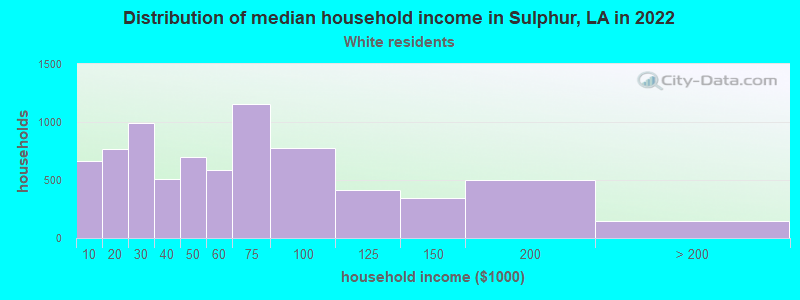
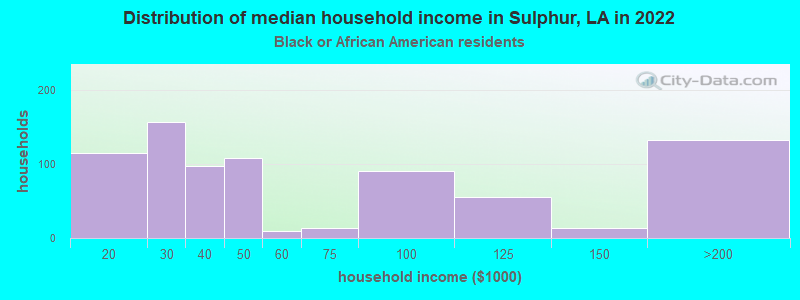
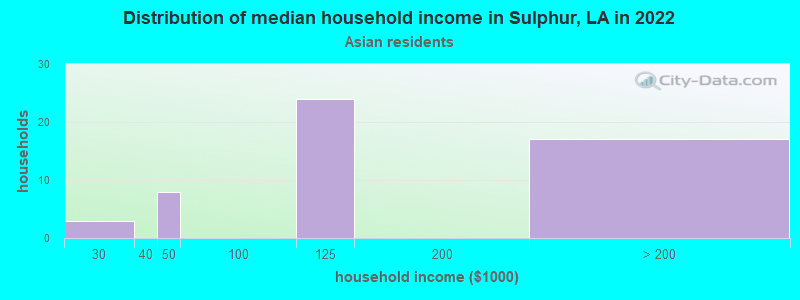
Income and house value in Sulphur Median household income in 2022 $52,147 White non-Hispanic householders$39,032 Black householders$168,558 Some other race householders$160,215 Two or more races householdersMedian 2022 house value $193,863 White Non-Hispanic householders$146,143 Black or African American householders$252,022 American Indian or Alaska Native householders $245,809 Asian householders$161,553 Native Hawaiian and other Pacific Islander householders$245,063 Some other race householders$195,354 Two or more races householders$169,257 Hispanic or Latino householders
Median age by race in Sulphur
42.0 Median age for White residents39.2 43.7 31.4 Median age for Black or African American residents32.7 31.7 45.4 Median age for American Indian / Alaska Native residents-739,906,102.5 47.0 53.7 Median age for Asian residents64.1 48.1 -821,138,210.6 Median age for Native Hawaiian / Pacific Islander residents-868,167,201.7 -599,999,999.4 15.6 Median age for Other race residents36.7 13.5 22.2 Median age for Two or more races residents29.2 16.9 42.4 Median age for White alone residents39.8 43.8 17.1 Median age for Hispanic or Latino residents37.5 14.9
Owner/renter occupied households by race in Sulphur
House owners and renters - White residents 5,299 74.2% Owner occupied1,844 25.8% Renter occupiedHouse owners and renters - Black or African American residents 311 39.3% Owner occupied481 60.7% Renter occupiedHouse owners and renters - American Indian / Alaska Native residents 8 100.0% Owner occupiedHouse owners and renters - Asian residents 32 79.6% Owner occupied8 20.4% Renter occupiedHouse owners and renters - Other race residents 117 94.1% Owner occupied7 5.9% Renter occupiedHouse owners and renters - Two or more races residents 116 49.2% Owner occupied120 50.8% Renter occupiedHouse owners and renters - White alone residents 5,284 74.4% Owner occupied1,820 25.6% Renter occupiedHouse owners and renters - Hispanic or Latino residents 81 42.3% Owner occupied111 57.7% Renter occupied
Language usage in Sulphur
English speakers - Total 93.6% of residents of Sulphur speak English at home.
3.3% of residents speak Spanish at home 165 26.3% Speak English very well463 73.7% Speak English less than very well3.4% of residents speak other language at home 507 78.7% Speak English very well137 21.3% Speak English less than very well
English speakers - Born in the United States 93.5% of residents of Sulphur speak English at home.
6.4% of residents speak Spanish at home 71 32.7% Speak English very well146 67.3% Speak English less than very well
All residents speak only English at home
English speakers - Foreign-born 23.5% of residents of Sulphur speak English at home.
34.2% of residents speak Spanish at home 42 14.6% Speak English very well245 85.4% Speak English less than very well40.6% of residents speak other language at home 210 61.6% Speak English very well131 38.4% Speak English less than very well
White (Caucasian) - Speak only English Native:
97.4% (15,204)Foreign-born:
12.5% (37)
White (Caucasian) - Speak another language Native:
2.6% (407)Foreign-born:
64.2% (191)
Black or African American - Speak only English Native:
96.7% (1,288)Foreign-born:
46.7% (70)
Black or African American - Speak another language Native:
3.6% (47)Foreign-born:
53.0% (80)
Asian - Speak only English Native:
91.2% (56)Foreign-born:
11.6% (9)
Other race - Speak only English Native:
89.8% (364)Foreign-born:
24.5% (29)
Other race - Speak another language Native:
15.1% (61)Foreign-born:
72.4% (85)
White alone - Speak only English Native:
98.4% (15,199)Foreign-born:
13.8% (38)
White alone - Speak another language Native:
1.7% (260)Foreign-born:
80.7% (221)
Hispanic or Latino - Speak only English Native:
55.7% (317)Foreign-born:
14.6% (49)
Hispanic or Latino - Speak another language Native:
33.6% (191)Foreign-born:
82.5% (279)
Foreign-born residents in Sulphur 792 residents are foreign born (1.6% Latin America , 1.0% Europe , 0.6% Asia , 0.5% Africa ).
This city:
3.9%Louisiana:
4.2%
Marital status for residents in Sulphur Marital status - White (Caucasian) population 15 years and over
Males 34.5% Never married46.0% Now married0.2% Separated4.1% Widowed15.1% DivorcedFemales 26.2% Never married41.3% Now married0.5% Separated10.6% Widowed21.3% DivorcedWomen who gave birth in the past 12 months Now married:
70.7% (147)Unmarried:
29.3% (61)
Women who did not give birth in the past 12 months Now married:
35.3% (1,335)Unmarried:
64.7% (2,448)
Marital status - Black or African American population 15 years and over
Males 26.0% Never married31.6% Now married10.2% Separated21.9% Widowed10.3% DivorcedFemales 66.5% Never married16.1% Now married0.0% Separated4.4% Widowed13.1% DivorcedWomen who gave birth in the past 12 months Now married:
0.0% (0)Unmarried:
100.0% (115)
Women who did not give birth in the past 12 months Now married:
21.8% (104)Unmarried:
78.2% (374)
Marital status - Asian population 15 years and over
Males 0.0% Never married85.2% Now married0.0% Separated14.8% Widowed0.0% DivorcedFemales 18.5% Never married81.5% Now married0.0% Separated0.0% Widowed0.0% DivorcedWomen who gave birth in the past 12 months Now married:
100.0% (9)Unmarried:
0.0% (0)
Women who did not give birth in the past 12 months Now married:
100.0% (13)Unmarried:
0.0% (0)
Marital status - Other race population 15 years and over
Males 39.8% Never married36.2% Now married0.0% Separated0.0% Widowed24.0% DivorcedFemales 42.4% Never married57.6% Now married0.0% Separated0.0% Widowed0.0% DivorcedWomen who did not give birth in the past 12 months Now married:
52.8% (60)Unmarried:
47.2% (53)
Marital status - Two or more races population 15 years and over
Males 27.4% Never married68.3% Now married4.3% Separated0.0% Widowed0.0% DivorcedFemales 53.1% Never married29.2% Now married0.0% Separated0.0% Widowed17.7% DivorcedWomen who did not give birth in the past 12 months Now married:
33.3% (43)Unmarried:
66.7% (86)
Marital status - White alone, not Hispanic / Latino population 15 years and over
Males 34.7% Never married45.4% Now married0.2% Separated4.2% Widowed15.5% DivorcedFemales 25.8% Never married41.2% Now married0.5% Separated10.8% Widowed21.7% DivorcedWomen who gave birth in the past 12 months Now married:
70.7% (149)Unmarried:
29.3% (62)
Women who did not give birth in the past 12 months Now married:
34.9% (1,301)Unmarried:
65.1% (2,426)
Marital status - Hispanic or Latino population 15 years and over
Males 37.1% Never married45.7% Now married2.0% Separated0.0% Widowed15.2% DivorcedFemales 49.1% Never married49.1% Now married0.0% Separated0.0% Widowed1.8% DivorcedWomen who did not give birth in the past 12 months Now married:
49.5% (113)Unmarried:
50.5% (115)
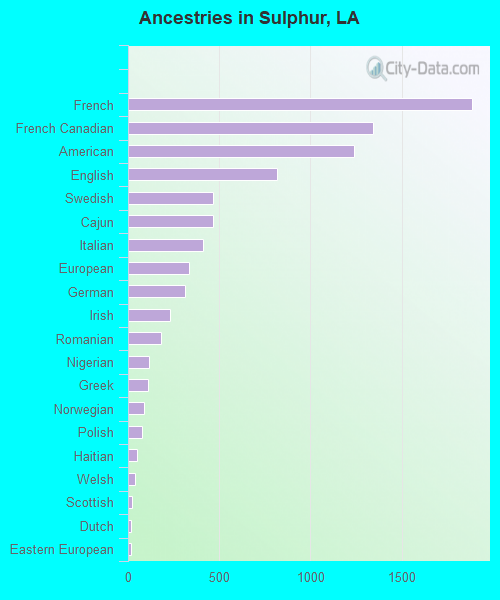
Ancestries in Sulphur
1,884 16.7% French1,342 11.9% French Canadian1,240 11.0% American814 7.2% English467 4.1% Swedish465 4.1% Cajun409 3.6% Italian332 2.9% European311 2.8% German232 2.1% Irish181 1.6% Romanian116 1.0% Nigerian108 1.0% Greek90 0.8% Norwegian77 0.7% Polish52 0.5% Haitian39 0.3% Welsh21 0.2% Scottish18 0.2% Dutch18 0.2% Eastern European17 0.2% Lebanese16 0.1% British14 0.1% Turkish12 0.1% Portuguese9 0.08% Croatian6 0.05% Scotch-Irish6 0.05% African
Children Nativity (place of birth) in Sulphur
Children under 6 years - Living with two parents Both parents native 712 100.0% NativeBoth parents foreign-born 102 100.0% NativeOne native, one foreign-born parent 9 100.0% NativeChildren under 6 years - Living with one parent Native parent 909 100.0% NativeChildren 6 to 17 years - Living with two parents Both parents native 1,643 99.6% Native7 0.4% Foreign-bornBoth parents foreign-born 191 100.0% NativeOne native, one foreign-born parent 50 68.0% Native23 32.0% Foreign-bornChildren 6 to 17 years - Living with one parent Native parent 930 94.3% Native56 5.7% Foreign-bornForeign-born parent 100 80.8% Native24 19.2% Foreign-born
Grandparents responsible for own grandchildren in Sulphur
Grandparents (30 to 59 years) White / Caucasian 13 40.1% Responsible for grandchildren19 59.9% Not responsible for grandchildrenBlack or African American 75 100.0% Not responsible for grandchildrenWhite alone, not Hispanic / Latino 13 38.8% Responsible for grandchildren20 61.2% Not responsible for grandchildrenGrandparents (60 years and over) White / Caucasian 77 17.2% Responsible for grandchildren367 82.8% Not responsible for grandchildrenBlack or African American 37 100.0% Not responsible for grandchildrenWhite alone, not Hispanic / Latino 77 17.2% Responsible for grandchildren368 82.8% Not responsible for grandchildren