Races in Southeast Leon, Florida (FL) Detailed Stats
Ancestries, Foreign-born residents, place of birth
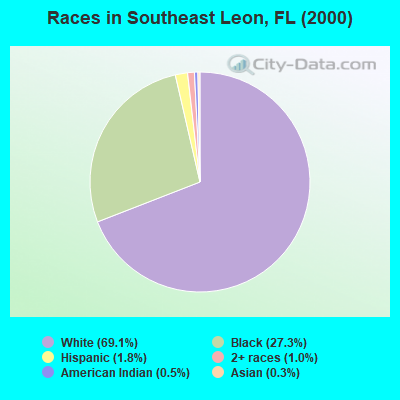
Race distribution in Southeast Leon

- 7,21269.1%White alone
- 2,84427.3%Black alone
- 1841.8%Hispanic
- 1011.0%Two or more races
- 550.5%American Indian alone
- 290.3%Asian alone
- 60.06%Other race alone
2000
2022
-
- 10,458,50965.4%White alone
- 2,682,71516.8%Hispanic
- 2,264,26814.2%Black alone
- 261,6931.6%Asian alone
- 236,9541.5%Two or more races
- 42,3580.3%American Indian alone
- 28,9940.2%Other race alone
- 6,8870.04%Native Hawaiian and Other
Pacific Islander alone

-
- 11,309,40350.8%White alone
- 6,025,03927.1%Hispanic
- 3,241,01514.6%Black alone
- 861,6303.9%Two or more races
- 623,6922.8%Asian alone
- 152,0540.7%Other race alone
- 22,5040.1%American Indian alone
- 9,4860.04%Native Hawaiian and Other
Pacific Islander alone

Income and house value in Southeast Leon
- Median household income in 2022
- $77,049White non-Hispanic householders
- $65,630Black householders
- $78,694American Indian and Alaska Native householders
- $58,854Asian householders
- $149,389Two or more races householders
- $190,722Hispanic or Latino race householders
- Median 2022 house value
- $274,258White Non-Hispanic householders
- $215,060Black or African American householders
- $321,732American Indian or Alaska Native householders
- $469,871Asian householders
- $271,684Native Hawaiian and other Pacific Islander householders
- $370,921Two or more races householders
- $321,732Hispanic or Latino householders
Household income for White non-Hispanic householders

Household income for Black householders

Household income for American Indian and Alaska Native householders

Household income for Asian householders

Household income for Native Hawaiian and other Pacific Islander householders

Household income for Two or more races householders

Household income for Hispanic or Latino race householders

Zip code: 32311