Races in South Bell, Texas (TX) Detailed Stats
Ancestries, Foreign-born residents, place of birth
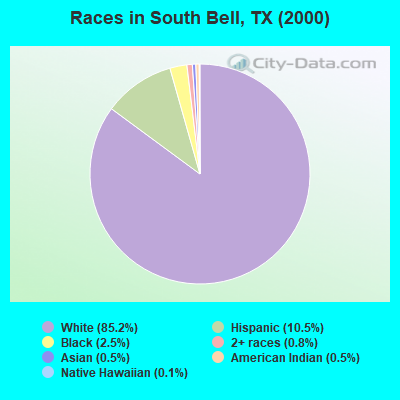
Race distribution in South Bell

- 6,24285.2%White alone
- 77010.5%Hispanic
- 1812.5%Black alone
- 570.8%Two or more races
- 350.5%Asian alone
- 330.5%American Indian alone
- 90.1%Native Hawaiian and Other
Pacific Islander alone
2000
2022
-
- 10,933,31352.4%White alone
- 6,669,66632.0%Hispanic
- 2,364,25511.3%Black alone
- 554,4452.7%Asian alone
- 230,5671.1%Two or more races
- 68,8590.3%American Indian alone
- 19,9580.10%Other race alone
- 10,7570.05%Native Hawaiian and Other
Pacific Islander alone

-
- 12,070,64240.2%Hispanic
- 11,683,43038.9%White alone
- 3,508,70611.7%Black alone
- 1,608,1735.4%Asian alone
- 956,5603.2%Two or more races
- 125,7630.4%Other race alone
- 47,0230.2%American Indian alone
- 29,2750.10%Native Hawaiian and Other
Pacific Islander alone

Income and house value in South Bell
- Median household income in 2022
- $90,018White non-Hispanic householders
- $18,506Black householders
- $94,088American Indian and Alaska Native householders
- $113,821Asian householders
- $67,240Some other race householders
- over $200,000Two or more races householders
- $77,578Hispanic or Latino race householders
- Median 2022 house value
- $408,475White Non-Hispanic householders
- $198,366Black or African American householders
- $401,677American Indian or Alaska Native householders
- $200,838Asian householders
- $154,491Some other race householders
- over $1,000,000Two or more races householders
- $177,047Hispanic or Latino householders
Household income for White non-Hispanic householders

Household income for Black householders

Household income for American Indian and Alaska Native householders

Household income for Asian householders

Household income for Two or more races householders

Household income for Hispanic or Latino race householders

Zip code: 76571