Races in Socorro, Texas (TX) Detailed Stats
Data:
Races - White alone (%)
Races - White alone (% change since 2000)
Races - Black alone (%)
Races - Black alone (% change since 2000)
Races - American Indian alone (%)
Races - American Indian alone (% change since 2000)
Races - Asian alone (%)
Races - Asian alone (% change since 2000)
Races - Hispanic (%)
Races - Hispanic (% change since 2000)
Races - Native Hawaiian and Other Pacific Islander alone (%)
Races - Native Hawaiian and Other Pacific Islander alone (% change since 2000)
Races - Two or more races(%)
Races - Two or more races(% change since 2000)
Races - Other race alone (%)
Races - Other race alone (% change since 2000)
Racial diversity
Place of birth - Born in state of residence (%)
Place of birth - Born in state of residence (%) - White
Place of birth - Born in state of residence (%) - Black or African American
Place of birth - Born in state of residence (%) - Asian
Place of birth - Born in state of residence (%) - Hispanic or Latino
Place of birth - Born in state of residence (%) - American Indian and Alaska Native
Place of birth - Born in state of residence (%) - Multirace
Place of birth - Born in state of residence (%) - Other Race
Place of birth - Born in other state (%)
Place of birth - Born in other state (%) - White
Place of birth - Born in other state (%) - Black or African American
Place of birth - Born in other state (%) - Asian
Place of birth - Born in other state (%) - Hispanic or Latino
Place of birth - Born in other state (%) - American Indian and Alaska Native
Place of birth - Born in other state (%) - Multirace
Place of birth - Born in other state (%) - Other Race
Place of birth - Native, outside of US (%)
Place of birth - Native, outside of US (%) - White
Place of birth - Native, outside of US (%) - Black or African American
Place of birth - Native, outside of US (%) - Asian
Place of birth - Native, outside of US (%) - Hispanic or Latino
Place of birth - Native, outside of US (%) - American Indian and Alaska Native
Place of birth - Native, outside of US (%) - Multirace
Place of birth - Native, outside of US (%) - Other Race
Place of birth - Foreign born (%)
Place of birth - Foreign born (%) - White
Place of birth - Foreign born (%) - Black or African American
Place of birth - Foreign born (%) - Asian
Place of birth - Foreign born (%) - Hispanic or Latino
Place of birth - Foreign born (%) - American Indian and Alaska Native
Place of birth - Foreign born (%) - Multirace
Place of birth - Foreign born (%) - Other Race
Residents speaking English at home (%)
Residents speaking English at home - Born in the United States (%)
Residents speaking English at home - Native, born elsewhere (%)
Residents speaking English at home - Foreign born (%)
Residents speaking Spanish at home (%)
Residents speaking Spanish at home - Born in the United States (%)
Residents speaking Spanish at home - Native, born elsewhere (%)
Residents speaking Spanish at home - Foreign born (%)
Residents speaking other language at home (%)
Residents speaking other language at home - Born in the United States (%)
Residents speaking other language at home - Native, born elsewhere (%)
Residents speaking other language at home - Foreign born (%)
Marital status - Never married (%)
Marital status - Now married (%)
Marital status - Separated (%)
Marital status - Widowed (%)
Marital status - Divorced (%)
Ancestries Reported - Arab (%)
Ancestries Reported - Czech (%)
Ancestries Reported - Danish (%)
Ancestries Reported - Dutch (%)
Ancestries Reported - English (%)
Ancestries Reported - French (%)
Ancestries Reported - French Canadian (%)
Ancestries Reported - German (%)
Ancestries Reported - Greek (%)
Ancestries Reported - Hungarian (%)
Ancestries Reported - Irish (%)
Ancestries Reported - Italian (%)
Ancestries Reported - Lithuanian (%)
Ancestries Reported - Norwegian (%)
Ancestries Reported - Polish (%)
Ancestries Reported - Portuguese (%)
Ancestries Reported - Russian (%)
Ancestries Reported - Scotch-Irish (%)
Ancestries Reported - Scottish (%)
Ancestries Reported - Slovak (%)
Ancestries Reported - Subsaharan African (%)
Ancestries Reported - Swedish (%)
Ancestries Reported - Swiss (%)
Ancestries Reported - Ukrainian (%)
Ancestries Reported - United States (%)
Ancestries Reported - Welsh (%)
Ancestries Reported - West Indian (%)
Ancestries Reported - Other (%)
Geographical mobility - Same house 1 year ago (%)
Geographical mobility - Same house 1 year ago (%) - White
Geographical mobility - Same house 1 year ago (%) - Black or African American
Geographical mobility - Same house 1 year ago (%) - Asian
Geographical mobility - Same house 1 year ago (%) - Hispanic or Latino
Geographical mobility - Same house 1 year ago (%) - American Indian and Alaska Native
Geographical mobility - Same house 1 year ago (%) - Multirace
Geographical mobility - Same house 1 year ago (%) - Other Race
Geographical mobility - Moved within same county (%)
Geographical mobility - Moved within same county (%) - White
Geographical mobility - Moved within same county (%) - Black or African American
Geographical mobility - Moved within same county (%) - Asian
Geographical mobility - Moved within same county (%) - Hispanic or Latino
Geographical mobility - Moved within same county (%) - American Indian and Alaska Native
Geographical mobility - Moved within same county (%) - Multirace
Geographical mobility - Moved within same county (%) - Other Race
Geographical mobility - Moved from different county within same state (%)
Geographical mobility - Moved from different county within same state (%) - White
Geographical mobility - Moved from different county within same state (%) - Black or African American
Geographical mobility - Moved from different county within same state (%) - Asian
Geographical mobility - Moved from different county within same state (%) - Hispanic or Latino
Geographical mobility - Moved from different county within same state (%) - American Indian and Alaska Native
Geographical mobility - Moved from different county within same state (%) - Multirace
Geographical mobility - Moved from different county within same state (%) - Other Race
Geographical mobility - Moved from different state (%)
Geographical mobility - Moved from different state (%) - White
Geographical mobility - Moved from different state (%) - Black or African American
Geographical mobility - Moved from different state (%) - Asian
Geographical mobility - Moved from different state (%) - Hispanic or Latino
Geographical mobility - Moved from different state (%) - American Indian and Alaska Native
Geographical mobility - Moved from different state (%) - Multirace
Geographical mobility - Moved from different state (%) - Other Race
Geographical mobility - Moved from abroad (%)
Geographical mobility - Moved from abroad (%) - White
Geographical mobility - Moved from abroad (%) - Black or African American
Geographical mobility - Moved from abroad (%) - Asian
Geographical mobility - Moved from abroad (%) - Hispanic or Latino
Geographical mobility - Moved from abroad (%) - American Indian and Alaska Native
Geographical mobility - Moved from abroad (%) - Multirace
Geographical mobility - Moved from abroad (%) - Other Race
Place of birth for the foreign-born population - Ireland (%)
Place of birth for the foreign-born population - Denmark (%)
Place of birth for the foreign-born population - Norway (%)
Place of birth for the foreign-born population - Sweden (%)
Place of birth for the foreign-born population - United Kingdom (%)
Place of birth for the foreign-born population - England (%)
Place of birth for the foreign-born population - Scotland (%)
Place of birth for the foreign-born population - Other Northern Europe (%)
Place of birth for the foreign-born population - Austria (%)
Place of birth for the foreign-born population - Belgium (%)
Place of birth for the foreign-born population - France (%)
Place of birth for the foreign-born population - Germany (%)
Place of birth for the foreign-born population - Netherlands (%)
Place of birth for the foreign-born population - Switzerland (%)
Place of birth for the foreign-born population - Other Western Europe (%)
Place of birth for the foreign-born population - Greece (%)
Place of birth for the foreign-born population - Italy (%)
Place of birth for the foreign-born population - Portugal (%)
Place of birth for the foreign-born population - Spain (%)
Place of birth for the foreign-born population - Other Southern Europe (%)
Place of birth for the foreign-born population - Albania (%)
Place of birth for the foreign-born population - Belarus (%)
Place of birth for the foreign-born population - Bosnia and Herzegovina (%)
Place of birth for the foreign-born population - Bulgaria (%)
Place of birth for the foreign-born population - Croatia (%)
Place of birth for the foreign-born population - Czechoslovakia (%)
Place of birth for the foreign-born population - Hungary (%)
Place of birth for the foreign-born population - Latvia (%)
Place of birth for the foreign-born population - Lithuania (%)
Place of birth for the foreign-born population - North Macedonia (Macedonia) (%)
Place of birth for the foreign-born population - Moldova (%)
Place of birth for the foreign-born population - Poland (%)
Place of birth for the foreign-born population - Romania (%)
Place of birth for the foreign-born population - Russia (%)
Place of birth for the foreign-born population - Serbia (%)
Place of birth for the foreign-born population - Ukraine (%)
Place of birth for the foreign-born population - Other Eastern Europe (%)
Place of birth for the foreign-born population - China (%)
Place of birth for the foreign-born population - Hong Kong (%)
Place of birth for the foreign-born population - Taiwan (%)
Place of birth for the foreign-born population - Japan (%)
Place of birth for the foreign-born population - Korea (%)
Place of birth for the foreign-born population - Other Eastern Asia (%)
Place of birth for the foreign-born population - Afghanistan (%)
Place of birth for the foreign-born population - Bangladesh (%)
Place of birth for the foreign-born population - India (%)
Place of birth for the foreign-born population - Iran (%)
Place of birth for the foreign-born population - Kazakhstan (%)
Place of birth for the foreign-born population - Nepal (%)
Place of birth for the foreign-born population - Pakistan (%)
Place of birth for the foreign-born population - Sri Lanka (%)
Place of birth for the foreign-born population - Uzbekistan (%)
Place of birth for the foreign-born population - Other South Central Asia (%)
Place of birth for the foreign-born population - Burma (%)
Place of birth for the foreign-born population - Cambodia (%)
Place of birth for the foreign-born population - Indonesia (%)
Place of birth for the foreign-born population - Laos (%)
Place of birth for the foreign-born population - Malaysia (%)
Place of birth for the foreign-born population - Philippines (%)
Place of birth for the foreign-born population - Singapore (%)
Place of birth for the foreign-born population - Thailand (%)
Place of birth for the foreign-born population - Vietnam (%)
Place of birth for the foreign-born population - Other South Eastern Asia (%)
Place of birth for the foreign-born population - Armenia (%)
Place of birth for the foreign-born population - Iraq (%)
Place of birth for the foreign-born population - Israel (%)
Place of birth for the foreign-born population - Jordan (%)
Place of birth for the foreign-born population - Kuwait (%)
Place of birth for the foreign-born population - Lebanon (%)
Place of birth for the foreign-born population - Saudi Arabia (%)
Place of birth for the foreign-born population - Syria (%)
Place of birth for the foreign-born population - Turkey (%)
Place of birth for the foreign-born population - Yemen (%)
Place of birth for the foreign-born population - Other Western Asia (%)
Place of birth for the foreign-born population - Eritrea (%)
Place of birth for the foreign-born population - Ethiopia (%)
Place of birth for the foreign-born population - Kenya (%)
Place of birth for the foreign-born population - Somalia (%)
Place of birth for the foreign-born population - Uganda (%)
Place of birth for the foreign-born population - Zimbabwe (%)
Place of birth for the foreign-born population - Other Eastern Africa (%)
Place of birth for the foreign-born population - Cameroon (%)
Place of birth for the foreign-born population - Congo (%)
Place of birth for the foreign-born population - Democratic Republic of Congo (Zaire) (%)
Place of birth for the foreign-born population - Other Middle Africa (%)
Place of birth for the foreign-born population - Egypt (%)
Place of birth for the foreign-born population - Morocco (%)
Place of birth for the foreign-born population - Sudan (%)
Place of birth for the foreign-born population - Other Northern Africa (%)
Place of birth for the foreign-born population - South Africa (%)
Place of birth for the foreign-born population - Other Southern Africa (%)
Place of birth for the foreign-born population - Cabo Verde (%)
Place of birth for the foreign-born population - Ghana (%)
Place of birth for the foreign-born population - Liberia (%)
Place of birth for the foreign-born population - Nigeria (%)
Place of birth for the foreign-born population - Senegal (%)
Place of birth for the foreign-born population - Sierra Leone (%)
Place of birth for the foreign-born population - Other Western Africa (%)
Place of birth for the foreign-born population - Australia (%)
Place of birth for the foreign-born population - New Zealand (%)
Place of birth for the foreign-born population - Fiji (%)
Place of birth for the foreign-born population - Micronesia (%)
Place of birth for the foreign-born population - Bahamas (%)
Place of birth for the foreign-born population - Barbados (%)
Place of birth for the foreign-born population - Cuba (%)
Place of birth for the foreign-born population - Dominica (%)
Place of birth for the foreign-born population - Dominican Republic (%)
Place of birth for the foreign-born population - Grenada (%)
Place of birth for the foreign-born population - Haiti (%)
Place of birth for the foreign-born population - Jamaica (%)
Place of birth for the foreign-born population - St. Vincent and the Grenadines (%)
Place of birth for the foreign-born population - Trinidad and Tobago (%)
Place of birth for the foreign-born population - West Indies (%)
Place of birth for the foreign-born population - Other Caribbean (%)
Place of birth for the foreign-born population - Belize (%)
Place of birth for the foreign-born population - Costa Rica (%)
Place of birth for the foreign-born population - El Salvador (%)
Place of birth for the foreign-born population - Guatemala (%)
Place of birth for the foreign-born population - Honduras (%)
Place of birth for the foreign-born population - Mexico (%)
Place of birth for the foreign-born population - Nicaragua (%)
Place of birth for the foreign-born population - Panama (%)
Place of birth for the foreign-born population - Other Central America (%)
Place of birth for the foreign-born population - Argentina (%)
Place of birth for the foreign-born population - Bolivia (%)
Place of birth for the foreign-born population - Brazil (%)
Place of birth for the foreign-born population - Chile (%)
Place of birth for the foreign-born population - Colombia (%)
Place of birth for the foreign-born population - Ecuador (%)
Place of birth for the foreign-born population - Guyana (%)
Place of birth for the foreign-born population - Peru (%)
Place of birth for the foreign-born population - Uruguay (%)
Place of birth for the foreign-born population - Venezuela (%)
Place of birth for the foreign-born population - Other South America (%)
Place of birth for the foreign-born population - Canada (%)
Place of birth for the foreign-born population - Other Northern America (%)
Place of birth for the foreign-born population - Other (%)
Latest news about races in Socorro, TX collected exclusively by city-data.com from local newspapers, TV, and radio stations
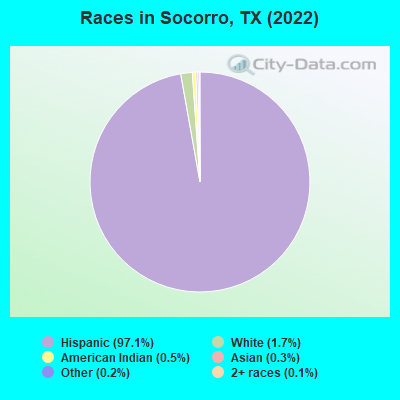
According to 2022 data, the most numerous races in Socorro, TX are Hispanic (34,583 residents), White alone (608 residents), and Black alone (21 residents). 12.6% of Socorro residents speak English at home. 33.9% of Socorro, TX residents are foreign-born (32.6% born in Latin America), which is 49.9% greater than the foreign-born rate of 17.0% across the entire state of Texas.
Race distribution in Socorro
2000 2022
10,933,313 52.4% White alone 6,669,666 32.0% Hispanic 2,364,255 11.3% Black alone 554,445 2.7% Asian alone 230,567 1.1% Two or more races 68,859 0.3% American Indian alone 19,958 0.10% Other race alone 10,757 0.05% Native Hawaiian and Other
12,070,642 40.2% Hispanic 11,683,430 38.9% White alone 3,508,706 11.7% Black alone 1,608,173 5.4% Asian alone 956,560 3.2% Two or more races 125,763 0.4% Other race alone 47,023 0.2% American Indian alone 29,275 0.10% Native Hawaiian and Other
Income and house value in Socorro Median household income in 2022 $26,580 American Indian and Alaska Native householders$74,374 Asian householders$48,396 Some other race householders$45,209 Two or more races householders$47,328 Hispanic or Latino race householdersMedian 2022 house value $271,740 White Non-Hispanic householders$152,870 Black or African American householders$119,133 American Indian or Alaska Native householders $205,320 Asian householders$131,257 Some other race householders$149,443 Two or more races householders$141,800 Hispanic or Latino householders
Median age by race in Socorro
35.4 Median age for White residents36.3 34.5 2.7 Median age for Black or African American residents-664,509,168.7 -587,301,586.7 18.0 Median age for American Indian / Alaska Native residents34.2 12.5 47.7 Median age for Asian residents50.4 71.7 -581,560,283.1 Median age for Native Hawaiian / Pacific Islander residents-612,729,233.5 -577,777,777.2 36.2 Median age for Other race residents37.2 35.9 37.5 Median age for Two or more races residents35.5 40.2 40.8 Median age for White alone residents27.6 53.1 36.1 Median age for Hispanic or Latino residents35.7 36.2
Owner/renter occupied households by race in Socorro
House owners and renters - White residents 2,508 75.1% Owner occupied831 24.9% Renter occupiedHouse owners and renters - Black or African American residents 17 100.0% Owner occupiedHouse owners and renters - American Indian / Alaska Native residents 219 64.3% Owner occupied122 35.7% Renter occupiedHouse owners and renters - Asian residents 46 77.4% Owner occupied13 22.6% Renter occupiedHouse owners and renters - Other race residents 1,820 88.2% Owner occupied244 11.8% Renter occupiedHouse owners and renters - Two or more races residents 4,917 83.7% Owner occupied957 16.3% Renter occupiedHouse owners and renters - White alone residents 112 79.8% Owner occupied28 20.2% Renter occupiedHouse owners and renters - Hispanic or Latino residents 8,793 79.2% Owner occupied2,313 20.8% Renter occupied
Language usage in Socorro
English speakers - Total 12.6% of residents of Socorro speak English at home.
85.6% of residents speak Spanish at home 15,881 55.2% Speak English very well12,890 44.8% Speak English less than very well0.4% of residents speak other language at home 64 44.4% Speak English very well80 55.6% Speak English less than very well
English speakers - Born in the United States 28.4% of residents of Socorro speak English at home.
70.0% of residents speak Spanish at home 1,221 80.4% Speak English very well298 19.6% Speak English less than very well0.6% of residents speak other language at home 14 100.0% Speak English very well
English speakers - Native, born elsewhere 3.5% of residents of Socorro speak English at home.
90.3% of residents speak Spanish at home 243 52.4% Speak English very well221 47.6% Speak English less than very well1.2% of residents speak other language at home 6 100.0% Speak English less than very well
English speakers - Foreign-born 6.2% of residents of Socorro speak English at home.
90.5% of residents speak Spanish at home 2,822 26.3% Speak English very well7,913 73.7% Speak English less than very well0.9% of residents speak other language at home 46 43.4% Speak English very well60 56.6% Speak English less than very well
White (Caucasian) - Speak only English Native:
25.3% (1,732)Foreign-born:
6.5% (157)
White (Caucasian) - Speak another language Native:
62.3% (4,267)Foreign-born:
84.1% (2,029)
American Indian / Alaska Native - Speak only English Native:
24.7% (201)Foreign-born:
42.7% (83)
American Indian / Alaska Native - Speak another language Native:
81.9% (664)Foreign-born:
62.8% (122)
Asian - Speak another language Native:
97.9% (12)Foreign-born:
97.7% (96)
Other race - Speak only English Native:
6.9% (285)Foreign-born:
9.6% (218)
Other race - Speak another language Native:
90.5% (3,746)Foreign-born:
91.6% (2,080)
Two or more races - Speak only English Native:
11.9% (1,224)Foreign-born:
5.4% (368)
Two or more races - Speak another language Native:
90.6% (9,312)Foreign-born:
94.4% (6,423)
White alone - Speak only English Native:
53.4% (301)Foreign-born:
90.0% (3)
Hispanic or Latino - Speak only English Native:
14.8% (3,127)Foreign-born:
6.3% (722)
Hispanic or Latino - Speak another language Native:
85.0% (17,918)Foreign-born:
93.7% (10,792)
Foreign-born residents in Socorro 12,084 residents are foreign born (32.6% Latin America ).
This city:
33.9%Texas:
17.1%
Marital status for residents in Socorro Marital status - White (Caucasian) population 15 years and over
Males 32.1% Never married58.2% Now married0.8% Separated3.1% Widowed5.8% DivorcedFemales 28.7% Never married48.8% Now married3.2% Separated7.9% Widowed11.3% DivorcedWomen who gave birth in the past 12 months Now married:
67.0% (69)Unmarried:
33.0% (34)
Women who did not give birth in the past 12 months Now married:
47.2% (1,121)Unmarried:
52.8% (1,255)
Marital status - American Indian / Alaska Native population 15 years and over
Males 50.5% Never married39.7% Now married2.9% Separated0.0% Widowed6.9% DivorcedFemales 35.4% Never married32.3% Now married8.4% Separated19.4% Widowed4.6% DivorcedWomen who gave birth in the past 12 months Now married:
70.0% (10)Unmarried:
30.0% (4)
Women who did not give birth in the past 12 months Now married:
45.6% (118)Unmarried:
54.4% (141)
Marital status - Asian population 15 years and over
Males 67.7% Never married0.0% Now married0.0% Separated0.0% Widowed32.3% DivorcedFemales 0.0% Never married13.9% Now married0.0% Separated86.1% Widowed0.0% DivorcedWomen who gave birth in the past 12 months Now married:
100.0% (3)Unmarried:
0.0% (0)
Women who did not give birth in the past 12 months Now married:
100.0% (4)Unmarried:
0.0% (0)
Marital status - Other race population 15 years and over
Males 43.9% Never married43.7% Now married1.5% Separated2.7% Widowed8.2% DivorcedFemales 27.9% Never married49.0% Now married5.8% Separated5.6% Widowed11.7% DivorcedWomen who gave birth in the past 12 months Now married:
100.0% (60)Unmarried:
0.0% (0)
Women who did not give birth in the past 12 months Now married:
46.8% (681)Unmarried:
53.2% (775)
Marital status - Two or more races population 15 years and over
Males 37.7% Never married51.1% Now married5.5% Separated2.0% Widowed3.7% DivorcedFemales 38.7% Never married32.8% Now married7.8% Separated12.1% Widowed8.6% DivorcedWomen who gave birth in the past 12 months Now married:
38.8% (81)Unmarried:
61.2% (129)
Women who did not give birth in the past 12 months Now married:
32.3% (1,674)Unmarried:
67.7% (3,510)
Marital status - White alone, not Hispanic / Latino population 15 years and over
Males 31.7% Never married66.5% Now married0.0% Separated1.8% Widowed0.0% DivorcedFemales 30.4% Never married61.3% Now married0.0% Separated0.0% Widowed8.3% DivorcedWomen who gave birth in the past 12 months Now married:
0.0% (0)Unmarried:
100.0% (26)
Women who did not give birth in the past 12 months Now married:
2.8% (2)Unmarried:
97.2% (68)
Marital status - Hispanic or Latino population 15 years and over
Males 36.4% Never married52.8% Now married2.4% Separated2.7% Widowed5.7% DivorcedFemales 32.1% Never married42.8% Now married5.3% Separated9.3% Widowed10.4% DivorcedWomen who gave birth in the past 12 months Now married:
67.1% (234)Unmarried:
32.9% (114)
Women who did not give birth in the past 12 months Now married:
42.2% (3,707)Unmarried:
57.8% (5,070)
Ancestries in Socorro
296 1.0% American177 0.6% English25 0.09% German2 0.01% Italian
Geographical mobility in Socorro Same house 1 year ago 8,711 89.8% White (Caucasian)96 100.0% Black or African American1,107 98.7% American Indian / Alaska Native113 88.5% Asian6,401 93.8% Other race16,594 93.7% Two or more races539 93.1% White alone, not Hispanic / Latino31,878 92.8% Hispanic or LatinoMoved within same county 674 6.9% White / Caucasian23 2.0% American Indian / Alaska Native19 15.1% Asian288 4.2% Other race1,129 6.4% Two or more races3 0.6% White alone, not Hispanic / Latino2,166 6.3% Hispanic or LatinoMoved within same state 99 1.0% White / Caucasian301 4.4% Other race69 0.4% Two or more races26 4.4% White alone, not Hispanic / Latino259 0.8% Hispanic or LatinoMoved from different state 72 0.7% White / Caucasian1 1.0% Black or African American21 0.3% Other race99 0.3% Hispanic or LatinoMoved from abroad 29 0.3% White5 0.1% Other race19 0.1% Two or more races48 0.1% Hispanic or Latino
Children Nativity (place of birth) in Socorro
Children under 6 years - Living with two parents Both parents native 682 99.7% Native2 0.3% Foreign-bornBoth parents foreign-born 147 100.0% NativeOne native, one foreign-born parent 409 95.1% Native21 4.9% Foreign-bornChildren under 6 years - Living with one parent Native parent 842 99.1% Native7 0.9% Foreign-bornForeign-born parent 51 78.4% Native14 21.6% Foreign-bornChildren 6 to 17 years - Living with two parents Both parents native 1,248 99.2% Native10 0.8% Foreign-bornBoth parents foreign-born 1,006 85.8% Native166 14.2% Foreign-bornOne native, one foreign-born parent 1,641 98.9% Native18 1.1% Foreign-bornChildren 6 to 17 years - Living with one parent Native parent 1,558 100.0% NativeForeign-born parent 733 52.0% Native676 48.0% Foreign-born
Place of birth for residents in Socorro 11,985 Americas11,985 Latin America11,985 Central America96 Asia75 South Eastern Asia15 South Central Asia5 Eastern Asia5 China3 Europe3 Western Europe
Grandparents responsible for own grandchildren in Socorro
Grandparents (30 to 59 years) White / Caucasian 30 38.5% Responsible for grandchildren48 61.5% Not responsible for grandchildrenAmerican Indian / Alaska Native 6 45.3% Responsible for grandchildren7 54.7% Not responsible for grandchildrenOther race 21 100.0% Responsible for grandchildrenTwo or more races 143 35.2% Responsible for grandchildren263 64.8% Not responsible for grandchildrenHispanic or Latino 130 35.4% Responsible for grandchildren237 64.6% Not responsible for grandchildrenGrandparents (60 years and over) White / Caucasian 52 20.2% Responsible for grandchildren204 79.8% Not responsible for grandchildrenAmerican Indian / Alaska Native 49 100.0% Not responsible for grandchildrenOther race 50 19.9% Responsible for grandchildren201 80.1% Not responsible for grandchildrenTwo or more races 21 7.1% Responsible for grandchildren268 92.9% Not responsible for grandchildrenHispanic or Latino 161 19.5% Responsible for grandchildren666 80.5% Not responsible for grandchildren