Races in Silver Spring, Maryland (MD) Detailed Stats
Data:
Races - White alone (%)
Races - White alone (% change since 2000)
Races - Black alone (%)
Races - Black alone (% change since 2000)
Races - American Indian alone (%)
Races - American Indian alone (% change since 2000)
Races - Asian alone (%)
Races - Asian alone (% change since 2000)
Races - Hispanic (%)
Races - Hispanic (% change since 2000)
Races - Native Hawaiian and Other Pacific Islander alone (%)
Races - Native Hawaiian and Other Pacific Islander alone (% change since 2000)
Races - Two or more races(%)
Races - Two or more races(% change since 2000)
Races - Other race alone (%)
Races - Other race alone (% change since 2000)
Racial diversity
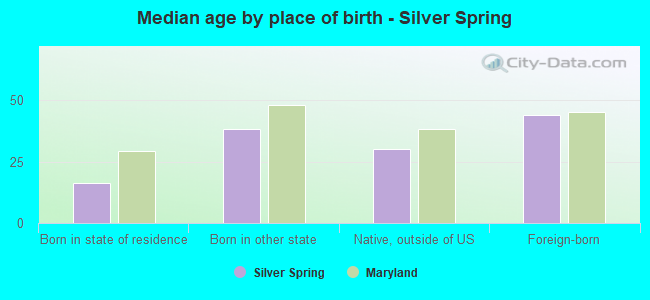
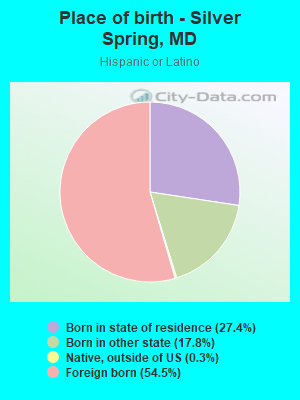
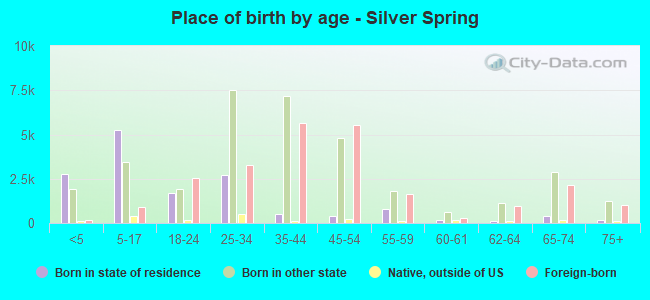
Place of birth - Born in state of residence (%)
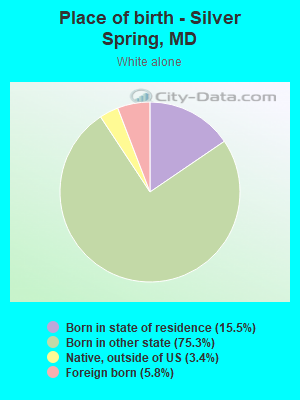
Place of birth - Born in state of residence (%) - White
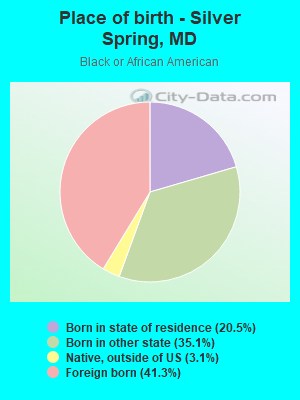
Place of birth - Born in state of residence (%) - Black or African American
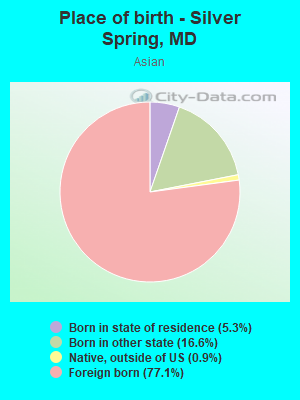
Place of birth - Born in state of residence (%) - Asian
Place of birth - Born in state of residence (%) - Hispanic or Latino
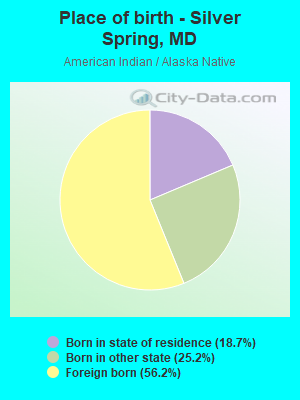
Place of birth - Born in state of residence (%) - American Indian and Alaska Native
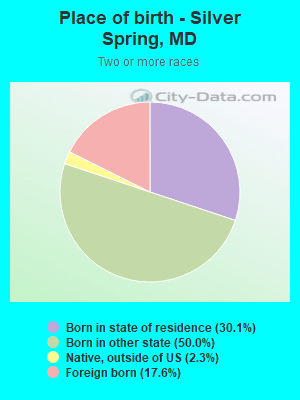
Place of birth - Born in state of residence (%) - Multirace
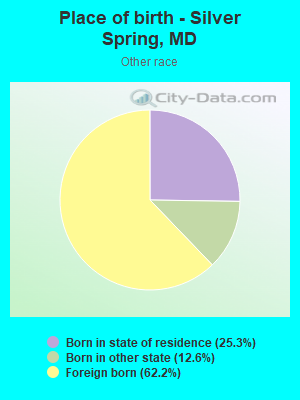
Place of birth - Born in state of residence (%) - Other Race
Place of birth - Born in other state (%)
Place of birth - Born in other state (%) - White
Place of birth - Born in other state (%) - Black or African American
Place of birth - Born in other state (%) - Asian
Place of birth - Born in other state (%) - Hispanic or Latino
Place of birth - Born in other state (%) - American Indian and Alaska Native
Place of birth - Born in other state (%) - Multirace
Place of birth - Born in other state (%) - Other Race
Place of birth - Native, outside of US (%)
Place of birth - Native, outside of US (%) - White
Place of birth - Native, outside of US (%) - Black or African American
Place of birth - Native, outside of US (%) - Asian
Place of birth - Native, outside of US (%) - Hispanic or Latino
Place of birth - Native, outside of US (%) - American Indian and Alaska Native
Place of birth - Native, outside of US (%) - Multirace
Place of birth - Native, outside of US (%) - Other Race
Place of birth - Foreign born (%)
Place of birth - Foreign born (%) - White
Place of birth - Foreign born (%) - Black or African American
Place of birth - Foreign born (%) - Asian
Place of birth - Foreign born (%) - Hispanic or Latino
Place of birth - Foreign born (%) - American Indian and Alaska Native
Place of birth - Foreign born (%) - Multirace
Place of birth - Foreign born (%) - Other Race
Residents speaking English at home (%)
Residents speaking English at home - Born in the United States (%)
Residents speaking English at home - Native, born elsewhere (%)
Residents speaking English at home - Foreign born (%)
Residents speaking Spanish at home (%)
Residents speaking Spanish at home - Born in the United States (%)
Residents speaking Spanish at home - Native, born elsewhere (%)
Residents speaking Spanish at home - Foreign born (%)
Residents speaking other language at home (%)
Residents speaking other language at home - Born in the United States (%)
Residents speaking other language at home - Native, born elsewhere (%)
Residents speaking other language at home - Foreign born (%)
Marital status - Never married (%)
Marital status - Now married (%)
Marital status - Separated (%)
Marital status - Widowed (%)
Marital status - Divorced (%)
Ancestries Reported - Arab (%)
Ancestries Reported - Czech (%)
Ancestries Reported - Danish (%)
Ancestries Reported - Dutch (%)
Ancestries Reported - English (%)
Ancestries Reported - French (%)
Ancestries Reported - French Canadian (%)
Ancestries Reported - German (%)
Ancestries Reported - Greek (%)
Ancestries Reported - Hungarian (%)
Ancestries Reported - Irish (%)
Ancestries Reported - Italian (%)
Ancestries Reported - Lithuanian (%)
Ancestries Reported - Norwegian (%)
Ancestries Reported - Polish (%)
Ancestries Reported - Portuguese (%)
Ancestries Reported - Russian (%)
Ancestries Reported - Scotch-Irish (%)
Ancestries Reported - Scottish (%)
Ancestries Reported - Slovak (%)
Ancestries Reported - Subsaharan African (%)
Ancestries Reported - Swedish (%)
Ancestries Reported - Swiss (%)
Ancestries Reported - Ukrainian (%)
Ancestries Reported - United States (%)
Ancestries Reported - Welsh (%)
Ancestries Reported - West Indian (%)
Ancestries Reported - Other (%)
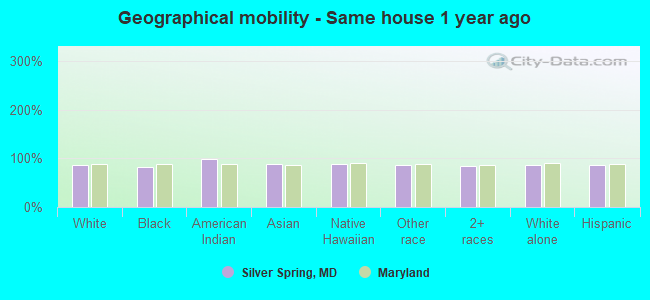
Geographical mobility - Same house 1 year ago (%)
Geographical mobility - Same house 1 year ago (%) - White
Geographical mobility - Same house 1 year ago (%) - Black or African American
Geographical mobility - Same house 1 year ago (%) - Asian
Geographical mobility - Same house 1 year ago (%) - Hispanic or Latino
Geographical mobility - Same house 1 year ago (%) - American Indian and Alaska Native
Geographical mobility - Same house 1 year ago (%) - Multirace
Geographical mobility - Same house 1 year ago (%) - Other Race
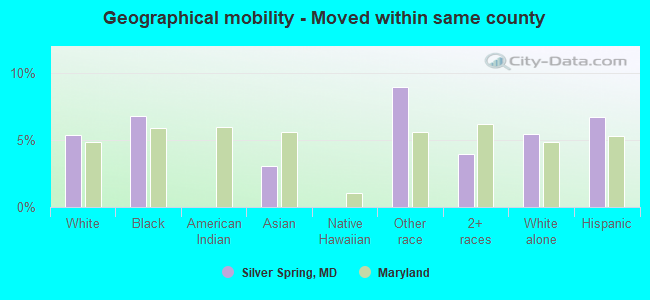
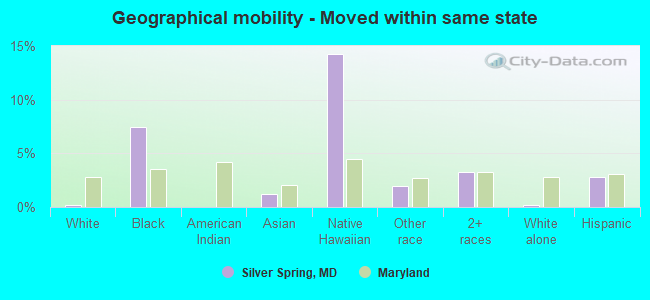
Geographical mobility - Moved within same county (%)
Geographical mobility - Moved within same county (%) - White
Geographical mobility - Moved within same county (%) - Black or African American
Geographical mobility - Moved within same county (%) - Asian
Geographical mobility - Moved within same county (%) - Hispanic or Latino
Geographical mobility - Moved within same county (%) - American Indian and Alaska Native
Geographical mobility - Moved within same county (%) - Multirace
Geographical mobility - Moved within same county (%) - Other Race
Geographical mobility - Moved from different county within same state (%)
Geographical mobility - Moved from different county within same state (%) - White
Geographical mobility - Moved from different county within same state (%) - Black or African American
Geographical mobility - Moved from different county within same state (%) - Asian
Geographical mobility - Moved from different county within same state (%) - Hispanic or Latino
Geographical mobility - Moved from different county within same state (%) - American Indian and Alaska Native
Geographical mobility - Moved from different county within same state (%) - Multirace
Geographical mobility - Moved from different county within same state (%) - Other Race
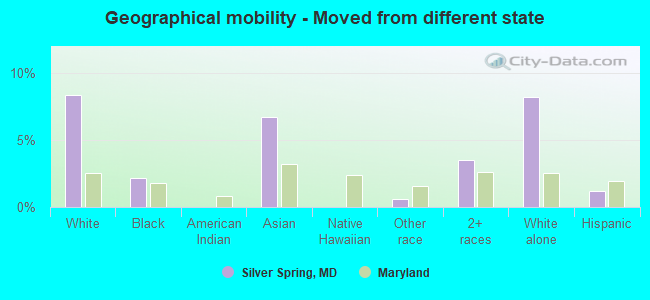
Geographical mobility - Moved from different state (%)
Geographical mobility - Moved from different state (%) - White
Geographical mobility - Moved from different state (%) - Black or African American
Geographical mobility - Moved from different state (%) - Asian
Geographical mobility - Moved from different state (%) - Hispanic or Latino
Geographical mobility - Moved from different state (%) - American Indian and Alaska Native
Geographical mobility - Moved from different state (%) - Multirace
Geographical mobility - Moved from different state (%) - Other Race
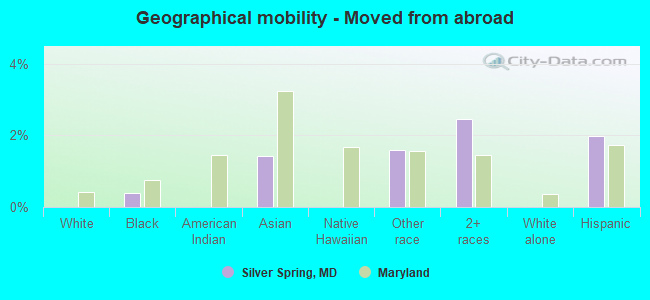
Geographical mobility - Moved from abroad (%)
Geographical mobility - Moved from abroad (%) - White
Geographical mobility - Moved from abroad (%) - Black or African American
Geographical mobility - Moved from abroad (%) - Asian
Geographical mobility - Moved from abroad (%) - Hispanic or Latino
Geographical mobility - Moved from abroad (%) - American Indian and Alaska Native
Geographical mobility - Moved from abroad (%) - Multirace
Geographical mobility - Moved from abroad (%) - Other Race
Place of birth for the foreign-born population - Ireland (%)
Place of birth for the foreign-born population - Denmark (%)
Place of birth for the foreign-born population - Norway (%)
Place of birth for the foreign-born population - Sweden (%)
Place of birth for the foreign-born population - United Kingdom (%)
Place of birth for the foreign-born population - England (%)
Place of birth for the foreign-born population - Scotland (%)
Place of birth for the foreign-born population - Other Northern Europe (%)
Place of birth for the foreign-born population - Austria (%)
Place of birth for the foreign-born population - Belgium (%)
Place of birth for the foreign-born population - France (%)
Place of birth for the foreign-born population - Germany (%)
Place of birth for the foreign-born population - Netherlands (%)
Place of birth for the foreign-born population - Switzerland (%)
Place of birth for the foreign-born population - Other Western Europe (%)
Place of birth for the foreign-born population - Greece (%)
Place of birth for the foreign-born population - Italy (%)
Place of birth for the foreign-born population - Portugal (%)
Place of birth for the foreign-born population - Spain (%)
Place of birth for the foreign-born population - Other Southern Europe (%)
Place of birth for the foreign-born population - Albania (%)
Place of birth for the foreign-born population - Belarus (%)
Place of birth for the foreign-born population - Bosnia and Herzegovina (%)
Place of birth for the foreign-born population - Bulgaria (%)
Place of birth for the foreign-born population - Croatia (%)
Place of birth for the foreign-born population - Czechoslovakia (%)
Place of birth for the foreign-born population - Hungary (%)
Place of birth for the foreign-born population - Latvia (%)
Place of birth for the foreign-born population - Lithuania (%)
Place of birth for the foreign-born population - North Macedonia (Macedonia) (%)
Place of birth for the foreign-born population - Moldova (%)
Place of birth for the foreign-born population - Poland (%)
Place of birth for the foreign-born population - Romania (%)
Place of birth for the foreign-born population - Russia (%)
Place of birth for the foreign-born population - Serbia (%)
Place of birth for the foreign-born population - Ukraine (%)
Place of birth for the foreign-born population - Other Eastern Europe (%)
Place of birth for the foreign-born population - China (%)
Place of birth for the foreign-born population - Hong Kong (%)
Place of birth for the foreign-born population - Taiwan (%)
Place of birth for the foreign-born population - Japan (%)
Place of birth for the foreign-born population - Korea (%)
Place of birth for the foreign-born population - Other Eastern Asia (%)
Place of birth for the foreign-born population - Afghanistan (%)
Place of birth for the foreign-born population - Bangladesh (%)
Place of birth for the foreign-born population - India (%)
Place of birth for the foreign-born population - Iran (%)
Place of birth for the foreign-born population - Kazakhstan (%)
Place of birth for the foreign-born population - Nepal (%)
Place of birth for the foreign-born population - Pakistan (%)
Place of birth for the foreign-born population - Sri Lanka (%)
Place of birth for the foreign-born population - Uzbekistan (%)
Place of birth for the foreign-born population - Other South Central Asia (%)
Place of birth for the foreign-born population - Burma (%)
Place of birth for the foreign-born population - Cambodia (%)
Place of birth for the foreign-born population - Indonesia (%)
Place of birth for the foreign-born population - Laos (%)
Place of birth for the foreign-born population - Malaysia (%)
Place of birth for the foreign-born population - Philippines (%)
Place of birth for the foreign-born population - Singapore (%)
Place of birth for the foreign-born population - Thailand (%)
Place of birth for the foreign-born population - Vietnam (%)
Place of birth for the foreign-born population - Other South Eastern Asia (%)
Place of birth for the foreign-born population - Armenia (%)
Place of birth for the foreign-born population - Iraq (%)
Place of birth for the foreign-born population - Israel (%)
Place of birth for the foreign-born population - Jordan (%)
Place of birth for the foreign-born population - Kuwait (%)
Place of birth for the foreign-born population - Lebanon (%)
Place of birth for the foreign-born population - Saudi Arabia (%)
Place of birth for the foreign-born population - Syria (%)
Place of birth for the foreign-born population - Turkey (%)
Place of birth for the foreign-born population - Yemen (%)
Place of birth for the foreign-born population - Other Western Asia (%)
Place of birth for the foreign-born population - Eritrea (%)
Place of birth for the foreign-born population - Ethiopia (%)
Place of birth for the foreign-born population - Kenya (%)
Place of birth for the foreign-born population - Somalia (%)
Place of birth for the foreign-born population - Uganda (%)
Place of birth for the foreign-born population - Zimbabwe (%)
Place of birth for the foreign-born population - Other Eastern Africa (%)
Place of birth for the foreign-born population - Cameroon (%)
Place of birth for the foreign-born population - Congo (%)
Place of birth for the foreign-born population - Democratic Republic of Congo (Zaire) (%)
Place of birth for the foreign-born population - Other Middle Africa (%)
Place of birth for the foreign-born population - Egypt (%)
Place of birth for the foreign-born population - Morocco (%)
Place of birth for the foreign-born population - Sudan (%)
Place of birth for the foreign-born population - Other Northern Africa (%)
Place of birth for the foreign-born population - South Africa (%)
Place of birth for the foreign-born population - Other Southern Africa (%)
Place of birth for the foreign-born population - Cabo Verde (%)
Place of birth for the foreign-born population - Ghana (%)
Place of birth for the foreign-born population - Liberia (%)
Place of birth for the foreign-born population - Nigeria (%)
Place of birth for the foreign-born population - Senegal (%)
Place of birth for the foreign-born population - Sierra Leone (%)
Place of birth for the foreign-born population - Other Western Africa (%)
Place of birth for the foreign-born population - Australia (%)
Place of birth for the foreign-born population - New Zealand (%)
Place of birth for the foreign-born population - Fiji (%)
Place of birth for the foreign-born population - Micronesia (%)
Place of birth for the foreign-born population - Bahamas (%)
Place of birth for the foreign-born population - Barbados (%)
Place of birth for the foreign-born population - Cuba (%)
Place of birth for the foreign-born population - Dominica (%)
Place of birth for the foreign-born population - Dominican Republic (%)
Place of birth for the foreign-born population - Grenada (%)
Place of birth for the foreign-born population - Haiti (%)
Place of birth for the foreign-born population - Jamaica (%)
Place of birth for the foreign-born population - St. Vincent and the Grenadines (%)
Place of birth for the foreign-born population - Trinidad and Tobago (%)
Place of birth for the foreign-born population - West Indies (%)
Place of birth for the foreign-born population - Other Caribbean (%)
Place of birth for the foreign-born population - Belize (%)
Place of birth for the foreign-born population - Costa Rica (%)
Place of birth for the foreign-born population - El Salvador (%)
Place of birth for the foreign-born population - Guatemala (%)
Place of birth for the foreign-born population - Honduras (%)
Place of birth for the foreign-born population - Mexico (%)
Place of birth for the foreign-born population - Nicaragua (%)
Place of birth for the foreign-born population - Panama (%)
Place of birth for the foreign-born population - Other Central America (%)
Place of birth for the foreign-born population - Argentina (%)
Place of birth for the foreign-born population - Bolivia (%)
Place of birth for the foreign-born population - Brazil (%)
Place of birth for the foreign-born population - Chile (%)
Place of birth for the foreign-born population - Colombia (%)
Place of birth for the foreign-born population - Ecuador (%)
Place of birth for the foreign-born population - Guyana (%)
Place of birth for the foreign-born population - Peru (%)
Place of birth for the foreign-born population - Uruguay (%)
Place of birth for the foreign-born population - Venezuela (%)
Place of birth for the foreign-born population - Other South America (%)
Place of birth for the foreign-born population - Canada (%)
Place of birth for the foreign-born population - Other Northern America (%)
Place of birth for the foreign-born population - Other (%)
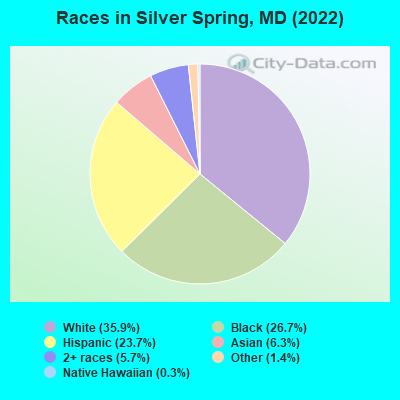
According to 2022 data, the most numerous races in Silver Spring, MD are White alone (27,030 residents), Black alone (20,084 residents), and Hispanic (17,877 residents). 59.2% of Silver Spring residents speak English at home. 35.4% of Silver Spring, MD residents are foreign-born (14.2% born in Latin America, 11.0% born in Africa, 6.5% born in Asia), which is 54.8% greater than the foreign-born rate of 16.0% across the entire state of Maryland.
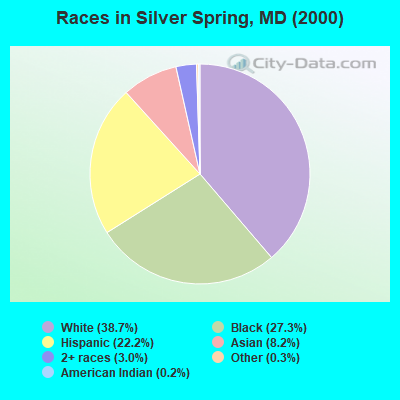
Race distribution in Silver Spring
2000 2022
29,617 38.7% White alone 20,901 27.3% Black alone 17,004 22.2% Hispanic 6,244 8.2% Asian alone 2,319 3.0% Two or more races 236 0.3% Other race alone 186 0.2% American Indian alone 33 0.04% Native Hawaiian and Other
27,030 35.9% White alone 20,084 26.7% Black alone 17,877 23.7% Hispanic 4,742 6.3% Asian alone 4,267 5.7% Two or more races 1,071 1.4% Other race alone 205 0.3% Native Hawaiian and Other 37 0.05% American Indian alone
2000 2022
3,286,547 62.1% White alone 1,464,735 27.7% Black alone 227,916 4.3% Hispanic 209,738 4.0% Asian alone 82,946 1.6% Two or more races 13,312 0.3% American Indian alone 9,379 0.2% Other race alone 1,913 0.04% Native Hawaiian and Other
2,906,492 47.1% White alone 1,800,914 29.2% Black alone 705,842 11.4% Hispanic 401,818 6.5% Asian alone 291,317 4.7% Two or more races 46,930 0.8% Other race alone 8,930 0.1% American Indian alone 2,417 0.04% Native Hawaiian and Other
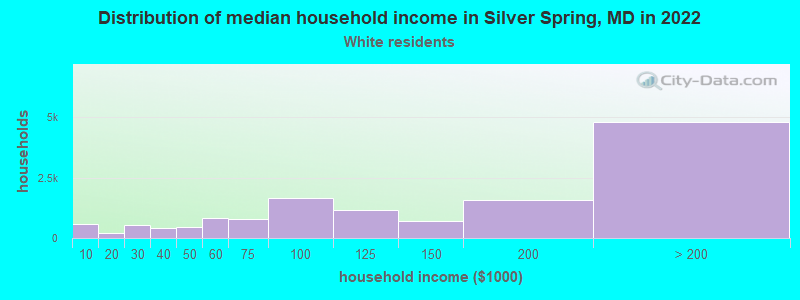
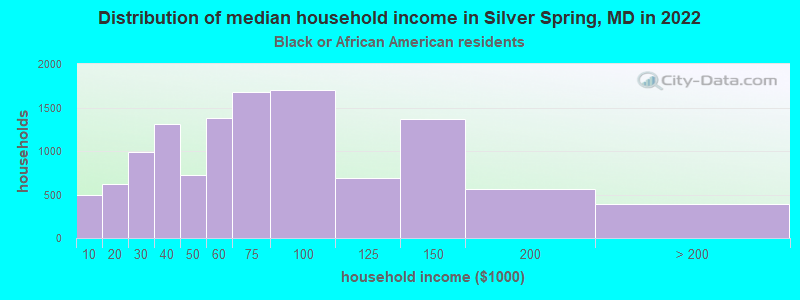
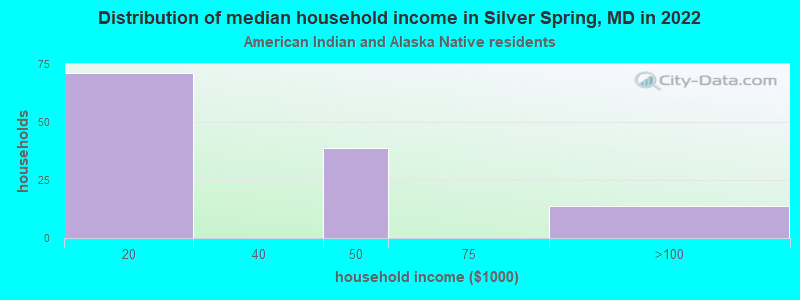
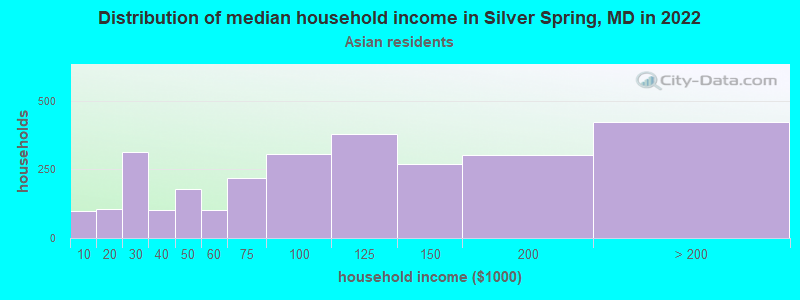
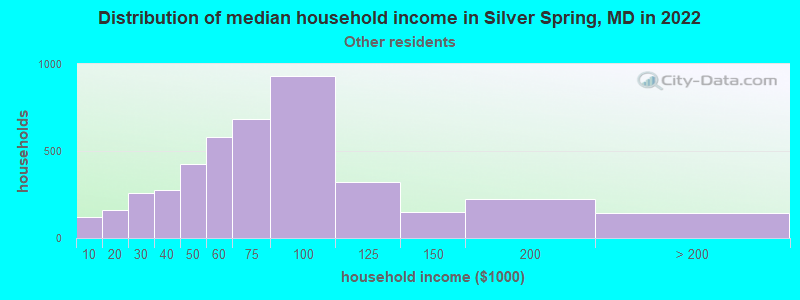
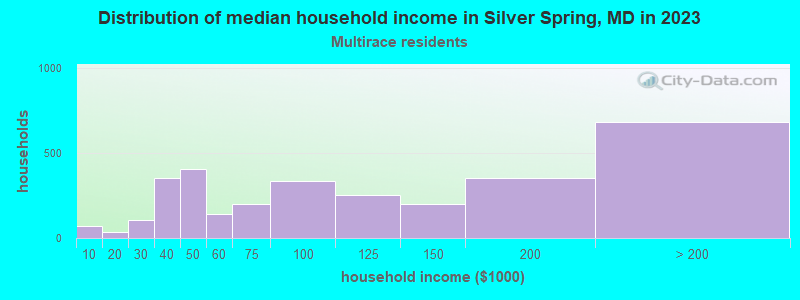
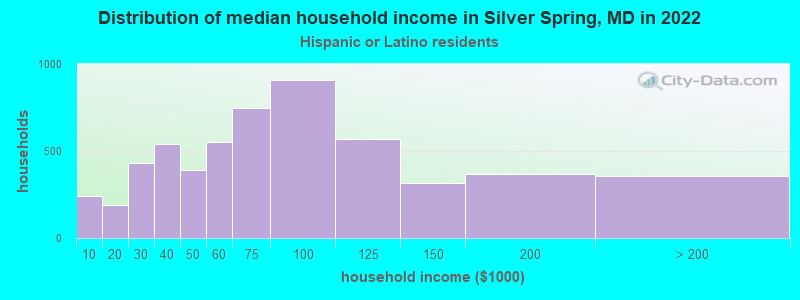
Income and house value in Silver Spring Median household income in 2022 $130,885 White non-Hispanic householders$63,068 Black householders$58,942 Asian householders$72,366 Some other race householders$79,659 Two or more races householders$70,551 Hispanic or Latino race householdersMedian 2022 house value $656,802 White Non-Hispanic householders$594,973 Black or African American householders$534,158 American Indian or Alaska Native householders $562,201 Asian householders$464,559 Native Hawaiian and other Pacific Islander householders$548,011 Some other race householders$578,756 Two or more races householders$544,294 Hispanic or Latino householders
Median age by race in Silver Spring
37.1 Median age for White residents39.9 35.4 36.8 Median age for Black or African American residents36.5 37.8 22.3 Median age for American Indian / Alaska Native residents22.4 -666,666,666.0 46.2 Median age for Asian residents43.1 46.6 -666,666,666.0 Median age for Native Hawaiian / Pacific Islander residents-666,666,666.0 -666,666,666.0 34.5 Median age for Other race residents34.7 33.8 29.0 Median age for Two or more races residents26.7 36.5 37.5 Median age for White alone residents40.4 35.5 33.4 Median age for Hispanic or Latino residents33.3 33.5
Owner/renter occupied households by race in Silver Spring
House owners and renters - White residents 8,380 61.2% Owner occupied5,322 38.8% Renter occupiedHouse owners and renters - Black or African American residents 1,905 16.0% Owner occupied10,013 84.0% Renter occupiedHouse owners and renters - American Indian / Alaska Native residents 69 67.7% Owner occupied33 32.3% Renter occupiedHouse owners and renters - Asian residents 984 59.1% Owner occupied680 40.9% Renter occupiedHouse owners and renters - Native Hawaiian / Pacific Islander residents 122 100.0% Renter occupiedHouse owners and renters - Other race residents 1,065 24.6% Owner occupied3,265 75.4% Renter occupiedHouse owners and renters - Two or more races residents 795 28.1% Owner occupied2,030 71.9% Renter occupiedHouse owners and renters - White alone residents 8,309 61.2% Owner occupied5,266 38.8% Renter occupiedHouse owners and renters - Hispanic or Latino residents 1,619 29.0% Owner occupied3,966 71.0% Renter occupied
Language usage in Silver Spring
English speakers - Total 59.2% of residents of Silver Spring speak English at home.
20.9% of residents speak Spanish at home 7,140 48.4% Speak English very well7,617 51.6% Speak English less than very well19.8% of residents speak other language at home 9,016 64.5% Speak English very well4,957 35.5% Speak English less than very well
English speakers - Born in the United States 89.4% of residents of Silver Spring speak English at home.
5.4% of residents speak Spanish at home 1,687 95.5% Speak English very well79 4.5% Speak English less than very well5.2% of residents speak other language at home 1,624 96.0% Speak English very well67 4.0% Speak English less than very well
English speakers - Native, born elsewhere 81.8% of residents of Silver Spring speak English at home.
2.8% of residents speak Spanish at home 49 100.0% Speak English very well15.4% of residents speak other language at home 200 74.6% Speak English very well68 25.4% Speak English less than very well
English speakers - Foreign-born 13.1% of residents of Silver Spring speak English at home.
41.0% of residents speak Spanish at home 2,540 25.8% Speak English very well7,296 74.2% Speak English less than very well45.9% of residents speak other language at home 6,371 57.8% Speak English very well4,645 42.2% Speak English less than very well
White (Caucasian) - Speak only English Native:
96.1% (23,423)Foreign-born:
29.7% (480)
White (Caucasian) - Speak another language Native:
3.9% (960)Foreign-born:
70.3% (1,137)
Black or African American - Speak only English Native:
89.1% (9,696)Foreign-born:
14.1% (1,211)
Black or African American - Speak another language Native:
10.9% (1,184)Foreign-born:
85.9% (7,407)
American Indian / Alaska Native - Speak only English Native:
27.0% (52)Foreign-born:
26.8% (45)
American Indian / Alaska Native - Speak another language Native:
88.7% (170)Foreign-born:
70.9% (119)
Asian - Speak only English Native:
70.5% (765)Foreign-born:
15.0% (526)
Asian - Speak another language Native:
29.5% (320)Foreign-born:
85.0% (2,984)
Other race - Speak only English Native:
20.7% (953)Foreign-born:
3.4% (305)
Other race - Speak another language Native:
79.3% (3,640)Foreign-born:
96.6% (8,561)
Two or more races - Speak only English Native:
71.1% (3,704)Foreign-born:
46.1% (612)
Two or more races - Speak another language Native:
28.9% (1,504)Foreign-born:
53.9% (716)
White alone - Speak only English Native:
96.8% (23,253)Foreign-born:
30.4% (480)
White alone - Speak another language Native:
3.2% (780)Foreign-born:
69.6% (1,098)
Hispanic or Latino - Speak only English Native:
32.2% (2,152)Foreign-born:
1.3% (128)
Hispanic or Latino - Speak another language Native:
67.8% (4,539)Foreign-born:
98.7% (9,616)
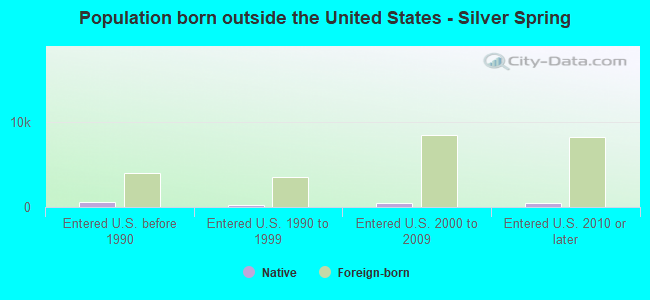
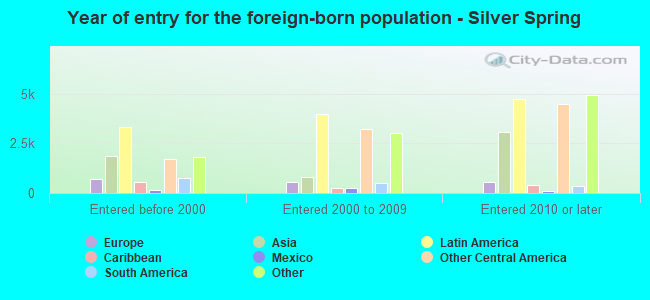
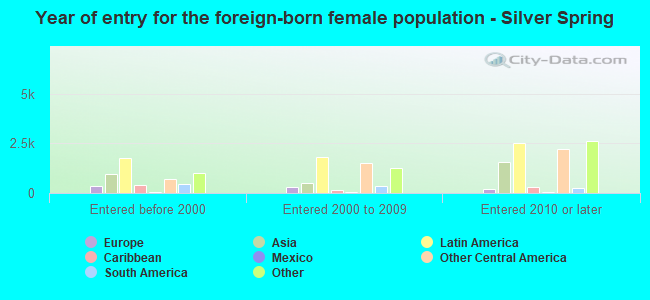
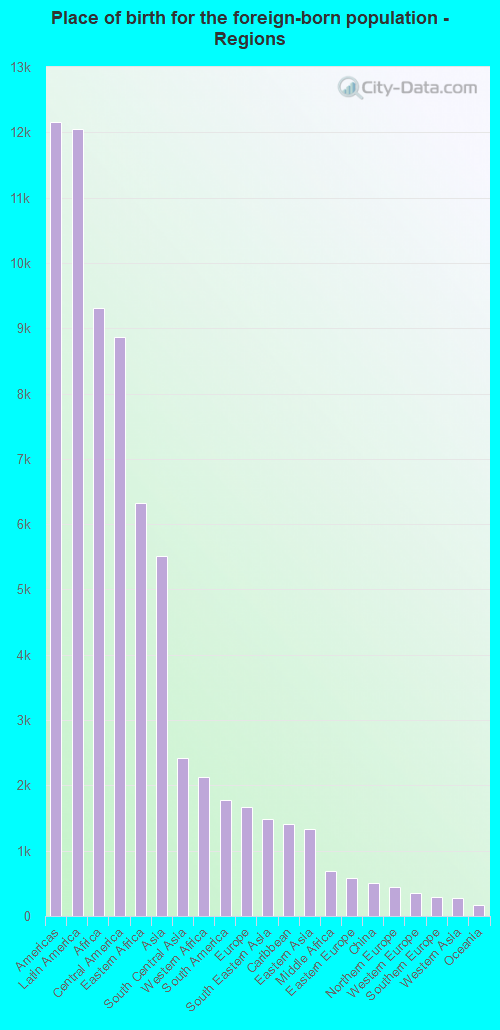
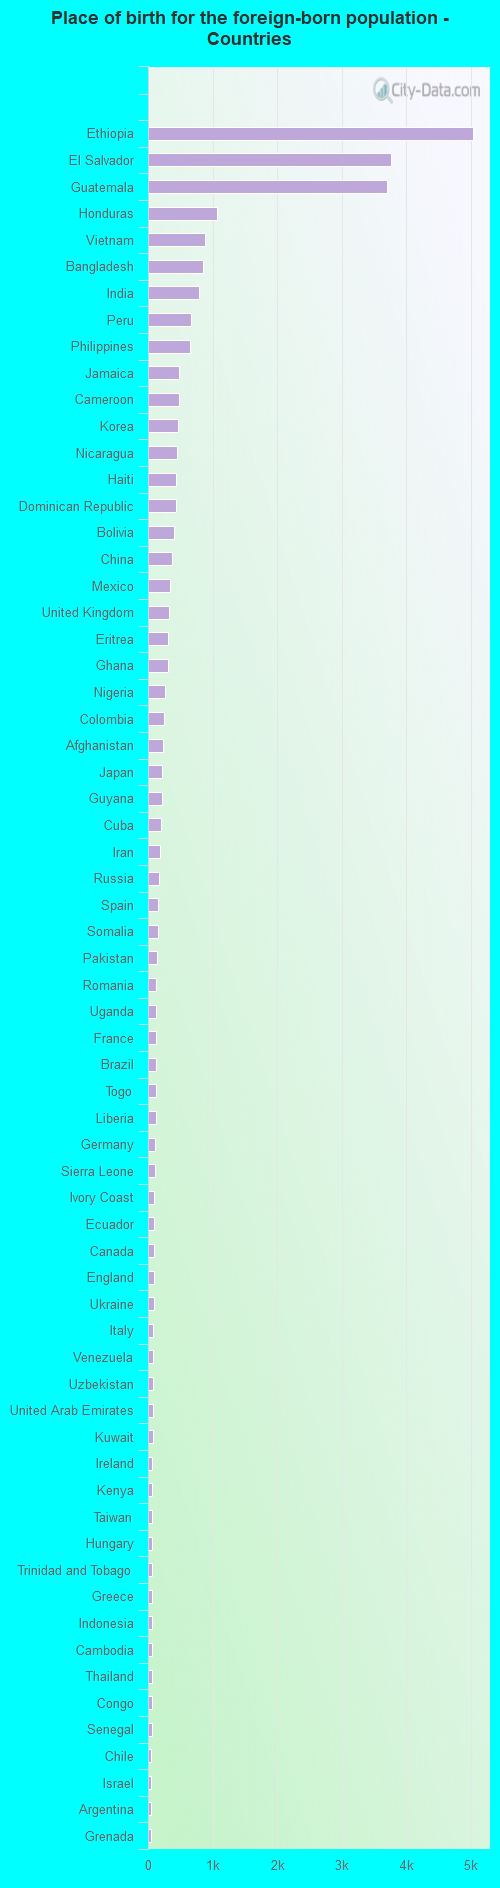
Foreign-born residents in Silver Spring 28,820 residents are foreign born (14.2% Latin America , 11.0% Africa , 6.5% Asia ).
This city:
35.4%Maryland:
15.7%
Marital status for residents in Silver Spring Marital status - White (Caucasian) population 15 years and over
Males 35.0% Never married51.7% Now married3.4% Separated1.6% Widowed8.3% DivorcedFemales 37.2% Never married48.7% Now married0.0% Separated5.7% Widowed8.3% DivorcedWomen who gave birth in the past 12 months Now married:
100.0% (444)Unmarried:
0.0% (0)
Women who did not give birth in the past 12 months Now married:
44.7% (3,346)Unmarried:
55.3% (4,144)
Marital status - Black or African American population 15 years and over
Males 43.1% Never married46.6% Now married1.0% Separated0.6% Widowed8.7% DivorcedFemales 56.8% Never married21.7% Now married3.2% Separated3.6% Widowed14.7% DivorcedWomen who gave birth in the past 12 months Now married:
78.0% (252)Unmarried:
22.0% (71)
Women who did not give birth in the past 12 months Now married:
22.7% (1,647)Unmarried:
77.3% (5,600)
Marital status - American Indian / Alaska Native population 15 years and over
Males 73.6% Never married26.4% Now married0.0% Separated0.0% Widowed0.0% DivorcedFemales 36.8% Never married38.3% Now married0.0% Separated0.0% Widowed24.8% DivorcedWomen who did not give birth in the past 12 months Now married:
15.4% (18)Unmarried:
84.6% (99)
Marital status - Asian population 15 years and over
Males 38.0% Never married56.0% Now married0.0% Separated2.4% Widowed3.6% DivorcedFemales 35.8% Never married49.4% Now married0.8% Separated4.3% Widowed9.8% DivorcedWomen who gave birth in the past 12 months Now married:
100.0% (30)Unmarried:
0.0% (0)
Women who did not give birth in the past 12 months Now married:
44.1% (1,050)Unmarried:
55.9% (1,328)
Marital status - Native Hawaiian / Pacific Islander population 15 years and over
Males 100.0% Never married0.0% Now married0.0% Separated0.0% Widowed0.0% DivorcedFemales 0.0% Never married0.0% Now married0.0% Separated0.0% Widowed100.0% DivorcedWomen who did not give birth in the past 12 months Now married:
0.0% (0)Unmarried:
100.0% (15)
Marital status - Other race population 15 years and over
Males 55.4% Never married36.7% Now married3.4% Separated1.8% Widowed2.7% DivorcedFemales 45.4% Never married34.0% Now married4.4% Separated6.0% Widowed10.3% DivorcedWomen who gave birth in the past 12 months Now married:
9.9% (27)Unmarried:
90.1% (245)
Women who did not give birth in the past 12 months Now married:
40.8% (1,424)Unmarried:
59.2% (2,067)
Marital status - Two or more races population 15 years and over
Males 48.8% Never married44.2% Now married1.6% Separated0.5% Widowed4.8% DivorcedFemales 55.2% Never married33.0% Now married2.0% Separated3.6% Widowed6.2% DivorcedWomen who did not give birth in the past 12 months Now married:
30.3% (700)Unmarried:
69.7% (1,611)
Marital status - White alone, not Hispanic / Latino population 15 years and over
Males 35.0% Never married51.5% Now married3.4% Separated1.6% Widowed8.4% DivorcedFemales 37.1% Never married48.7% Now married0.0% Separated5.8% Widowed8.4% DivorcedWomen who gave birth in the past 12 months Now married:
100.0% (444)Unmarried:
0.0% (0)
Women who did not give birth in the past 12 months Now married:
44.6% (3,307)Unmarried:
55.4% (4,102)
Marital status - Hispanic or Latino population 15 years and over
Males 66.2% Never married26.1% Now married5.0% Separated0.0% Widowed2.8% DivorcedFemales 46.1% Never married34.8% Now married4.1% Separated0.9% Widowed14.1% DivorcedWomen who gave birth in the past 12 months Now married:
12.1% (30)Unmarried:
87.9% (217)
Women who did not give birth in the past 12 months Now married:
38.5% (1,775)Unmarried:
61.5% (2,839)
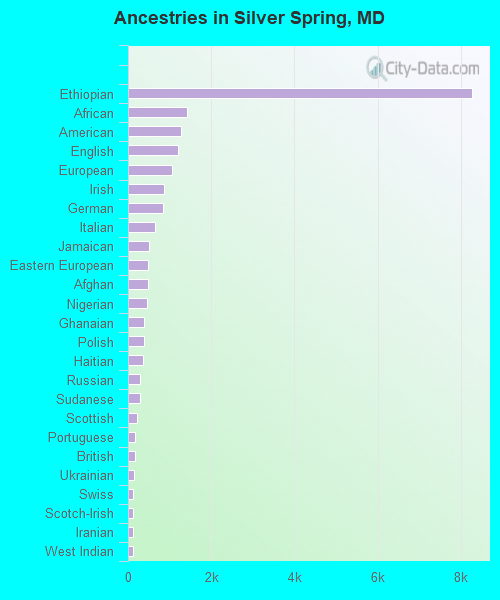
Ancestries in Silver Spring
8,264 16.1% Ethiopian1,423 2.8% African1,270 2.5% American1,191 2.3% English1,055 2.1% European869 1.7% Irish837 1.6% German644 1.3% Italian504 1.0% Jamaican470 0.9% Eastern European469 0.9% Afghan458 0.9% Nigerian379 0.7% Ghanaian376 0.7% Polish364 0.7% Haitian293 0.6% Russian284 0.6% Sudanese227 0.4% Scottish168 0.3% Portuguese161 0.3% British147 0.3% Ukrainian127 0.2% Swiss122 0.2% Scotch-Irish121 0.2% Iranian120 0.2% West Indian113 0.2% Latvian101 0.2% Ugandan92 0.2% French87 0.2% Romanian77 0.1% Greek77 0.1% Liberian70 0.1% Czech67 0.1% Finnish62 0.1% Bahamian62 0.1% Sierra Leonean60 0.1% Guyanese58 0.1% Northern European58 0.1% Moroccan54 0.1% Swedish53 0.1% Norwegian47 0.09% British West Indian46 0.09% Lebanese43 0.08% Slovak36 0.07% Dutch35 0.07% Iraqi30 0.06% Jordanian28 0.05% French Canadian28 0.05% Kenyan27 0.05% Turkish27 0.05% Slavic23 0.04% Serbian23 0.04% Austrian22 0.04% Canadian20 0.04% Bulgarian18 0.04% Danish18 0.04% Trinidadian and Tobagonian17 0.03% Senegalese17 0.03% Czechoslovakian16 0.03% Lithuanian14 0.03% German Russian13 0.03% Egyptian8 0.02% Welsh7 0.01% Brazilian7 0.01% Hungarian6 0.01% Croatian6 0.01% Scandinavian
Geographical mobility in Silver Spring Same house 1 year ago 23,107 86.1% White (Caucasian)17,234 83.2% Black or African American457 98.9% American Indian / Alaska Native4,155 87.6% Asian96 87.3% Native Hawaiian / Pacific Islander13,379 86.7% Other race6,901 85.2% Two or more races22,789 86.1% White alone, not Hispanic / Latino16,776 87.3% Hispanic or LatinoMoved within same county 1,448 5.4% White / Caucasian1,408 6.8% Black or African American144 3.0% Asian1,381 9.0% Other race322 4.0% Two or more races1,448 5.5% White alone, not Hispanic / Latino1,286 6.7% Hispanic or LatinoMoved within same state 57 0.2% White / Caucasian1,550 7.5% Black or African American59 1.2% Asian16 14.2% Native Hawaiian / Pacific Islander301 2.0% Other race262 3.2% Two or more races57 0.2% White alone, not Hispanic / Latino533 2.8% Hispanic or LatinoMoved from different state 2,236 8.3% White / Caucasian447 2.2% Black or African American317 6.7% Asian91 0.6% Other race281 3.5% Two or more races2,165 8.2% White alone, not Hispanic / Latino233 1.2% Hispanic or LatinoMoved from abroad 82 0.4% Black or African American67 1.4% Asian248 1.6% Other race199 2.5% Two or more races381 2.0% Hispanic or Latino
Children Nativity (place of birth) in Silver Spring
Children under 6 years - Living with two parents Both parents native 2,164 100.0% NativeBoth parents foreign-born 879 85.7% Native147 14.3% Foreign-bornOne native, one foreign-born parent 966 100.0% NativeChildren under 6 years - Living with one parent Native parent 975 100.0% NativeForeign-born parent 617 100.0% NativeChildren 6 to 17 years - Living with two parents Both parents native 3,117 97.0% Native96 3.0% Foreign-bornBoth parents foreign-born 1,888 76.8% Native571 23.2% Foreign-bornOne native, one foreign-born parent 773 100.0% NativeChildren 6 to 17 years - Living with one parent Native parent 1,300 100.0% NativeForeign-born parent 1,128 55.2% Native915 44.8% Foreign-born
Place of birth for residents in Silver Spring 12,160 Americas12,051 Latin America9,310 Africa8,870 Central America6,319 Eastern Africa5,514 Asia2,419 South Central Asia2,129 Western Africa1,777 South America1,672 Europe1,488 South Eastern Asia1,404 Caribbean1,329 Eastern Asia683 Middle Africa589 Eastern Europe502 China441 Northern Europe354 Western Europe286 Southern Europe277 Western Asia162 Oceania109 Northern America55 Australia and New Zealand Subregion28 Northern Africa18 Southern Africa5,532 Ethiopia3,744 El Salvador3,231 Guatemala995 Vietnam893 Bangladesh878 Honduras774 India692 Ghana555 Cameroon552 Korea527 Peru497 Mexico460 Nicaragua412 China407 Jamaica403 Colombia381 Nigeria376 Afghanistan374 Philippines369 Dominican Republic302 United Kingdom302 Bolivia281 Eritrea274 Japan234 Haiti179 Uganda166 Guyana157 Liberia157 Iran153 Germany145 Latvia142 Pakistan137 Spain136 Cuba136 France124 Brazil124 Russia116 Togo115 Romania112 Ecuador109 Canada106 Fiji105 Ivory Coast104 Somalia104 Kenya99 Trinidad and Tobago94 Chile91 Italy90 Sierra Leone84 England73 Kuwait66 Taiwan66 United Arab Emirates64 Sri Lanka57 Hungary57 Israel55 Australia50 Senegal49 Jordan46 Argentina46 Grenada44 Bahamas44 Indonesia43 Thailand41 Greece37 Ireland37 Austria33 Congo30 Cambodia30 Costa Rica28 Sudan28 Panama27 Serbia27 Poland27 Democratic Republic of Congo (Zaire)27 Switzerland24 Czechoslovakia23 Hong Kong18 Bulgaria18 St. Lucia17 Turkey16 Ukraine13 Scotland12 Iraq11 South Africa11 Lithuania11 Croatia10 Uzbekistan
Grandparents responsible for own grandchildren in Silver Spring
Grandparents (30 to 59 years) White / Caucasian 5 9.2% Responsible for grandchildren51 90.8% Not responsible for grandchildrenBlack or African American 9 10.0% Responsible for grandchildren83 90.0% Not responsible for grandchildrenAmerican Indian / Alaska Native 15 100.0% Responsible for grandchildrenAsian 25 100.0% Responsible for grandchildrenOther race 60 100.0% Not responsible for grandchildrenTwo or more races 9 100.0% Not responsible for grandchildrenWhite alone, not Hispanic / Latino 5 100.0% Responsible for grandchildrenHispanic or Latino 105 100.0% Not responsible for grandchildrenGrandparents (60 years and over) White / Caucasian 57 43.3% Responsible for grandchildren74 56.7% Not responsible for grandchildrenBlack or African American 96 38.6% Responsible for grandchildren153 61.4% Not responsible for grandchildrenAsian 21 12.2% Responsible for grandchildren150 87.8% Not responsible for grandchildrenOther race 127 39.3% Responsible for grandchildren196 60.7% Not responsible for grandchildrenTwo or more races 15 41.1% Responsible for grandchildren22 58.9% Not responsible for grandchildrenWhite alone, not Hispanic / Latino 46 38.4% Responsible for grandchildren74 61.6% Not responsible for grandchildrenHispanic or Latino 221 55.2% Responsible for grandchildren179 44.8% Not responsible for grandchildren