Races in Schertz, Texas (TX) Detailed Stats
Data:
Races - White alone (%)
Races - White alone (% change since 2000)
Races - Black alone (%)
Races - Black alone (% change since 2000)
Races - American Indian alone (%)
Races - American Indian alone (% change since 2000)
Races - Asian alone (%)
Races - Asian alone (% change since 2000)
Races - Hispanic (%)
Races - Hispanic (% change since 2000)
Races - Native Hawaiian and Other Pacific Islander alone (%)
Races - Native Hawaiian and Other Pacific Islander alone (% change since 2000)
Races - Two or more races(%)
Races - Two or more races(% change since 2000)
Races - Other race alone (%)
Races - Other race alone (% change since 2000)
Racial diversity
Place of birth - Born in state of residence (%)
Place of birth - Born in state of residence (%) - White
Place of birth - Born in state of residence (%) - Black or African American
Place of birth - Born in state of residence (%) - Asian
Place of birth - Born in state of residence (%) - Hispanic or Latino
Place of birth - Born in state of residence (%) - American Indian and Alaska Native
Place of birth - Born in state of residence (%) - Multirace
Place of birth - Born in state of residence (%) - Other Race
Place of birth - Born in other state (%)
Place of birth - Born in other state (%) - White
Place of birth - Born in other state (%) - Black or African American
Place of birth - Born in other state (%) - Asian
Place of birth - Born in other state (%) - Hispanic or Latino
Place of birth - Born in other state (%) - American Indian and Alaska Native
Place of birth - Born in other state (%) - Multirace
Place of birth - Born in other state (%) - Other Race
Place of birth - Native, outside of US (%)
Place of birth - Native, outside of US (%) - White
Place of birth - Native, outside of US (%) - Black or African American
Place of birth - Native, outside of US (%) - Asian
Place of birth - Native, outside of US (%) - Hispanic or Latino
Place of birth - Native, outside of US (%) - American Indian and Alaska Native
Place of birth - Native, outside of US (%) - Multirace
Place of birth - Native, outside of US (%) - Other Race
Place of birth - Foreign born (%)
Place of birth - Foreign born (%) - White
Place of birth - Foreign born (%) - Black or African American
Place of birth - Foreign born (%) - Asian
Place of birth - Foreign born (%) - Hispanic or Latino
Place of birth - Foreign born (%) - American Indian and Alaska Native
Place of birth - Foreign born (%) - Multirace
Place of birth - Foreign born (%) - Other Race
Residents speaking English at home (%)
Residents speaking English at home - Born in the United States (%)
Residents speaking English at home - Native, born elsewhere (%)
Residents speaking English at home - Foreign born (%)
Residents speaking Spanish at home (%)
Residents speaking Spanish at home - Born in the United States (%)
Residents speaking Spanish at home - Native, born elsewhere (%)
Residents speaking Spanish at home - Foreign born (%)
Residents speaking other language at home (%)
Residents speaking other language at home - Born in the United States (%)
Residents speaking other language at home - Native, born elsewhere (%)
Residents speaking other language at home - Foreign born (%)
Marital status - Never married (%)
Marital status - Now married (%)
Marital status - Separated (%)
Marital status - Widowed (%)
Marital status - Divorced (%)
Ancestries Reported - Arab (%)
Ancestries Reported - Czech (%)
Ancestries Reported - Danish (%)
Ancestries Reported - Dutch (%)
Ancestries Reported - English (%)
Ancestries Reported - French (%)
Ancestries Reported - French Canadian (%)
Ancestries Reported - German (%)
Ancestries Reported - Greek (%)
Ancestries Reported - Hungarian (%)
Ancestries Reported - Irish (%)
Ancestries Reported - Italian (%)
Ancestries Reported - Lithuanian (%)
Ancestries Reported - Norwegian (%)
Ancestries Reported - Polish (%)
Ancestries Reported - Portuguese (%)
Ancestries Reported - Russian (%)
Ancestries Reported - Scotch-Irish (%)
Ancestries Reported - Scottish (%)
Ancestries Reported - Slovak (%)
Ancestries Reported - Subsaharan African (%)
Ancestries Reported - Swedish (%)
Ancestries Reported - Swiss (%)
Ancestries Reported - Ukrainian (%)
Ancestries Reported - United States (%)
Ancestries Reported - Welsh (%)
Ancestries Reported - West Indian (%)
Ancestries Reported - Other (%)
Geographical mobility - Same house 1 year ago (%)
Geographical mobility - Same house 1 year ago (%) - White
Geographical mobility - Same house 1 year ago (%) - Black or African American
Geographical mobility - Same house 1 year ago (%) - Asian
Geographical mobility - Same house 1 year ago (%) - Hispanic or Latino
Geographical mobility - Same house 1 year ago (%) - American Indian and Alaska Native
Geographical mobility - Same house 1 year ago (%) - Multirace
Geographical mobility - Same house 1 year ago (%) - Other Race
Geographical mobility - Moved within same county (%)
Geographical mobility - Moved within same county (%) - White
Geographical mobility - Moved within same county (%) - Black or African American
Geographical mobility - Moved within same county (%) - Asian
Geographical mobility - Moved within same county (%) - Hispanic or Latino
Geographical mobility - Moved within same county (%) - American Indian and Alaska Native
Geographical mobility - Moved within same county (%) - Multirace
Geographical mobility - Moved within same county (%) - Other Race
Geographical mobility - Moved from different county within same state (%)
Geographical mobility - Moved from different county within same state (%) - White
Geographical mobility - Moved from different county within same state (%) - Black or African American
Geographical mobility - Moved from different county within same state (%) - Asian
Geographical mobility - Moved from different county within same state (%) - Hispanic or Latino
Geographical mobility - Moved from different county within same state (%) - American Indian and Alaska Native
Geographical mobility - Moved from different county within same state (%) - Multirace
Geographical mobility - Moved from different county within same state (%) - Other Race
Geographical mobility - Moved from different state (%)
Geographical mobility - Moved from different state (%) - White
Geographical mobility - Moved from different state (%) - Black or African American
Geographical mobility - Moved from different state (%) - Asian
Geographical mobility - Moved from different state (%) - Hispanic or Latino
Geographical mobility - Moved from different state (%) - American Indian and Alaska Native
Geographical mobility - Moved from different state (%) - Multirace
Geographical mobility - Moved from different state (%) - Other Race
Geographical mobility - Moved from abroad (%)
Geographical mobility - Moved from abroad (%) - White
Geographical mobility - Moved from abroad (%) - Black or African American
Geographical mobility - Moved from abroad (%) - Asian
Geographical mobility - Moved from abroad (%) - Hispanic or Latino
Geographical mobility - Moved from abroad (%) - American Indian and Alaska Native
Geographical mobility - Moved from abroad (%) - Multirace
Geographical mobility - Moved from abroad (%) - Other Race
Place of birth for the foreign-born population - Ireland (%)
Place of birth for the foreign-born population - Denmark (%)
Place of birth for the foreign-born population - Norway (%)
Place of birth for the foreign-born population - Sweden (%)
Place of birth for the foreign-born population - United Kingdom (%)
Place of birth for the foreign-born population - England (%)
Place of birth for the foreign-born population - Scotland (%)
Place of birth for the foreign-born population - Other Northern Europe (%)
Place of birth for the foreign-born population - Austria (%)
Place of birth for the foreign-born population - Belgium (%)
Place of birth for the foreign-born population - France (%)
Place of birth for the foreign-born population - Germany (%)
Place of birth for the foreign-born population - Netherlands (%)
Place of birth for the foreign-born population - Switzerland (%)
Place of birth for the foreign-born population - Other Western Europe (%)
Place of birth for the foreign-born population - Greece (%)
Place of birth for the foreign-born population - Italy (%)
Place of birth for the foreign-born population - Portugal (%)
Place of birth for the foreign-born population - Spain (%)
Place of birth for the foreign-born population - Other Southern Europe (%)
Place of birth for the foreign-born population - Albania (%)
Place of birth for the foreign-born population - Belarus (%)
Place of birth for the foreign-born population - Bosnia and Herzegovina (%)
Place of birth for the foreign-born population - Bulgaria (%)
Place of birth for the foreign-born population - Croatia (%)
Place of birth for the foreign-born population - Czechoslovakia (%)
Place of birth for the foreign-born population - Hungary (%)
Place of birth for the foreign-born population - Latvia (%)
Place of birth for the foreign-born population - Lithuania (%)
Place of birth for the foreign-born population - North Macedonia (Macedonia) (%)
Place of birth for the foreign-born population - Moldova (%)
Place of birth for the foreign-born population - Poland (%)
Place of birth for the foreign-born population - Romania (%)
Place of birth for the foreign-born population - Russia (%)
Place of birth for the foreign-born population - Serbia (%)
Place of birth for the foreign-born population - Ukraine (%)
Place of birth for the foreign-born population - Other Eastern Europe (%)
Place of birth for the foreign-born population - China (%)
Place of birth for the foreign-born population - Hong Kong (%)
Place of birth for the foreign-born population - Taiwan (%)
Place of birth for the foreign-born population - Japan (%)
Place of birth for the foreign-born population - Korea (%)
Place of birth for the foreign-born population - Other Eastern Asia (%)
Place of birth for the foreign-born population - Afghanistan (%)
Place of birth for the foreign-born population - Bangladesh (%)
Place of birth for the foreign-born population - India (%)
Place of birth for the foreign-born population - Iran (%)
Place of birth for the foreign-born population - Kazakhstan (%)
Place of birth for the foreign-born population - Nepal (%)
Place of birth for the foreign-born population - Pakistan (%)
Place of birth for the foreign-born population - Sri Lanka (%)
Place of birth for the foreign-born population - Uzbekistan (%)
Place of birth for the foreign-born population - Other South Central Asia (%)
Place of birth for the foreign-born population - Burma (%)
Place of birth for the foreign-born population - Cambodia (%)
Place of birth for the foreign-born population - Indonesia (%)
Place of birth for the foreign-born population - Laos (%)
Place of birth for the foreign-born population - Malaysia (%)
Place of birth for the foreign-born population - Philippines (%)
Place of birth for the foreign-born population - Singapore (%)
Place of birth for the foreign-born population - Thailand (%)
Place of birth for the foreign-born population - Vietnam (%)
Place of birth for the foreign-born population - Other South Eastern Asia (%)
Place of birth for the foreign-born population - Armenia (%)
Place of birth for the foreign-born population - Iraq (%)
Place of birth for the foreign-born population - Israel (%)
Place of birth for the foreign-born population - Jordan (%)
Place of birth for the foreign-born population - Kuwait (%)
Place of birth for the foreign-born population - Lebanon (%)
Place of birth for the foreign-born population - Saudi Arabia (%)
Place of birth for the foreign-born population - Syria (%)
Place of birth for the foreign-born population - Turkey (%)
Place of birth for the foreign-born population - Yemen (%)
Place of birth for the foreign-born population - Other Western Asia (%)
Place of birth for the foreign-born population - Eritrea (%)
Place of birth for the foreign-born population - Ethiopia (%)
Place of birth for the foreign-born population - Kenya (%)
Place of birth for the foreign-born population - Somalia (%)
Place of birth for the foreign-born population - Uganda (%)
Place of birth for the foreign-born population - Zimbabwe (%)
Place of birth for the foreign-born population - Other Eastern Africa (%)
Place of birth for the foreign-born population - Cameroon (%)
Place of birth for the foreign-born population - Congo (%)
Place of birth for the foreign-born population - Democratic Republic of Congo (Zaire) (%)
Place of birth for the foreign-born population - Other Middle Africa (%)
Place of birth for the foreign-born population - Egypt (%)
Place of birth for the foreign-born population - Morocco (%)
Place of birth for the foreign-born population - Sudan (%)
Place of birth for the foreign-born population - Other Northern Africa (%)
Place of birth for the foreign-born population - South Africa (%)
Place of birth for the foreign-born population - Other Southern Africa (%)
Place of birth for the foreign-born population - Cabo Verde (%)
Place of birth for the foreign-born population - Ghana (%)
Place of birth for the foreign-born population - Liberia (%)
Place of birth for the foreign-born population - Nigeria (%)
Place of birth for the foreign-born population - Senegal (%)
Place of birth for the foreign-born population - Sierra Leone (%)
Place of birth for the foreign-born population - Other Western Africa (%)
Place of birth for the foreign-born population - Australia (%)
Place of birth for the foreign-born population - New Zealand (%)
Place of birth for the foreign-born population - Fiji (%)
Place of birth for the foreign-born population - Micronesia (%)
Place of birth for the foreign-born population - Bahamas (%)
Place of birth for the foreign-born population - Barbados (%)
Place of birth for the foreign-born population - Cuba (%)
Place of birth for the foreign-born population - Dominica (%)
Place of birth for the foreign-born population - Dominican Republic (%)
Place of birth for the foreign-born population - Grenada (%)
Place of birth for the foreign-born population - Haiti (%)
Place of birth for the foreign-born population - Jamaica (%)
Place of birth for the foreign-born population - St. Vincent and the Grenadines (%)
Place of birth for the foreign-born population - Trinidad and Tobago (%)
Place of birth for the foreign-born population - West Indies (%)
Place of birth for the foreign-born population - Other Caribbean (%)
Place of birth for the foreign-born population - Belize (%)
Place of birth for the foreign-born population - Costa Rica (%)
Place of birth for the foreign-born population - El Salvador (%)
Place of birth for the foreign-born population - Guatemala (%)
Place of birth for the foreign-born population - Honduras (%)
Place of birth for the foreign-born population - Mexico (%)
Place of birth for the foreign-born population - Nicaragua (%)
Place of birth for the foreign-born population - Panama (%)
Place of birth for the foreign-born population - Other Central America (%)
Place of birth for the foreign-born population - Argentina (%)
Place of birth for the foreign-born population - Bolivia (%)
Place of birth for the foreign-born population - Brazil (%)
Place of birth for the foreign-born population - Chile (%)
Place of birth for the foreign-born population - Colombia (%)
Place of birth for the foreign-born population - Ecuador (%)
Place of birth for the foreign-born population - Guyana (%)
Place of birth for the foreign-born population - Peru (%)
Place of birth for the foreign-born population - Uruguay (%)
Place of birth for the foreign-born population - Venezuela (%)
Place of birth for the foreign-born population - Other South America (%)
Place of birth for the foreign-born population - Canada (%)
Place of birth for the foreign-born population - Other Northern America (%)
Place of birth for the foreign-born population - Other (%)
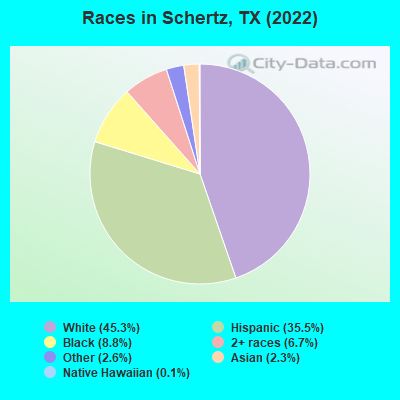
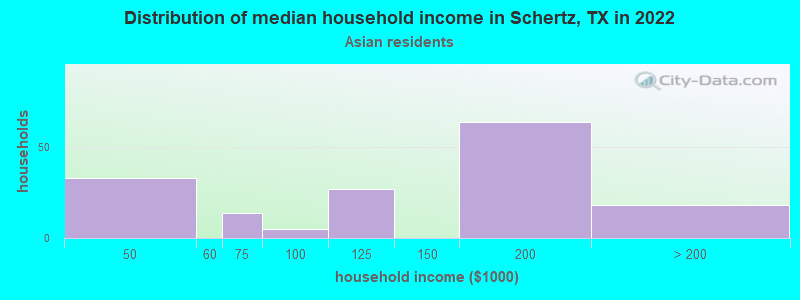
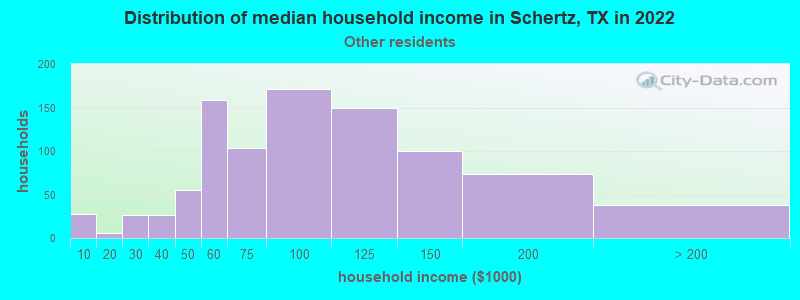
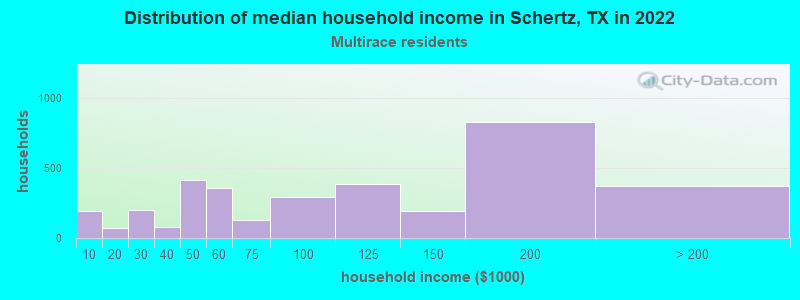
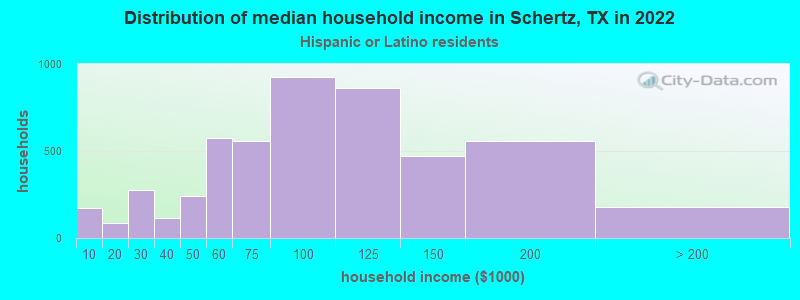
According to 2022 data, the most numerous races in Schertz, TX are Hispanic (15,879 residents), White alone (20,262 residents), and Black alone (3,941 residents). 76.5% of Schertz residents speak English at home. 6.0% of Schertz, TX residents are foreign-born (3.4% born in Latin America, 2.0% born in Asia), which is 183.6% less than the foreign-born rate of 17.0% across the entire state of Texas.
Race distribution in Schertz
2000 2022
10,933,313 52.4% White alone 6,669,666 32.0% Hispanic 2,364,255 11.3% Black alone 554,445 2.7% Asian alone 230,567 1.1% Two or more races 68,859 0.3% American Indian alone 19,958 0.10% Other race alone 10,757 0.05% Native Hawaiian and Other
12,070,642 40.2% Hispanic 11,683,430 38.9% White alone 3,508,706 11.7% Black alone 1,608,173 5.4% Asian alone 956,560 3.2% Two or more races 125,763 0.4% Other race alone 47,023 0.2% American Indian alone 29,275 0.10% Native Hawaiian and Other
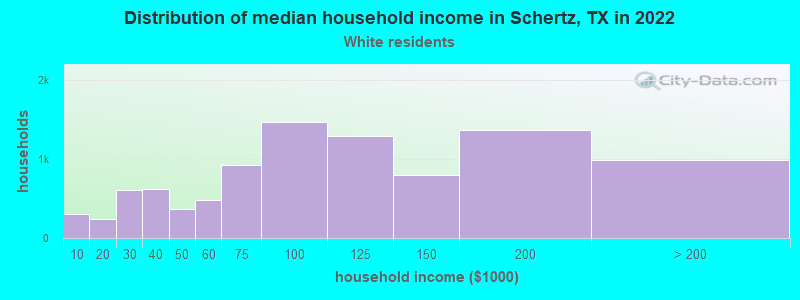
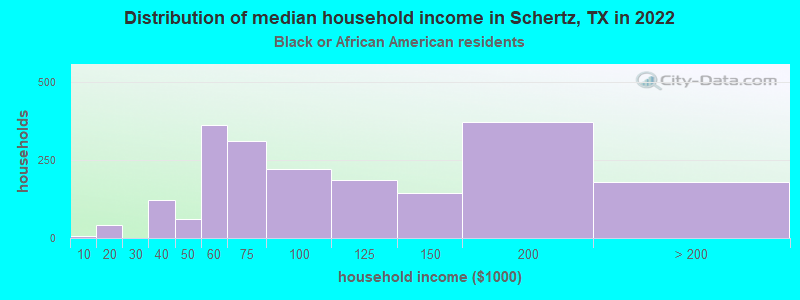
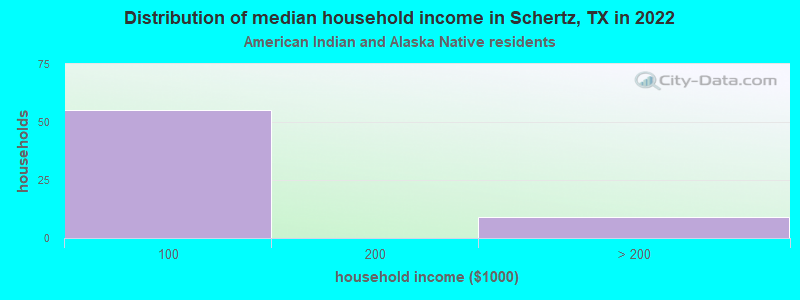
Income and house value in Schertz Median household income in 2022 $89,002 White non-Hispanic householders$91,718 Black householders$132,183 American Indian and Alaska Native householders$174,051 Asian householders$75,469 Some other race householders$108,551 Two or more races householders$99,788 Hispanic or Latino race householdersMedian 2022 house value $328,343 White Non-Hispanic householders$382,131 Black or African American householders$406,365 American Indian or Alaska Native householders $363,808 Asian householders$304,109 Some other race householders$375,629 Two or more races householders$293,765 Hispanic or Latino householders
Median age by race in Schertz
41.9 Median age for White residents41.7 41.9 42.0 Median age for Black or African American residents39.9 43.7 42.7 Median age for American Indian / Alaska Native residents51.3 34.3 52.8 Median age for Asian residents36.5 67.0 -581,560,283.1 Median age for Native Hawaiian / Pacific Islander residents-666,666,666.0 -666,666,666.0 27.7 Median age for Other race residents30.1 24.6 35.7 Median age for Two or more races residents26.9 44.0 42.5 Median age for White alone residents43.5 41.5 33.4 Median age for Hispanic or Latino residents31.6 34.9
Owner/renter occupied households by race in Schertz
House owners and renters - White residents 7,281 76.3% Owner occupied2,261 23.7% Renter occupiedHouse owners and renters - Black or African American residents 1,459 80.8% Owner occupied347 19.2% Renter occupiedHouse owners and renters - American Indian / Alaska Native residents 71 100.0% Owner occupiedHouse owners and renters - Asian residents 150 91.3% Owner occupied14 8.7% Renter occupiedHouse owners and renters - Native Hawaiian / Pacific Islander residents 102 100.0% Owner occupiedHouse owners and renters - Other race residents 1,058 86.4% Owner occupied167 13.6% Renter occupiedHouse owners and renters - Two or more races residents 2,804 81.0% Owner occupied658 19.0% Renter occupiedHouse owners and renters - White alone residents 6,436 77.9% Owner occupied1,825 22.1% Renter occupiedHouse owners and renters - Hispanic or Latino residents 3,858 76.6% Owner occupied1,178 23.4% Renter occupied
Language usage in Schertz
English speakers - Total 76.5% of residents of Schertz speak English at home.
19.7% of residents speak Spanish at home 7,097 84.1% Speak English very well1,337 15.9% Speak English less than very well3.7% of residents speak other language at home 1,343 83.9% Speak English very well257 16.1% Speak English less than very well
English speakers - Born in the United States 89.2% of residents of Schertz speak English at home.
8.9% of residents speak Spanish at home 1,286 82.2% Speak English very well278 17.8% Speak English less than very well1.2% of residents speak other language at home 194 92.4% Speak English very well16 7.6% Speak English less than very well
English speakers - Native, born elsewhere 45.5% of residents of Schertz speak English at home.
40.4% of residents speak Spanish at home 651 83.6% Speak English very well128 16.4% Speak English less than very well11.3% of residents speak other language at home 197 90.4% Speak English very well21 9.6% Speak English less than very well
English speakers - Foreign-born 27.5% of residents of Schertz speak English at home.
41.3% of residents speak Spanish at home 780 64.0% Speak English very well438 36.0% Speak English less than very well33.9% of residents speak other language at home 855 85.7% Speak English very well143 14.3% Speak English less than very well
White (Caucasian) - Speak only English Native:
91.2% (19,654)Foreign-born:
23.8% (96)
White (Caucasian) - Speak another language Native:
8.3% (1,783)Foreign-born:
76.4% (308)
Black or African American - Speak only English Native:
97.4% (4,349)Foreign-born:
70.8% (59)
Black or African American - Speak another language Native:
2.6% (116)Foreign-born:
23.1% (19)
American Indian / Alaska Native - Speak another language Native:
77.5% (103)Foreign-born:
98.9% (36)
Asian - Speak only English Native:
74.8% (183)Foreign-born:
50.3% (471)
Asian - Speak another language Native:
27.1% (66)Foreign-born:
47.7% (447)
Other race - Speak only English Native:
55.9% (1,811)Foreign-born:
15.9% (96)
Other race - Speak another language Native:
43.2% (1,400)Foreign-born:
84.4% (509)
Two or more races - Speak only English Native:
60.3% (6,074)Foreign-born:
17.5% (162)
Two or more races - Speak another language Native:
36.8% (3,705)Foreign-born:
78.6% (728)
White alone - Speak only English Native:
96.1% (18,055)Foreign-born:
23.1% (96)
White alone - Speak another language Native:
4.2% (798)Foreign-born:
95.8% (400)
Hispanic or Latino - Speak only English Native:
54.8% (7,540)Foreign-born:
14.1% (206)
Hispanic or Latino - Speak another language Native:
45.2% (6,220)Foreign-born:
86.1% (1,263)
Foreign-born residents in Schertz 2,681 residents are foreign born (3.4% Latin America , 2.0% Asia ).
This city:
6.0%Texas:
17.1%
Marital status for residents in Schertz Marital status - White (Caucasian) population 15 years and over
Males 22.8% Never married63.9% Now married1.0% Separated3.0% Widowed9.2% DivorcedFemales 20.6% Never married56.8% Now married1.2% Separated8.4% Widowed13.0% DivorcedWomen who gave birth in the past 12 months Now married:
82.5% (169)Unmarried:
17.5% (36)
Women who did not give birth in the past 12 months Now married:
54.4% (2,650)Unmarried:
45.6% (2,218)
Marital status - Black or African American population 15 years and over
Males 23.3% Never married59.8% Now married2.4% Separated1.4% Widowed13.1% DivorcedFemales 29.1% Never married47.8% Now married2.4% Separated6.8% Widowed13.9% DivorcedWomen who gave birth in the past 12 months Now married:
100.0% (34)Unmarried:
0.0% (0)
Women who did not give birth in the past 12 months Now married:
37.0% (410)Unmarried:
63.0% (697)
Marital status - American Indian / Alaska Native population 15 years and over
Males 83.5% Never married13.9% Now married0.0% Separated0.0% Widowed2.5% DivorcedFemales 0.0% Never married55.9% Now married26.5% Separated0.0% Widowed17.6% DivorcedWomen who did not give birth in the past 12 months Now married:
100.0% (24)Unmarried:
0.0% (0)
Marital status - Asian population 15 years and over
Males 33.0% Never married48.9% Now married0.0% Separated0.0% Widowed18.1% DivorcedFemales 5.9% Never married76.4% Now married0.0% Separated8.5% Widowed9.2% DivorcedWomen who did not give birth in the past 12 months Now married:
50.7% (114)Unmarried:
49.3% (111)
Marital status - Other race population 15 years and over
Males 35.7% Never married64.3% Now married0.0% Separated0.0% Widowed0.0% DivorcedFemales 31.9% Never married51.9% Now married4.2% Separated2.2% Widowed9.8% DivorcedWomen who gave birth in the past 12 months Now married:
100.0% (10)Unmarried:
0.0% (0)
Women who did not give birth in the past 12 months Now married:
55.2% (663)Unmarried:
44.8% (538)
Marital status - Two or more races population 15 years and over
Males 44.6% Never married45.9% Now married0.0% Separated6.8% Widowed2.8% DivorcedFemales 28.5% Never married51.2% Now married2.2% Separated2.6% Widowed15.5% DivorcedWomen who gave birth in the past 12 months Now married:
100.0% (69)Unmarried:
0.0% (0)
Women who did not give birth in the past 12 months Now married:
44.1% (1,181)Unmarried:
55.9% (1,500)
Marital status - White alone, not Hispanic / Latino population 15 years and over
Males 21.6% Never married65.9% Now married0.7% Separated3.0% Widowed8.8% DivorcedFemales 18.5% Never married58.1% Now married1.1% Separated10.1% Widowed12.2% DivorcedWomen who gave birth in the past 12 months Now married:
88.6% (172)Unmarried:
11.4% (22)
Women who did not give birth in the past 12 months Now married:
55.9% (2,258)Unmarried:
44.1% (1,781)
Marital status - Hispanic or Latino population 15 years and over
Males 38.7% Never married51.5% Now married0.8% Separated3.4% Widowed5.6% DivorcedFemales 29.2% Never married52.7% Now married2.4% Separated2.5% Widowed13.2% DivorcedWomen who gave birth in the past 12 months Now married:
78.2% (85)Unmarried:
21.8% (24)
Women who did not give birth in the past 12 months Now married:
49.8% (2,076)Unmarried:
50.2% (2,091)
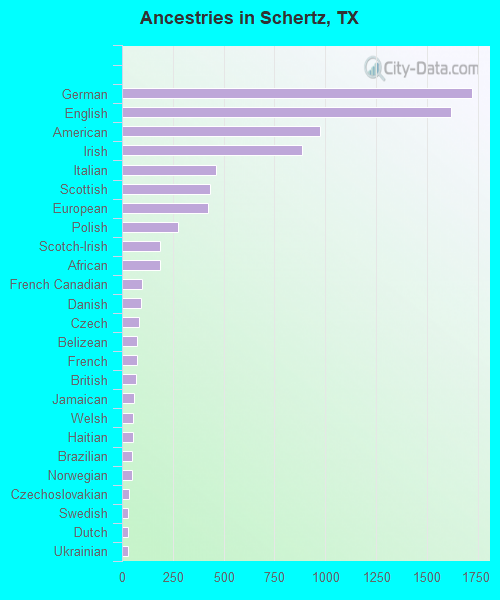
Ancestries in Schertz
1,719 7.8% German1,616 7.3% English973 4.4% American887 4.0% Irish464 2.1% Italian434 2.0% Scottish425 1.9% European276 1.3% Polish188 0.9% Scotch-Irish185 0.8% African96 0.4% French Canadian92 0.4% Danish82 0.4% Czech75 0.3% Belizean73 0.3% French68 0.3% British58 0.3% Jamaican55 0.2% Welsh54 0.2% Haitian50 0.2% Brazilian48 0.2% Norwegian33 0.1% Czechoslovakian29 0.1% Swedish28 0.1% Dutch28 0.1% Ukrainian24 0.1% Northern European23 0.1% Guyanese22 0.10% Cajun20 0.09% Scandinavian16 0.07% Armenian16 0.07% Slovak15 0.07% Finnish15 0.07% Canadian14 0.06% Hungarian12 0.05% Celtic10 0.05% Lebanese8 0.04% Eastern European7 0.03% Belgian7 0.03% Trinidadian and Tobagonian7 0.03% Yugoslavian5 0.02% Lithuanian
Geographical mobility in Schertz Same house 1 year ago 17,883 78.4% White (Caucasian)3,811 82.8% Black or African American111 64.4% American Indian / Alaska Native904 91.4% Asian83 98.2% Native Hawaiian / Pacific Islander3,097 79.1% Other race10,094 88.3% Two or more races16,515 82.1% White alone, not Hispanic / Latino12,163 77.0% Hispanic or LatinoMoved within same county 1,143 5.0% White / Caucasian301 6.5% Black or African American17 1.7% Asian34 0.9% Other race78 0.7% Two or more races668 3.3% White alone, not Hispanic / Latino417 2.6% Hispanic or LatinoMoved within same state 2,301 10.1% White / Caucasian363 7.9% Black or African American34 3.5% Asian226 5.8% Other race1,197 10.5% Two or more races1,584 7.9% White alone, not Hispanic / Latino1,130 7.2% Hispanic or LatinoMoved from different state 1,620 7.1% White / Caucasian128 2.8% Black or African American33 19.3% American Indian / Alaska Native23 0.6% Other race304 2.7% Two or more races1,362 6.8% White alone, not Hispanic / Latino612 3.9% Hispanic or LatinoMoved from abroad 262 1.1% White20 0.4% Black or African American18 10.2% American Indian / Alaska Native31 3.2% Asian3 0.1% Other race62 0.5% Two or more races38 0.2% White alone, not Hispanic / Latino226 1.4% Hispanic or Latino
Children Nativity (place of birth) in Schertz
Children under 6 years - Living with two parents Both parents native 1,957 100.0% NativeBoth parents foreign-born 109 100.0% NativeOne native, one foreign-born parent 220 100.0% NativeChildren under 6 years - Living with one parent Native parent 282 100.0% NativeChildren 6 to 17 years - Living with two parents Both parents native 4,761 100.0% NativeBoth parents foreign-born 231 100.0% NativeOne native, one foreign-born parent 735 98.3% Native13 1.7% Foreign-bornChildren 6 to 17 years - Living with one parent Native parent 1,638 100.0% NativeForeign-born parent 49 54.2% Native41 45.8% Foreign-born
Grandparents responsible for own grandchildren in Schertz
Grandparents (30 to 59 years) White / Caucasian 17 27.7% Responsible for grandchildren45 72.3% Not responsible for grandchildrenBlack or African American 37 100.0% Not responsible for grandchildrenTwo or more races 191 73.2% Responsible for grandchildren70 26.8% Not responsible for grandchildrenWhite alone, not Hispanic / Latino 11 9.4% Responsible for grandchildren106 90.6% Not responsible for grandchildrenHispanic or Latino 92 69.1% Responsible for grandchildren41 30.9% Not responsible for grandchildrenGrandparents (60 years and over) White / Caucasian 41 13.6% Responsible for grandchildren257 86.4% Not responsible for grandchildrenBlack or African American 48 100.0% Not responsible for grandchildrenTwo or more races 8 100.0% Responsible for grandchildrenWhite alone, not Hispanic / Latino 24 11.6% Responsible for grandchildren183 88.4% Not responsible for grandchildrenHispanic or Latino 43 31.5% Responsible for grandchildren94 68.5% Not responsible for grandchildren