Races in Roswell, New Mexico (NM) Detailed Stats
Data:
Races - White alone (%)
Races - White alone (% change since 2000)
Races - Black alone (%)
Races - Black alone (% change since 2000)
Races - American Indian alone (%)
Races - American Indian alone (% change since 2000)
Races - Asian alone (%)
Races - Asian alone (% change since 2000)
Races - Hispanic (%)
Races - Hispanic (% change since 2000)
Races - Native Hawaiian and Other Pacific Islander alone (%)
Races - Native Hawaiian and Other Pacific Islander alone (% change since 2000)
Races - Two or more races(%)
Races - Two or more races(% change since 2000)
Races - Other race alone (%)
Races - Other race alone (% change since 2000)
Racial diversity
Place of birth - Born in state of residence (%)
Place of birth - Born in state of residence (%) - White
Place of birth - Born in state of residence (%) - Black or African American
Place of birth - Born in state of residence (%) - Asian
Place of birth - Born in state of residence (%) - Hispanic or Latino
Place of birth - Born in state of residence (%) - American Indian and Alaska Native
Place of birth - Born in state of residence (%) - Multirace
Place of birth - Born in state of residence (%) - Other Race
Place of birth - Born in other state (%)
Place of birth - Born in other state (%) - White
Place of birth - Born in other state (%) - Black or African American
Place of birth - Born in other state (%) - Asian
Place of birth - Born in other state (%) - Hispanic or Latino
Place of birth - Born in other state (%) - American Indian and Alaska Native
Place of birth - Born in other state (%) - Multirace
Place of birth - Born in other state (%) - Other Race
Place of birth - Native, outside of US (%)
Place of birth - Native, outside of US (%) - White
Place of birth - Native, outside of US (%) - Black or African American
Place of birth - Native, outside of US (%) - Asian
Place of birth - Native, outside of US (%) - Hispanic or Latino
Place of birth - Native, outside of US (%) - American Indian and Alaska Native
Place of birth - Native, outside of US (%) - Multirace
Place of birth - Native, outside of US (%) - Other Race
Place of birth - Foreign born (%)
Place of birth - Foreign born (%) - White
Place of birth - Foreign born (%) - Black or African American
Place of birth - Foreign born (%) - Asian
Place of birth - Foreign born (%) - Hispanic or Latino
Place of birth - Foreign born (%) - American Indian and Alaska Native
Place of birth - Foreign born (%) - Multirace
Place of birth - Foreign born (%) - Other Race
Residents speaking English at home (%)
Residents speaking English at home - Born in the United States (%)
Residents speaking English at home - Native, born elsewhere (%)
Residents speaking English at home - Foreign born (%)
Residents speaking Spanish at home (%)
Residents speaking Spanish at home - Born in the United States (%)
Residents speaking Spanish at home - Native, born elsewhere (%)
Residents speaking Spanish at home - Foreign born (%)
Residents speaking other language at home (%)
Residents speaking other language at home - Born in the United States (%)
Residents speaking other language at home - Native, born elsewhere (%)
Residents speaking other language at home - Foreign born (%)
Marital status - Never married (%)
Marital status - Now married (%)
Marital status - Separated (%)
Marital status - Widowed (%)
Marital status - Divorced (%)
Ancestries Reported - Arab (%)
Ancestries Reported - Czech (%)
Ancestries Reported - Danish (%)
Ancestries Reported - Dutch (%)
Ancestries Reported - English (%)
Ancestries Reported - French (%)
Ancestries Reported - French Canadian (%)
Ancestries Reported - German (%)
Ancestries Reported - Greek (%)
Ancestries Reported - Hungarian (%)
Ancestries Reported - Irish (%)
Ancestries Reported - Italian (%)
Ancestries Reported - Lithuanian (%)
Ancestries Reported - Norwegian (%)
Ancestries Reported - Polish (%)
Ancestries Reported - Portuguese (%)
Ancestries Reported - Russian (%)
Ancestries Reported - Scotch-Irish (%)
Ancestries Reported - Scottish (%)
Ancestries Reported - Slovak (%)
Ancestries Reported - Subsaharan African (%)
Ancestries Reported - Swedish (%)
Ancestries Reported - Swiss (%)
Ancestries Reported - Ukrainian (%)
Ancestries Reported - United States (%)
Ancestries Reported - Welsh (%)
Ancestries Reported - West Indian (%)
Ancestries Reported - Other (%)
Geographical mobility - Same house 1 year ago (%)
Geographical mobility - Same house 1 year ago (%) - White
Geographical mobility - Same house 1 year ago (%) - Black or African American
Geographical mobility - Same house 1 year ago (%) - Asian
Geographical mobility - Same house 1 year ago (%) - Hispanic or Latino
Geographical mobility - Same house 1 year ago (%) - American Indian and Alaska Native
Geographical mobility - Same house 1 year ago (%) - Multirace
Geographical mobility - Same house 1 year ago (%) - Other Race
Geographical mobility - Moved within same county (%)
Geographical mobility - Moved within same county (%) - White
Geographical mobility - Moved within same county (%) - Black or African American
Geographical mobility - Moved within same county (%) - Asian
Geographical mobility - Moved within same county (%) - Hispanic or Latino
Geographical mobility - Moved within same county (%) - American Indian and Alaska Native
Geographical mobility - Moved within same county (%) - Multirace
Geographical mobility - Moved within same county (%) - Other Race
Geographical mobility - Moved from different county within same state (%)
Geographical mobility - Moved from different county within same state (%) - White
Geographical mobility - Moved from different county within same state (%) - Black or African American
Geographical mobility - Moved from different county within same state (%) - Asian
Geographical mobility - Moved from different county within same state (%) - Hispanic or Latino
Geographical mobility - Moved from different county within same state (%) - American Indian and Alaska Native
Geographical mobility - Moved from different county within same state (%) - Multirace
Geographical mobility - Moved from different county within same state (%) - Other Race
Geographical mobility - Moved from different state (%)
Geographical mobility - Moved from different state (%) - White
Geographical mobility - Moved from different state (%) - Black or African American
Geographical mobility - Moved from different state (%) - Asian
Geographical mobility - Moved from different state (%) - Hispanic or Latino
Geographical mobility - Moved from different state (%) - American Indian and Alaska Native
Geographical mobility - Moved from different state (%) - Multirace
Geographical mobility - Moved from different state (%) - Other Race
Geographical mobility - Moved from abroad (%)
Geographical mobility - Moved from abroad (%) - White
Geographical mobility - Moved from abroad (%) - Black or African American
Geographical mobility - Moved from abroad (%) - Asian
Geographical mobility - Moved from abroad (%) - Hispanic or Latino
Geographical mobility - Moved from abroad (%) - American Indian and Alaska Native
Geographical mobility - Moved from abroad (%) - Multirace
Geographical mobility - Moved from abroad (%) - Other Race
Place of birth for the foreign-born population - Ireland (%)
Place of birth for the foreign-born population - Denmark (%)
Place of birth for the foreign-born population - Norway (%)
Place of birth for the foreign-born population - Sweden (%)
Place of birth for the foreign-born population - United Kingdom (%)
Place of birth for the foreign-born population - England (%)
Place of birth for the foreign-born population - Scotland (%)
Place of birth for the foreign-born population - Other Northern Europe (%)
Place of birth for the foreign-born population - Austria (%)
Place of birth for the foreign-born population - Belgium (%)
Place of birth for the foreign-born population - France (%)
Place of birth for the foreign-born population - Germany (%)
Place of birth for the foreign-born population - Netherlands (%)
Place of birth for the foreign-born population - Switzerland (%)
Place of birth for the foreign-born population - Other Western Europe (%)
Place of birth for the foreign-born population - Greece (%)
Place of birth for the foreign-born population - Italy (%)
Place of birth for the foreign-born population - Portugal (%)
Place of birth for the foreign-born population - Spain (%)
Place of birth for the foreign-born population - Other Southern Europe (%)
Place of birth for the foreign-born population - Albania (%)
Place of birth for the foreign-born population - Belarus (%)
Place of birth for the foreign-born population - Bosnia and Herzegovina (%)
Place of birth for the foreign-born population - Bulgaria (%)
Place of birth for the foreign-born population - Croatia (%)
Place of birth for the foreign-born population - Czechoslovakia (%)
Place of birth for the foreign-born population - Hungary (%)
Place of birth for the foreign-born population - Latvia (%)
Place of birth for the foreign-born population - Lithuania (%)
Place of birth for the foreign-born population - North Macedonia (Macedonia) (%)
Place of birth for the foreign-born population - Moldova (%)
Place of birth for the foreign-born population - Poland (%)
Place of birth for the foreign-born population - Romania (%)
Place of birth for the foreign-born population - Russia (%)
Place of birth for the foreign-born population - Serbia (%)
Place of birth for the foreign-born population - Ukraine (%)
Place of birth for the foreign-born population - Other Eastern Europe (%)
Place of birth for the foreign-born population - China (%)
Place of birth for the foreign-born population - Hong Kong (%)
Place of birth for the foreign-born population - Taiwan (%)
Place of birth for the foreign-born population - Japan (%)
Place of birth for the foreign-born population - Korea (%)
Place of birth for the foreign-born population - Other Eastern Asia (%)
Place of birth for the foreign-born population - Afghanistan (%)
Place of birth for the foreign-born population - Bangladesh (%)
Place of birth for the foreign-born population - India (%)
Place of birth for the foreign-born population - Iran (%)
Place of birth for the foreign-born population - Kazakhstan (%)
Place of birth for the foreign-born population - Nepal (%)
Place of birth for the foreign-born population - Pakistan (%)
Place of birth for the foreign-born population - Sri Lanka (%)
Place of birth for the foreign-born population - Uzbekistan (%)
Place of birth for the foreign-born population - Other South Central Asia (%)
Place of birth for the foreign-born population - Burma (%)
Place of birth for the foreign-born population - Cambodia (%)
Place of birth for the foreign-born population - Indonesia (%)
Place of birth for the foreign-born population - Laos (%)
Place of birth for the foreign-born population - Malaysia (%)
Place of birth for the foreign-born population - Philippines (%)
Place of birth for the foreign-born population - Singapore (%)
Place of birth for the foreign-born population - Thailand (%)
Place of birth for the foreign-born population - Vietnam (%)
Place of birth for the foreign-born population - Other South Eastern Asia (%)
Place of birth for the foreign-born population - Armenia (%)
Place of birth for the foreign-born population - Iraq (%)
Place of birth for the foreign-born population - Israel (%)
Place of birth for the foreign-born population - Jordan (%)
Place of birth for the foreign-born population - Kuwait (%)
Place of birth for the foreign-born population - Lebanon (%)
Place of birth for the foreign-born population - Saudi Arabia (%)
Place of birth for the foreign-born population - Syria (%)
Place of birth for the foreign-born population - Turkey (%)
Place of birth for the foreign-born population - Yemen (%)
Place of birth for the foreign-born population - Other Western Asia (%)
Place of birth for the foreign-born population - Eritrea (%)
Place of birth for the foreign-born population - Ethiopia (%)
Place of birth for the foreign-born population - Kenya (%)
Place of birth for the foreign-born population - Somalia (%)
Place of birth for the foreign-born population - Uganda (%)
Place of birth for the foreign-born population - Zimbabwe (%)
Place of birth for the foreign-born population - Other Eastern Africa (%)
Place of birth for the foreign-born population - Cameroon (%)
Place of birth for the foreign-born population - Congo (%)
Place of birth for the foreign-born population - Democratic Republic of Congo (Zaire) (%)
Place of birth for the foreign-born population - Other Middle Africa (%)
Place of birth for the foreign-born population - Egypt (%)
Place of birth for the foreign-born population - Morocco (%)
Place of birth for the foreign-born population - Sudan (%)
Place of birth for the foreign-born population - Other Northern Africa (%)
Place of birth for the foreign-born population - South Africa (%)
Place of birth for the foreign-born population - Other Southern Africa (%)
Place of birth for the foreign-born population - Cabo Verde (%)
Place of birth for the foreign-born population - Ghana (%)
Place of birth for the foreign-born population - Liberia (%)
Place of birth for the foreign-born population - Nigeria (%)
Place of birth for the foreign-born population - Senegal (%)
Place of birth for the foreign-born population - Sierra Leone (%)
Place of birth for the foreign-born population - Other Western Africa (%)
Place of birth for the foreign-born population - Australia (%)
Place of birth for the foreign-born population - New Zealand (%)
Place of birth for the foreign-born population - Fiji (%)
Place of birth for the foreign-born population - Micronesia (%)
Place of birth for the foreign-born population - Bahamas (%)
Place of birth for the foreign-born population - Barbados (%)
Place of birth for the foreign-born population - Cuba (%)
Place of birth for the foreign-born population - Dominica (%)
Place of birth for the foreign-born population - Dominican Republic (%)
Place of birth for the foreign-born population - Grenada (%)
Place of birth for the foreign-born population - Haiti (%)
Place of birth for the foreign-born population - Jamaica (%)
Place of birth for the foreign-born population - St. Vincent and the Grenadines (%)
Place of birth for the foreign-born population - Trinidad and Tobago (%)
Place of birth for the foreign-born population - West Indies (%)
Place of birth for the foreign-born population - Other Caribbean (%)
Place of birth for the foreign-born population - Belize (%)
Place of birth for the foreign-born population - Costa Rica (%)
Place of birth for the foreign-born population - El Salvador (%)
Place of birth for the foreign-born population - Guatemala (%)
Place of birth for the foreign-born population - Honduras (%)
Place of birth for the foreign-born population - Mexico (%)
Place of birth for the foreign-born population - Nicaragua (%)
Place of birth for the foreign-born population - Panama (%)
Place of birth for the foreign-born population - Other Central America (%)
Place of birth for the foreign-born population - Argentina (%)
Place of birth for the foreign-born population - Bolivia (%)
Place of birth for the foreign-born population - Brazil (%)
Place of birth for the foreign-born population - Chile (%)
Place of birth for the foreign-born population - Colombia (%)
Place of birth for the foreign-born population - Ecuador (%)
Place of birth for the foreign-born population - Guyana (%)
Place of birth for the foreign-born population - Peru (%)
Place of birth for the foreign-born population - Uruguay (%)
Place of birth for the foreign-born population - Venezuela (%)
Place of birth for the foreign-born population - Other South America (%)
Place of birth for the foreign-born population - Canada (%)
Place of birth for the foreign-born population - Other Northern America (%)
Place of birth for the foreign-born population - Other (%)
Latest news about races in Roswell, NM collected exclusively by city-data.com from local newspapers, TV, and radio stations
According to 2022 data, the most numerous races in Roswell, NM are Hispanic (29,613 residents), White alone (15,847 residents), and American Indian alone (191 residents). 67.2% of Roswell residents speak English at home. 11.5% of Roswell, NM residents are foreign-born (9.5% born in Latin America, 1.2% born in Asia), which is 21.9% greater than the foreign-born rate of 9.0% across the entire state of New Mexico.
Race distribution in Roswell
2000 2022
813,495 44.7% White alone 765,386 42.1% Hispanic 161,460 8.9% American Indian alone 30,654 1.7% Black alone 25,793 1.4% Two or more races 18,257 1.0% Asian alone 3,009 0.2% Other race alone 992 0.05% Native Hawaiian and Other
1,059,867 50.2% Hispanic 735,478 34.8% White alone 171,808 8.1% American Indian alone 65,084 3.1% Two or more races 36,870 1.7% Black alone 35,870 1.7% Asian alone 7,582 0.4% Other race alone 785 0.04% Native Hawaiian and Other
Income and house value in Roswell Median household income in 2022 $59,447 White non-Hispanic householders$111,756 Asian householders$45,456 Some other race householders$29,404 Two or more races householders$44,841 Hispanic or Latino race householdersMedian 2022 house value $188,815 White Non-Hispanic householders$137,081 Black or African American householders$131,829 American Indian or Alaska Native householders $297,797 Asian householders$118,173 Native Hawaiian and other Pacific Islander householders$102,942 Some other race householders$100,841 Two or more races householders$108,194 Hispanic or Latino householders
Median age by race in Roswell
39.4 Median age for White residents38.0 40.1 32.8 Median age for Black or African American residents32.4 31.2 39.0 Median age for American Indian / Alaska Native residents32.0 40.9 34.8 Median age for Asian residents20.2 49.7 -658,511,722.1 Median age for Native Hawaiian / Pacific Islander residents-685,897,435.2 -659,380,691.5 29.0 Median age for Other race residents27.0 32.0 37.5 Median age for Two or more races residents33.9 42.1 49.6 Median age for White alone residents47.8 53.0 30.3 Median age for Hispanic or Latino residents28.8 31.4
Owner/renter occupied households by race in Roswell
House owners and renters - White residents 7,317 67.9% Owner occupied3,460 32.1% Renter occupiedHouse owners and renters - Black or African American residents 139 45.6% Owner occupied166 54.4% Renter occupiedHouse owners and renters - American Indian / Alaska Native residents 124 56.6% Owner occupied95 43.4% Renter occupiedHouse owners and renters - Asian residents 157 71.8% Owner occupied62 28.2% Renter occupiedHouse owners and renters - Other race residents 2,055 74.4% Owner occupied708 25.6% Renter occupiedHouse owners and renters - Two or more races residents 1,968 58.1% Owner occupied1,421 41.9% Renter occupiedHouse owners and renters - White alone residents 4,993 68.2% Owner occupied2,324 31.8% Renter occupiedHouse owners and renters - Hispanic or Latino residents 6,575 66.5% Owner occupied3,319 33.5% Renter occupied
Language usage in Roswell
English speakers - Total 67.2% of residents of Roswell speak English at home.
31.1% of residents speak Spanish at home 10,055 71.7% Speak English very well3,976 28.3% Speak English less than very well2.0% of residents speak other language at home 676 75.0% Speak English very well225 25.0% Speak English less than very well
English speakers - Born in the United States 77.8% of residents of Roswell speak English at home.
19.7% of residents speak Spanish at home 2,464 91.4% Speak English very well233 8.6% Speak English less than very well1.6% of residents speak other language at home 198 88.4% Speak English very well26 11.6% Speak English less than very well
English speakers - Native, born elsewhere 93.1% of residents of Roswell speak English at home.
10.1% of residents speak Spanish at home 21 65.6% Speak English very well11 34.4% Speak English less than very well1.3% of residents speak other language at home 4 100.0% Speak English very well
English speakers - Foreign-born 14.1% of residents of Roswell speak English at home.
73.2% of residents speak Spanish at home 1,565 39.0% Speak English very well2,449 61.0% Speak English less than very well11.3% of residents speak other language at home 429 69.1% Speak English very well192 30.9% Speak English less than very well
White (Caucasian) - Speak only English Native:
85.8% (19,597)Foreign-born:
17.4% (180)
White (Caucasian) - Speak another language Native:
12.4% (2,836)Foreign-born:
100.0% (1,037)
Black or African American - Speak only English Native:
93.8% (536)Foreign-born:
100.0% (160)
Black or African American - Speak another language Native:
6.0% (34)Foreign-born:
12.8% (20)
American Indian / Alaska Native - Speak another language Native:
49.5% (232)Foreign-born:
100.0% (33)
Asian - Speak only English Native:
49.4% (79)Foreign-born:
12.7% (76)
Asian - Speak another language Native:
50.0% (80)Foreign-born:
86.8% (521)
Other race - Speak only English Native:
54.4% (3,701)Foreign-born:
8.3% (136)
Other race - Speak another language Native:
45.8% (3,119)Foreign-born:
91.8% (1,501)
Two or more races - Speak only English Native:
58.5% (4,717)Foreign-born:
14.3% (222)
Two or more races - Speak another language Native:
41.8% (3,373)Foreign-born:
86.0% (1,332)
White alone - Speak only English Native:
96.3% (14,556)Foreign-born:
14.8% (20)
White alone - Speak another language Native:
3.6% (544)Foreign-born:
81.3% (107)
Hispanic or Latino - Speak only English Native:
57.4% (13,098)Foreign-born:
11.9% (545)
Hispanic or Latino - Speak another language Native:
42.6% (9,718)Foreign-born:
88.7% (4,054)
Foreign-born residents in Roswell 5,537 residents are foreign born (9.5% Latin America , 1.2% Asia ).
This city:
11.5%New Mexico:
9.2%
Marital status for residents in Roswell Marital status - White (Caucasian) population 15 years and over
Males 39.3% Never married44.6% Now married0.6% Separated4.1% Widowed11.5% DivorcedFemales 31.9% Never married39.1% Now married2.9% Separated9.9% Widowed16.3% DivorcedWomen who gave birth in the past 12 months Now married:
64.0% (273)Unmarried:
36.0% (153)
Women who did not give birth in the past 12 months Now married:
37.8% (1,906)Unmarried:
62.2% (3,136)
Marital status - Black or African American population 15 years and over
Males 49.7% Never married35.4% Now married0.0% Separated7.3% Widowed7.6% DivorcedFemales 25.3% Never married44.8% Now married0.0% Separated19.6% Widowed10.3% DivorcedWomen who gave birth in the past 12 months Now married:
100.0% (82)Unmarried:
0.0% (0)
Women who did not give birth in the past 12 months Now married:
0.0% (0)Unmarried:
100.0% (81)
Marital status - American Indian / Alaska Native population 15 years and over
Males 53.6% Never married20.2% Now married1.6% Separated0.0% Widowed24.6% DivorcedFemales 35.2% Never married17.8% Now married0.9% Separated25.8% Widowed20.2% DivorcedWomen who did not give birth in the past 12 months Now married:
26.8% (40)Unmarried:
73.2% (110)
Marital status - Asian population 15 years and over
Males 54.8% Never married36.7% Now married0.0% Separated0.0% Widowed8.5% DivorcedFemales 14.1% Never married63.4% Now married0.0% Separated18.1% Widowed4.4% DivorcedWomen who gave birth in the past 12 months Now married:
100.0% (14)Unmarried:
0.0% (0)
Women who did not give birth in the past 12 months Now married:
85.2% (193)Unmarried:
14.8% (34)
Marital status - Native Hawaiian / Pacific Islander population 15 years and over
Males 100.0% Never married0.0% Now married0.0% Separated0.0% Widowed0.0% DivorcedFemales 0.0% Never married100.0% Now married0.0% Separated0.0% Widowed0.0% DivorcedMarital status - Other race population 15 years and over
Males 41.9% Never married46.0% Now married0.0% Separated3.9% Widowed8.1% DivorcedFemales 33.7% Never married43.0% Now married3.9% Separated3.7% Widowed15.7% DivorcedWomen who gave birth in the past 12 months Now married:
79.4% (257)Unmarried:
20.6% (67)
Women who did not give birth in the past 12 months Now married:
44.0% (1,026)Unmarried:
56.0% (1,307)
Marital status - Two or more races population 15 years and over
Males 42.0% Never married44.8% Now married0.4% Separated2.4% Widowed10.4% DivorcedFemales 36.7% Never married24.6% Now married2.9% Separated4.4% Widowed31.4% DivorcedWomen who gave birth in the past 12 months Now married:
58.7% (41)Unmarried:
41.3% (29)
Women who did not give birth in the past 12 months Now married:
18.8% (391)Unmarried:
81.2% (1,691)
Marital status - White alone, not Hispanic / Latino population 15 years and over
Males 32.6% Never married47.8% Now married1.0% Separated6.3% Widowed12.4% DivorcedFemales 21.9% Never married43.2% Now married2.6% Separated14.2% Widowed18.1% DivorcedWomen who gave birth in the past 12 months Now married:
84.8% (65)Unmarried:
15.2% (12)
Women who did not give birth in the past 12 months Now married:
44.9% (1,252)Unmarried:
55.1% (1,533)
Marital status - Hispanic or Latino population 15 years and over
Males 44.9% Never married42.2% Now married0.1% Separated2.3% Widowed10.5% DivorcedFemales 39.6% Never married33.5% Now married3.3% Separated4.7% Widowed18.9% DivorcedWomen who gave birth in the past 12 months Now married:
66.1% (506)Unmarried:
33.9% (260)
Women who did not give birth in the past 12 months Now married:
32.3% (2,216)Unmarried:
67.7% (4,643)
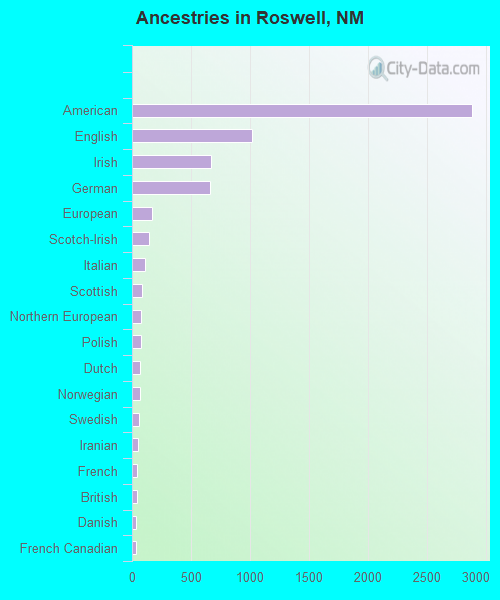
Ancestries in Roswell
2,882 10.0% American1,018 3.5% English667 2.3% Irish658 2.3% German166 0.6% European146 0.5% Scotch-Irish108 0.4% Italian82 0.3% Scottish79 0.3% Northern European79 0.3% Polish70 0.2% Dutch64 0.2% Norwegian56 0.2% Swedish48 0.2% Iranian46 0.2% French43 0.1% British34 0.1% Danish31 0.1% French Canadian22 0.08% Czech18 0.06% Welsh14 0.05% Greek14 0.05% Russian12 0.04% Lebanese11 0.04% African8 0.03% Scandinavian7 0.02% Egyptian7 0.02% Portuguese7 0.02% Soviet Union6 0.02% German Russian4 0.01% Slavic
Geographical mobility in Roswell Same house 1 year ago 21,677 85.8% White (Caucasian)439 57.1% Black or African American447 91.2% American Indian / Alaska Native699 91.0% Asian30 100.0% Native Hawaiian / Pacific Islander8,186 89.8% Other race8,315 84.4% Two or more races13,495 86.1% White alone, not Hispanic / Latino25,267 86.7% Hispanic or LatinoMoved within same county 1,959 7.8% White / Caucasian41 5.3% Black or African American3 0.5% American Indian / Alaska Native10 1.3% Asian496 5.4% Other race608 6.2% Two or more races972 6.2% White alone, not Hispanic / Latino2,313 7.9% Hispanic or LatinoMoved within same state 486 1.9% White / Caucasian17 2.2% Black or African American36 7.2% American Indian / Alaska Native17 2.2% Asian192 2.1% Other race385 3.9% Two or more races283 1.8% White alone, not Hispanic / Latino795 2.7% Hispanic or LatinoMoved from different state 955 3.8% White / Caucasian202 26.3% Black or African American11 2.2% American Indian / Alaska Native19 2.5% Asian212 2.3% Other race551 5.6% Two or more races850 5.4% White alone, not Hispanic / Latino635 2.2% Hispanic or LatinoMoved from abroad 33 0.1% White34 4.4% Asian16 0.2% Other race13 0.1% Two or more races25 0.2% White alone, not Hispanic / Latino46 0.2% Hispanic or Latino
Children Nativity (place of birth) in Roswell
Children under 6 years - Living with two parents Both parents native 1,072 100.0% NativeBoth parents foreign-born 262 100.0% NativeOne native, one foreign-born parent 334 100.0% NativeChildren under 6 years - Living with one parent Native parent 1,466 100.0% NativeForeign-born parent 29 100.0% NativeChildren 6 to 17 years - Living with two parents Both parents native 2,443 99.1% Native22 0.9% Foreign-bornBoth parents foreign-born 573 86.8% Native87 13.2% Foreign-bornOne native, one foreign-born parent 446 100.0% NativeChildren 6 to 17 years - Living with one parent Native parent 3,130 100.0% NativeForeign-born parent 594 51.6% Native556 48.4% Foreign-born
Grandparents responsible for own grandchildren in Roswell
Grandparents (30 to 59 years) White / Caucasian 275 59.3% Responsible for grandchildren188 40.7% Not responsible for grandchildrenAsian 13 100.0% Not responsible for grandchildrenOther race 27 31.0% Responsible for grandchildren60 69.0% Not responsible for grandchildrenTwo or more races 43 29.7% Responsible for grandchildren102 70.3% Not responsible for grandchildrenWhite alone, not Hispanic / Latino 78 32.5% Responsible for grandchildren162 67.5% Not responsible for grandchildrenHispanic or Latino 210 50.2% Responsible for grandchildren208 49.8% Not responsible for grandchildrenGrandparents (60 years and over) White / Caucasian 20 8.1% Responsible for grandchildren225 91.9% Not responsible for grandchildrenAsian 41 100.0% Not responsible for grandchildrenOther race 59 52.4% Responsible for grandchildren54 47.6% Not responsible for grandchildrenTwo or more races 114 60.7% Responsible for grandchildren74 39.3% Not responsible for grandchildrenWhite alone, not Hispanic / Latino 25 18.7% Responsible for grandchildren108 81.3% Not responsible for grandchildrenHispanic or Latino 69 20.1% Responsible for grandchildren273 79.9% Not responsible for grandchildren