Races in Roma-Los Saenz, Texas (TX) Detailed Stats
Ancestries, Foreign-born residents, place of birth
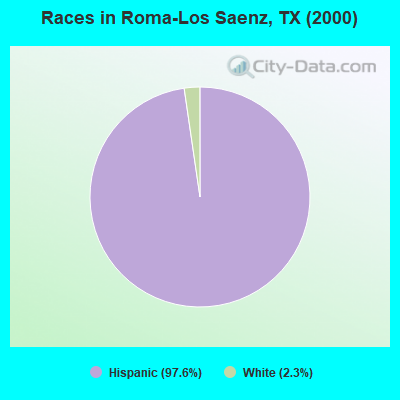
Race distribution in Roma-Los Saenz

- 17,79197.6%Hispanic
- 4282.3%White alone
- 60.03%American Indian alone
- 30.02%Asian alone
- 10.01%Two or more races
2000
2022
-
- 10,933,31352.4%White alone
- 6,669,66632.0%Hispanic
- 2,364,25511.3%Black alone
- 554,4452.7%Asian alone
- 230,5671.1%Two or more races
- 68,8590.3%American Indian alone
- 19,9580.10%Other race alone
- 10,7570.05%Native Hawaiian and Other
Pacific Islander alone

-
- 12,070,64240.2%Hispanic
- 11,683,43038.9%White alone
- 3,508,70611.7%Black alone
- 1,608,1735.4%Asian alone
- 956,5603.2%Two or more races
- 125,7630.4%Other race alone
- 47,0230.2%American Indian alone
- 29,2750.10%Native Hawaiian and Other
Pacific Islander alone

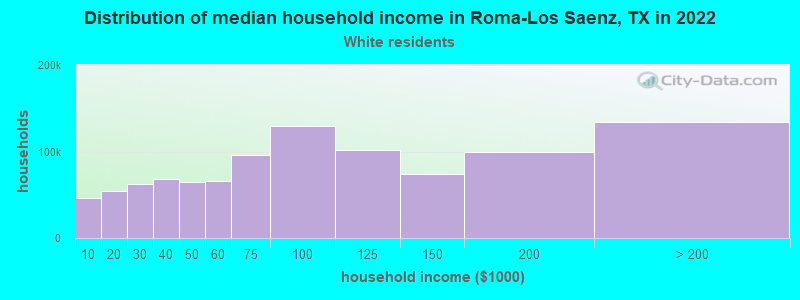
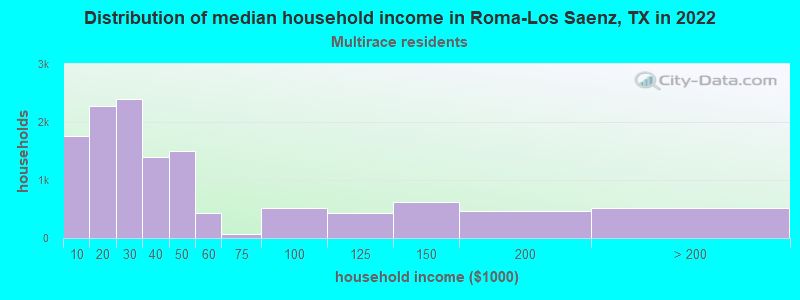
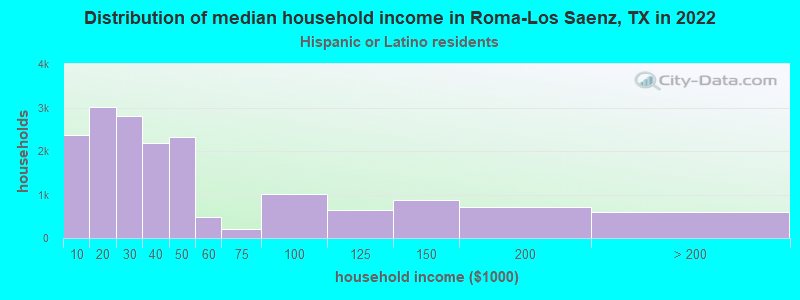
Income and house value in Roma-Los Saenz
- Median household income in 2022
- $38,216Some other race householders
- $29,055Two or more races householders
- $30,492Hispanic or Latino race householders
- Median 2022 house value
- $129,920White Non-Hispanic householders
- $120,327Some other race householders
- $131,017Two or more races householders
- $111,008Hispanic or Latino householders
Household income for White non-Hispanic householders
Household income for Two or more races householders
Household income for Hispanic or Latino race householders
Zip code: 78584