Races in River Edge, New Jersey (NJ) Detailed Stats
Data:
Races - White alone (%)
Races - White alone (% change since 2000)
Races - Black alone (%)
Races - Black alone (% change since 2000)
Races - American Indian alone (%)
Races - American Indian alone (% change since 2000)
Races - Asian alone (%)
Races - Asian alone (% change since 2000)
Races - Hispanic (%)
Races - Hispanic (% change since 2000)
Races - Native Hawaiian and Other Pacific Islander alone (%)
Races - Native Hawaiian and Other Pacific Islander alone (% change since 2000)
Races - Two or more races(%)
Races - Two or more races(% change since 2000)
Races - Other race alone (%)
Races - Other race alone (% change since 2000)
Racial diversity
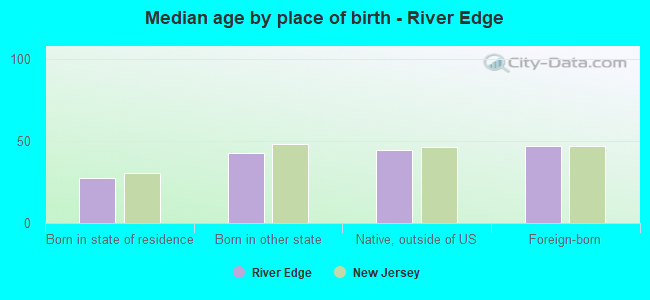
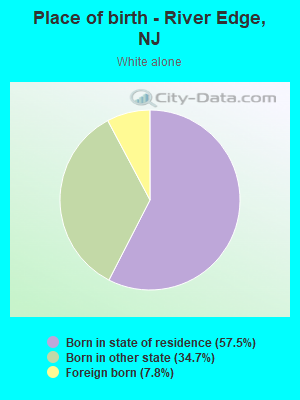
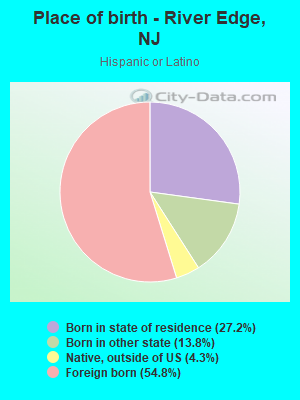
Place of birth - Born in state of residence (%)
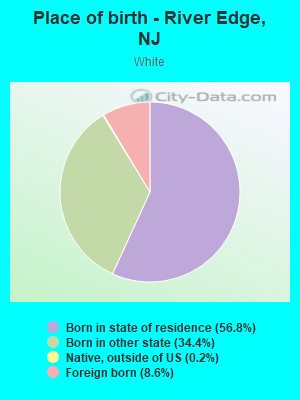
Place of birth - Born in state of residence (%) - White
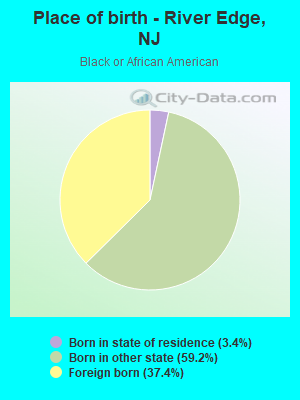
Place of birth - Born in state of residence (%) - Black or African American
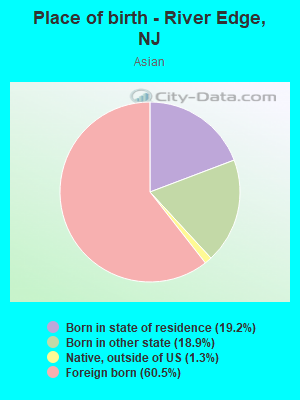
Place of birth - Born in state of residence (%) - Asian
Place of birth - Born in state of residence (%) - Hispanic or Latino
Place of birth - Born in state of residence (%) - American Indian and Alaska Native
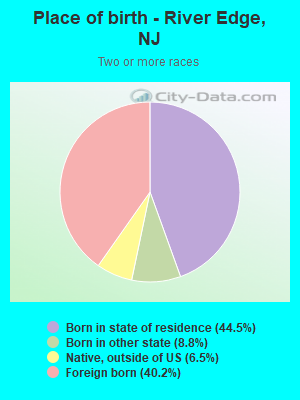
Place of birth - Born in state of residence (%) - Multirace
Place of birth - Born in state of residence (%) - Other Race
Place of birth - Born in other state (%)
Place of birth - Born in other state (%) - White
Place of birth - Born in other state (%) - Black or African American
Place of birth - Born in other state (%) - Asian
Place of birth - Born in other state (%) - Hispanic or Latino
Place of birth - Born in other state (%) - American Indian and Alaska Native
Place of birth - Born in other state (%) - Multirace
Place of birth - Born in other state (%) - Other Race
Place of birth - Native, outside of US (%)
Place of birth - Native, outside of US (%) - White
Place of birth - Native, outside of US (%) - Black or African American
Place of birth - Native, outside of US (%) - Asian
Place of birth - Native, outside of US (%) - Hispanic or Latino
Place of birth - Native, outside of US (%) - American Indian and Alaska Native
Place of birth - Native, outside of US (%) - Multirace
Place of birth - Native, outside of US (%) - Other Race
Place of birth - Foreign born (%)
Place of birth - Foreign born (%) - White
Place of birth - Foreign born (%) - Black or African American
Place of birth - Foreign born (%) - Asian
Place of birth - Foreign born (%) - Hispanic or Latino
Place of birth - Foreign born (%) - American Indian and Alaska Native
Place of birth - Foreign born (%) - Multirace
Place of birth - Foreign born (%) - Other Race
Residents speaking English at home (%)
Residents speaking English at home - Born in the United States (%)
Residents speaking English at home - Native, born elsewhere (%)
Residents speaking English at home - Foreign born (%)
Residents speaking Spanish at home (%)
Residents speaking Spanish at home - Born in the United States (%)
Residents speaking Spanish at home - Native, born elsewhere (%)
Residents speaking Spanish at home - Foreign born (%)
Residents speaking other language at home (%)
Residents speaking other language at home - Born in the United States (%)
Residents speaking other language at home - Native, born elsewhere (%)
Residents speaking other language at home - Foreign born (%)
Marital status - Never married (%)
Marital status - Now married (%)
Marital status - Separated (%)
Marital status - Widowed (%)
Marital status - Divorced (%)
Ancestries Reported - Arab (%)
Ancestries Reported - Czech (%)
Ancestries Reported - Danish (%)
Ancestries Reported - Dutch (%)
Ancestries Reported - English (%)
Ancestries Reported - French (%)
Ancestries Reported - French Canadian (%)
Ancestries Reported - German (%)
Ancestries Reported - Greek (%)
Ancestries Reported - Hungarian (%)
Ancestries Reported - Irish (%)
Ancestries Reported - Italian (%)
Ancestries Reported - Lithuanian (%)
Ancestries Reported - Norwegian (%)
Ancestries Reported - Polish (%)
Ancestries Reported - Portuguese (%)
Ancestries Reported - Russian (%)
Ancestries Reported - Scotch-Irish (%)
Ancestries Reported - Scottish (%)
Ancestries Reported - Slovak (%)
Ancestries Reported - Subsaharan African (%)
Ancestries Reported - Swedish (%)
Ancestries Reported - Swiss (%)
Ancestries Reported - Ukrainian (%)
Ancestries Reported - United States (%)
Ancestries Reported - Welsh (%)
Ancestries Reported - West Indian (%)
Ancestries Reported - Other (%)
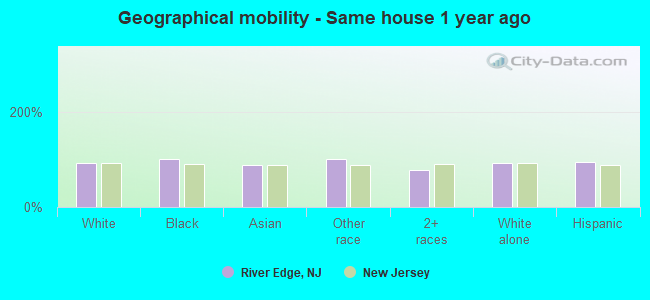
Geographical mobility - Same house 1 year ago (%)
Geographical mobility - Same house 1 year ago (%) - White
Geographical mobility - Same house 1 year ago (%) - Black or African American
Geographical mobility - Same house 1 year ago (%) - Asian
Geographical mobility - Same house 1 year ago (%) - Hispanic or Latino
Geographical mobility - Same house 1 year ago (%) - American Indian and Alaska Native
Geographical mobility - Same house 1 year ago (%) - Multirace
Geographical mobility - Same house 1 year ago (%) - Other Race
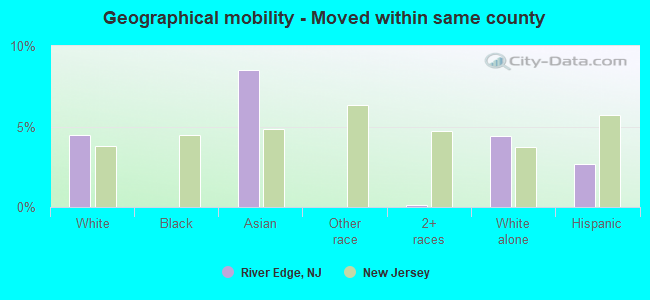
Geographical mobility - Moved within same county (%)
Geographical mobility - Moved within same county (%) - White
Geographical mobility - Moved within same county (%) - Black or African American
Geographical mobility - Moved within same county (%) - Asian
Geographical mobility - Moved within same county (%) - Hispanic or Latino
Geographical mobility - Moved within same county (%) - American Indian and Alaska Native
Geographical mobility - Moved within same county (%) - Multirace
Geographical mobility - Moved within same county (%) - Other Race
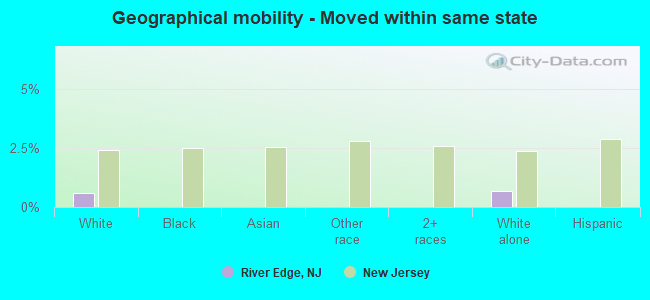
Geographical mobility - Moved from different county within same state (%)
Geographical mobility - Moved from different county within same state (%) - White
Geographical mobility - Moved from different county within same state (%) - Black or African American
Geographical mobility - Moved from different county within same state (%) - Asian
Geographical mobility - Moved from different county within same state (%) - Hispanic or Latino
Geographical mobility - Moved from different county within same state (%) - American Indian and Alaska Native
Geographical mobility - Moved from different county within same state (%) - Multirace
Geographical mobility - Moved from different county within same state (%) - Other Race
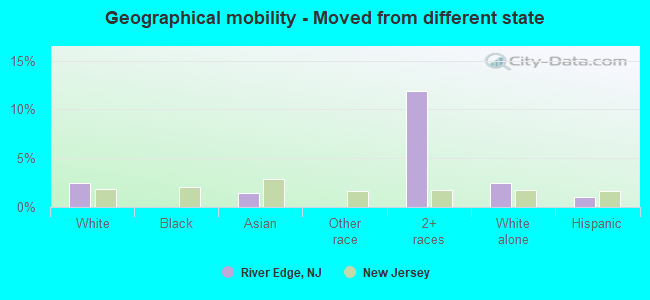
Geographical mobility - Moved from different state (%)
Geographical mobility - Moved from different state (%) - White
Geographical mobility - Moved from different state (%) - Black or African American
Geographical mobility - Moved from different state (%) - Asian
Geographical mobility - Moved from different state (%) - Hispanic or Latino
Geographical mobility - Moved from different state (%) - American Indian and Alaska Native
Geographical mobility - Moved from different state (%) - Multirace
Geographical mobility - Moved from different state (%) - Other Race
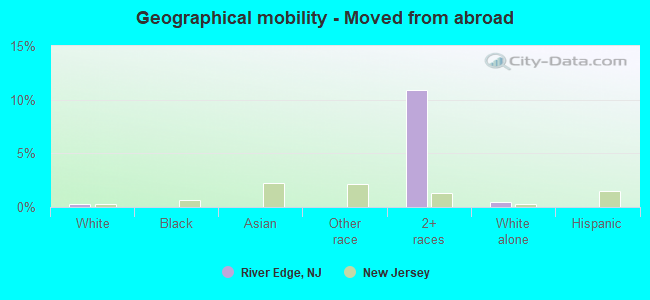
Geographical mobility - Moved from abroad (%)
Geographical mobility - Moved from abroad (%) - White
Geographical mobility - Moved from abroad (%) - Black or African American
Geographical mobility - Moved from abroad (%) - Asian
Geographical mobility - Moved from abroad (%) - Hispanic or Latino
Geographical mobility - Moved from abroad (%) - American Indian and Alaska Native
Geographical mobility - Moved from abroad (%) - Multirace
Geographical mobility - Moved from abroad (%) - Other Race
Place of birth for the foreign-born population - Ireland (%)
Place of birth for the foreign-born population - Denmark (%)
Place of birth for the foreign-born population - Norway (%)
Place of birth for the foreign-born population - Sweden (%)
Place of birth for the foreign-born population - United Kingdom (%)
Place of birth for the foreign-born population - England (%)
Place of birth for the foreign-born population - Scotland (%)
Place of birth for the foreign-born population - Other Northern Europe (%)
Place of birth for the foreign-born population - Austria (%)
Place of birth for the foreign-born population - Belgium (%)
Place of birth for the foreign-born population - France (%)
Place of birth for the foreign-born population - Germany (%)
Place of birth for the foreign-born population - Netherlands (%)
Place of birth for the foreign-born population - Switzerland (%)
Place of birth for the foreign-born population - Other Western Europe (%)
Place of birth for the foreign-born population - Greece (%)
Place of birth for the foreign-born population - Italy (%)
Place of birth for the foreign-born population - Portugal (%)
Place of birth for the foreign-born population - Spain (%)
Place of birth for the foreign-born population - Other Southern Europe (%)
Place of birth for the foreign-born population - Albania (%)
Place of birth for the foreign-born population - Belarus (%)
Place of birth for the foreign-born population - Bosnia and Herzegovina (%)
Place of birth for the foreign-born population - Bulgaria (%)
Place of birth for the foreign-born population - Croatia (%)
Place of birth for the foreign-born population - Czechoslovakia (%)
Place of birth for the foreign-born population - Hungary (%)
Place of birth for the foreign-born population - Latvia (%)
Place of birth for the foreign-born population - Lithuania (%)
Place of birth for the foreign-born population - North Macedonia (Macedonia) (%)
Place of birth for the foreign-born population - Moldova (%)
Place of birth for the foreign-born population - Poland (%)
Place of birth for the foreign-born population - Romania (%)
Place of birth for the foreign-born population - Russia (%)
Place of birth for the foreign-born population - Serbia (%)
Place of birth for the foreign-born population - Ukraine (%)
Place of birth for the foreign-born population - Other Eastern Europe (%)
Place of birth for the foreign-born population - China (%)
Place of birth for the foreign-born population - Hong Kong (%)
Place of birth for the foreign-born population - Taiwan (%)
Place of birth for the foreign-born population - Japan (%)
Place of birth for the foreign-born population - Korea (%)
Place of birth for the foreign-born population - Other Eastern Asia (%)
Place of birth for the foreign-born population - Afghanistan (%)
Place of birth for the foreign-born population - Bangladesh (%)
Place of birth for the foreign-born population - India (%)
Place of birth for the foreign-born population - Iran (%)
Place of birth for the foreign-born population - Kazakhstan (%)
Place of birth for the foreign-born population - Nepal (%)
Place of birth for the foreign-born population - Pakistan (%)
Place of birth for the foreign-born population - Sri Lanka (%)
Place of birth for the foreign-born population - Uzbekistan (%)
Place of birth for the foreign-born population - Other South Central Asia (%)
Place of birth for the foreign-born population - Burma (%)
Place of birth for the foreign-born population - Cambodia (%)
Place of birth for the foreign-born population - Indonesia (%)
Place of birth for the foreign-born population - Laos (%)
Place of birth for the foreign-born population - Malaysia (%)
Place of birth for the foreign-born population - Philippines (%)
Place of birth for the foreign-born population - Singapore (%)
Place of birth for the foreign-born population - Thailand (%)
Place of birth for the foreign-born population - Vietnam (%)
Place of birth for the foreign-born population - Other South Eastern Asia (%)
Place of birth for the foreign-born population - Armenia (%)
Place of birth for the foreign-born population - Iraq (%)
Place of birth for the foreign-born population - Israel (%)
Place of birth for the foreign-born population - Jordan (%)
Place of birth for the foreign-born population - Kuwait (%)
Place of birth for the foreign-born population - Lebanon (%)
Place of birth for the foreign-born population - Saudi Arabia (%)
Place of birth for the foreign-born population - Syria (%)
Place of birth for the foreign-born population - Turkey (%)
Place of birth for the foreign-born population - Yemen (%)
Place of birth for the foreign-born population - Other Western Asia (%)
Place of birth for the foreign-born population - Eritrea (%)
Place of birth for the foreign-born population - Ethiopia (%)
Place of birth for the foreign-born population - Kenya (%)
Place of birth for the foreign-born population - Somalia (%)
Place of birth for the foreign-born population - Uganda (%)
Place of birth for the foreign-born population - Zimbabwe (%)
Place of birth for the foreign-born population - Other Eastern Africa (%)
Place of birth for the foreign-born population - Cameroon (%)
Place of birth for the foreign-born population - Congo (%)
Place of birth for the foreign-born population - Democratic Republic of Congo (Zaire) (%)
Place of birth for the foreign-born population - Other Middle Africa (%)
Place of birth for the foreign-born population - Egypt (%)
Place of birth for the foreign-born population - Morocco (%)
Place of birth for the foreign-born population - Sudan (%)
Place of birth for the foreign-born population - Other Northern Africa (%)
Place of birth for the foreign-born population - South Africa (%)
Place of birth for the foreign-born population - Other Southern Africa (%)
Place of birth for the foreign-born population - Cabo Verde (%)
Place of birth for the foreign-born population - Ghana (%)
Place of birth for the foreign-born population - Liberia (%)
Place of birth for the foreign-born population - Nigeria (%)
Place of birth for the foreign-born population - Senegal (%)
Place of birth for the foreign-born population - Sierra Leone (%)
Place of birth for the foreign-born population - Other Western Africa (%)
Place of birth for the foreign-born population - Australia (%)
Place of birth for the foreign-born population - New Zealand (%)
Place of birth for the foreign-born population - Fiji (%)
Place of birth for the foreign-born population - Micronesia (%)
Place of birth for the foreign-born population - Bahamas (%)
Place of birth for the foreign-born population - Barbados (%)
Place of birth for the foreign-born population - Cuba (%)
Place of birth for the foreign-born population - Dominica (%)
Place of birth for the foreign-born population - Dominican Republic (%)
Place of birth for the foreign-born population - Grenada (%)
Place of birth for the foreign-born population - Haiti (%)
Place of birth for the foreign-born population - Jamaica (%)
Place of birth for the foreign-born population - St. Vincent and the Grenadines (%)
Place of birth for the foreign-born population - Trinidad and Tobago (%)
Place of birth for the foreign-born population - West Indies (%)
Place of birth for the foreign-born population - Other Caribbean (%)
Place of birth for the foreign-born population - Belize (%)
Place of birth for the foreign-born population - Costa Rica (%)
Place of birth for the foreign-born population - El Salvador (%)
Place of birth for the foreign-born population - Guatemala (%)
Place of birth for the foreign-born population - Honduras (%)
Place of birth for the foreign-born population - Mexico (%)
Place of birth for the foreign-born population - Nicaragua (%)
Place of birth for the foreign-born population - Panama (%)
Place of birth for the foreign-born population - Other Central America (%)
Place of birth for the foreign-born population - Argentina (%)
Place of birth for the foreign-born population - Bolivia (%)
Place of birth for the foreign-born population - Brazil (%)
Place of birth for the foreign-born population - Chile (%)
Place of birth for the foreign-born population - Colombia (%)
Place of birth for the foreign-born population - Ecuador (%)
Place of birth for the foreign-born population - Guyana (%)
Place of birth for the foreign-born population - Peru (%)
Place of birth for the foreign-born population - Uruguay (%)
Place of birth for the foreign-born population - Venezuela (%)
Place of birth for the foreign-born population - Other South America (%)
Place of birth for the foreign-born population - Canada (%)
Place of birth for the foreign-born population - Other Northern America (%)
Place of birth for the foreign-born population - Other (%)
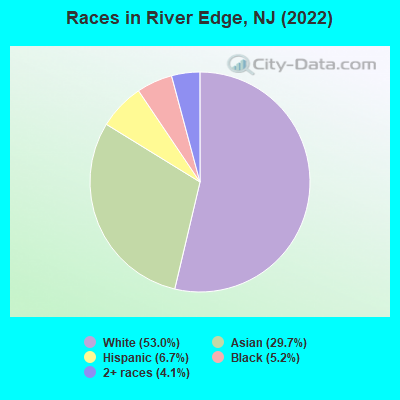
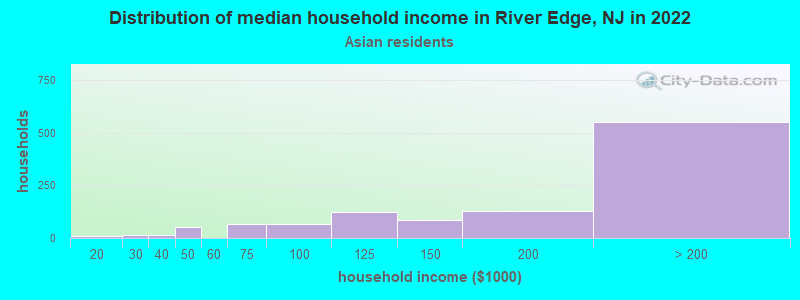
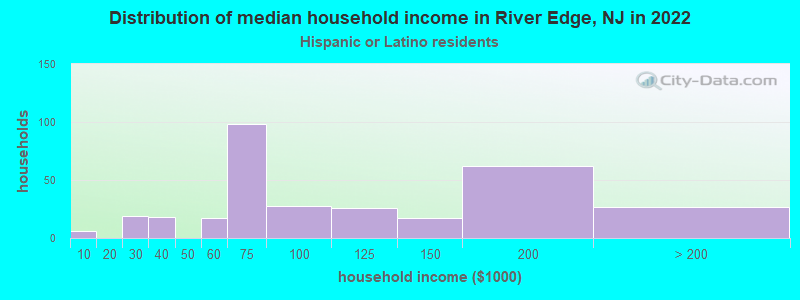
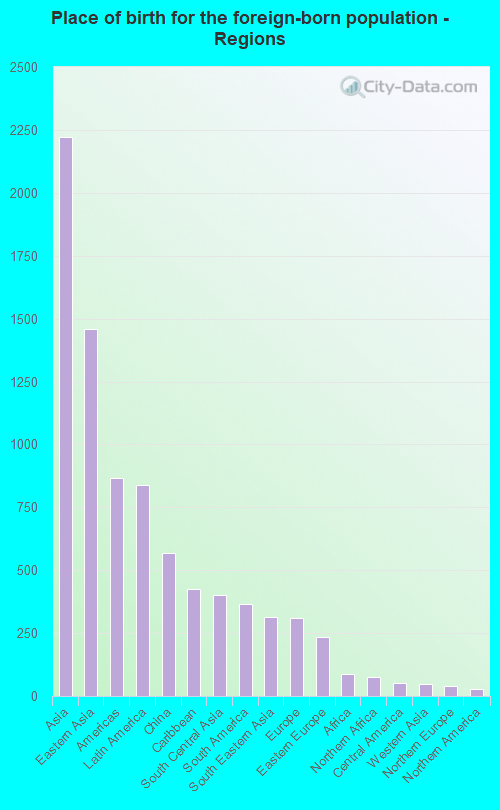
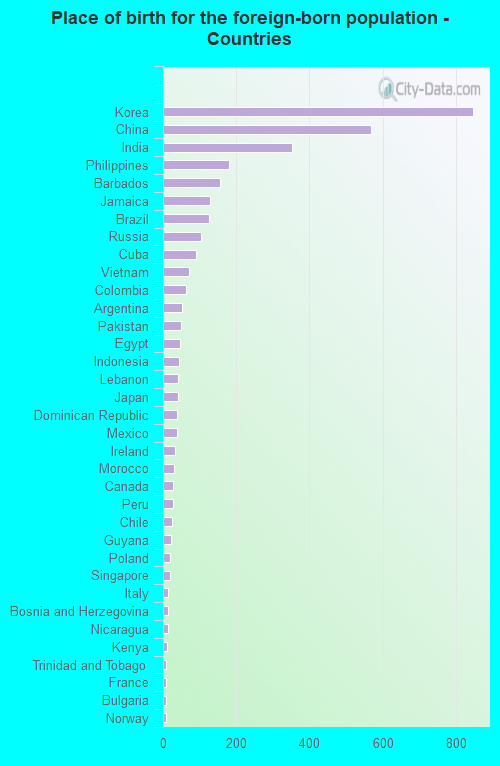
According to 2022 data, the most numerous races in River Edge, NJ are White alone (6,370 residents), Hispanic (810 residents), and Black alone (620 residents). 63.0% of River Edge residents speak English at home. 29.1% of River Edge, NJ residents are foreign-born (18.0% born in Asia, 6.8% born in Latin America), which is 20.8% greater than the foreign-born rate of 23.0% across the entire state of New Jersey.
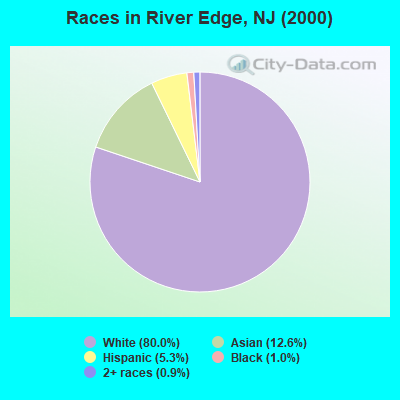
Race distribution in River Edge
2000 2022
5,557,209 66.0% White alone 1,117,191 13.3% Hispanic 1,096,171 13.0% Black alone 477,012 5.7% Asian alone 133,689 1.6% Two or more races 19,565 0.2% Other race alone 11,338 0.1% American Indian alone 2,175 0.03% Native Hawaiian and Other
4,766,476 51.5% White alone 2,028,470 21.9% Hispanic 1,111,632 12.0% Black alone 923,546 10.0% Asian alone 332,237 3.6% Two or more races 89,847 1.0% Other race alone 8,557 0.09% American Indian alone 934 0.01% Native Hawaiian and Other
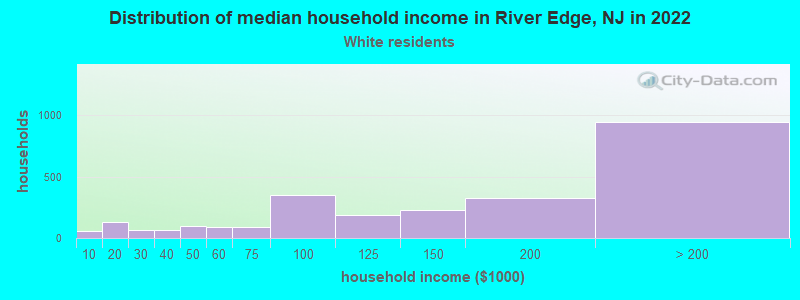
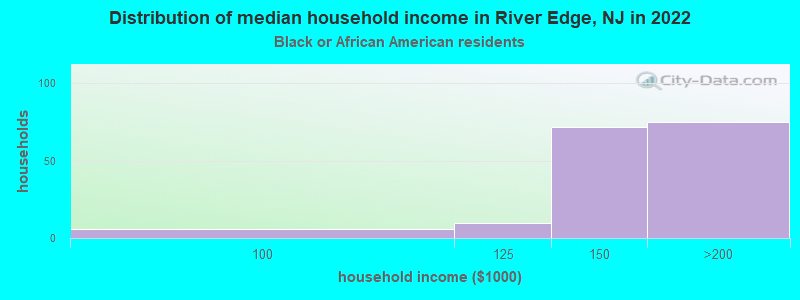
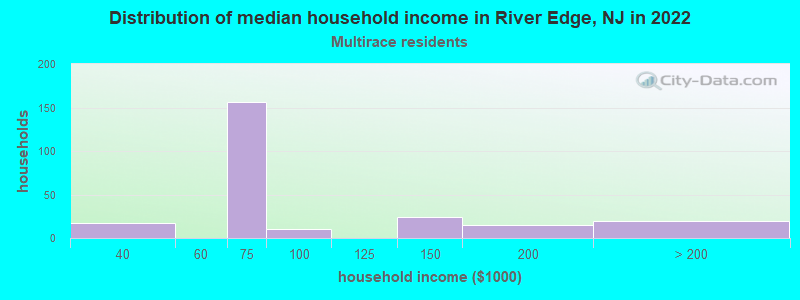
Income and house value in River Edge Median household income in 2022 $139,834 White non-Hispanic householders$148,833 Black householders$170,148 Asian householders$70,739 Two or more races householders$83,535 Hispanic or Latino race householdersMedian 2022 house value $643,521 White Non-Hispanic householders$351,966 Black or African American householders$479,953 American Indian or Alaska Native householders $708,539 Asian householders$605,381 Some other race householders$479,953 Two or more races householders$652,225 Hispanic or Latino householders
Median age by race in River Edge
47.7 Median age for White residents45.8 49.6 39.9 Median age for Black or African American residents40.0 53.4 -766,197,182.3 Median age for American Indian / Alaska Native residents-686,322,685.6 -753,722,794.2 39.4 Median age for Asian residents36.3 41.2 -510,460,250.5 Median age for Native Hawaiian / Pacific Islander residents-514,767,932.0 -713,070,378.3 -664,772,726.6 Median age for Other race residents-670,531,400.3 -659,300,183.5 19.7 Median age for Two or more races residents17.5 31.5 46.8 Median age for White alone residents45.5 50.1 38.6 Median age for Hispanic or Latino residents46.2 36.4
Owner/renter occupied households by race in River Edge
House owners and renters - White residents 2,189 81.5% Owner occupied498 18.5% Renter occupiedHouse owners and renters - Black or African American residents 148 90.3% Owner occupied16 9.7% Renter occupiedHouse owners and renters - Asian residents 935 80.3% Owner occupied230 19.7% Renter occupiedHouse owners and renters - Other race residents 21 100.0% Renter occupiedHouse owners and renters - Two or more races residents 55 25.8% Owner occupied159 74.2% Renter occupiedHouse owners and renters - White alone residents 2,239 82.5% Owner occupied474 17.5% Renter occupiedHouse owners and renters - Hispanic or Latino residents 87 28.9% Owner occupied213 71.1% Renter occupied
Language usage in River Edge
English speakers - Total 63.0% of residents of River Edge speak English at home.
4.5% of residents speak Spanish at home 379 74.2% Speak English very well132 25.8% Speak English less than very well31.5% of residents speak other language at home 2,250 62.5% Speak English very well1,351 37.5% Speak English less than very well
English speakers - Born in the United States 83.1% of residents of River Edge speak English at home.
2.4% of residents speak Spanish at home 82 100.0% Speak English very well12.9% of residents speak other language at home 417 96.1% Speak English very well17 3.9% Speak English less than very well
English speakers - Native, born elsewhere 8.7% of residents of River Edge speak English at home.
17.3% of residents speak Spanish at home 10 45.5% Speak English very well12 54.5% Speak English less than very well61.4% of residents speak other language at home 48 61.5% Speak English very well30 38.5% Speak English less than very well
English speakers - Foreign-born 20.6% of residents of River Edge speak English at home.
8.4% of residents speak Spanish at home 233 79.3% Speak English very well61 20.7% Speak English less than very well69.3% of residents speak other language at home 1,409 58.3% Speak English very well1,007 41.7% Speak English less than very well
White (Caucasian) - Speak only English Native:
97.2% (5,261)Foreign-born:
34.7% (191)
White (Caucasian) - Speak another language Native:
4.6% (249)Foreign-born:
68.3% (376)
Black or African American - Speak only English Native:
99.9% (358)Foreign-born:
100.0% (239)
Asian - Speak only English Native:
28.1% (362)Foreign-born:
9.9% (213)
Asian - Speak another language Native:
71.0% (913)Foreign-born:
90.1% (1,935)
Two or more races - Speak only English Native:
74.4% (411)Foreign-born:
4.6% (19)
Two or more races - Speak another language Native:
23.5% (130)Foreign-born:
96.5% (393)
White alone - Speak only English Native:
96.1% (5,277)Foreign-born:
23.8% (119)
White alone - Speak another language Native:
4.1% (227)Foreign-born:
76.1% (381)
Hispanic or Latino - Speak only English Native:
54.9% (184)Foreign-born:
23.6% (105)
Hispanic or Latino - Speak another language Native:
41.7% (140)Foreign-born:
78.7% (350)
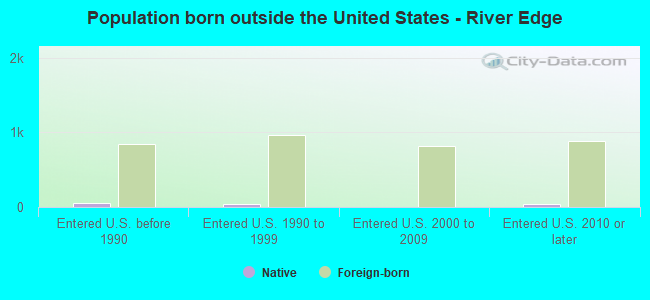
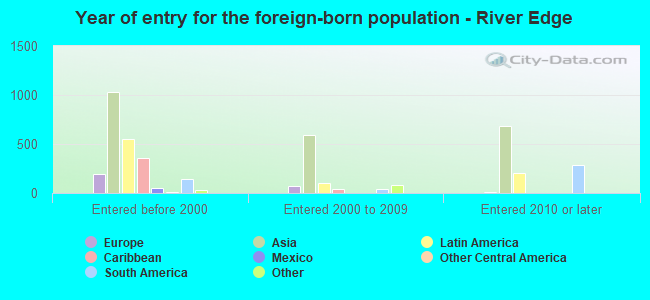
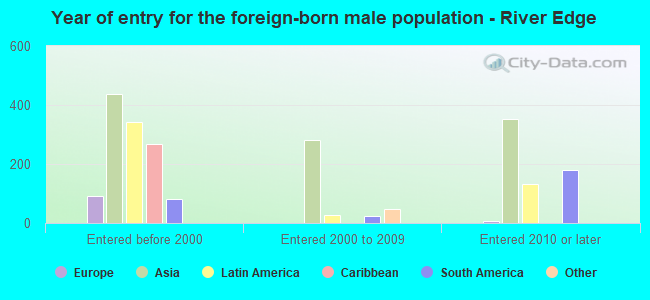
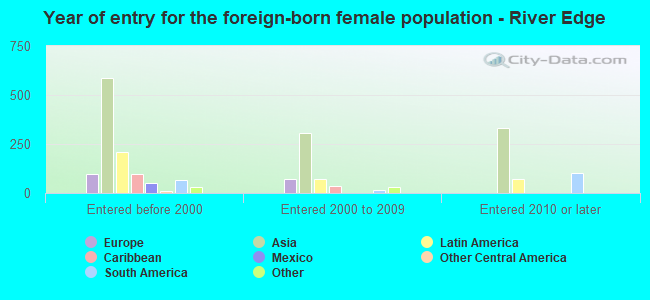
Foreign-born residents in River Edge 3,492 residents are foreign born (18.0% Asia , 6.8% Latin America ).
This city:
29.1%New Jersey:
23.2%
Marital status for residents in River Edge Marital status - White (Caucasian) population 15 years and over
Males 28.3% Never married66.7% Now married0.0% Separated0.9% Widowed4.1% DivorcedFemales 20.0% Never married59.2% Now married0.8% Separated12.0% Widowed8.1% DivorcedWomen who gave birth in the past 12 months Now married:
100.0% (99)Unmarried:
0.0% (0)
Women who did not give birth in the past 12 months Now married:
51.7% (505)Unmarried:
48.3% (472)
Marital status - Black or African American population 15 years and over
Males 43.0% Never married53.9% Now married3.2% Separated0.0% Widowed0.0% DivorcedFemales 6.7% Never married87.2% Now married0.0% Separated0.0% Widowed6.0% DivorcedWomen who did not give birth in the past 12 months Now married:
85.1% (59)Unmarried:
14.9% (10)
Marital status - Asian population 15 years and over
Males 28.7% Never married71.3% Now married0.0% Separated0.0% Widowed0.0% DivorcedFemales 13.5% Never married77.7% Now married2.2% Separated2.5% Widowed4.2% DivorcedWomen who gave birth in the past 12 months Now married:
100.0% (40)Unmarried:
0.0% (0)
Women who did not give birth in the past 12 months Now married:
80.3% (817)Unmarried:
19.7% (200)
Marital status - Two or more races population 15 years and over
Males 27.7% Never married72.3% Now married0.0% Separated0.0% Widowed0.0% DivorcedFemales 19.9% Never married75.6% Now married0.0% Separated0.0% Widowed4.5% DivorcedWomen who gave birth in the past 12 months Now married:
100.0% (31)Unmarried:
0.0% (0)
Women who did not give birth in the past 12 months Now married:
74.6% (155)Unmarried:
25.4% (53)
Marital status - White alone, not Hispanic / Latino population 15 years and over
Males 28.5% Never married66.2% Now married0.0% Separated0.9% Widowed4.4% DivorcedFemales 18.7% Never married60.2% Now married0.8% Separated12.6% Widowed7.6% DivorcedWomen who gave birth in the past 12 months Now married:
100.0% (102)Unmarried:
0.0% (0)
Women who did not give birth in the past 12 months Now married:
53.3% (522)Unmarried:
46.7% (457)
Marital status - Hispanic or Latino population 15 years and over
Males 16.7% Never married78.4% Now married0.0% Separated0.0% Widowed4.8% DivorcedFemales 28.6% Never married57.6% Now married0.0% Separated2.9% Widowed10.9% DivorcedWomen who gave birth in the past 12 months Now married:
100.0% (13)Unmarried:
0.0% (0)
Women who did not give birth in the past 12 months Now married:
53.1% (125)Unmarried:
46.9% (111)
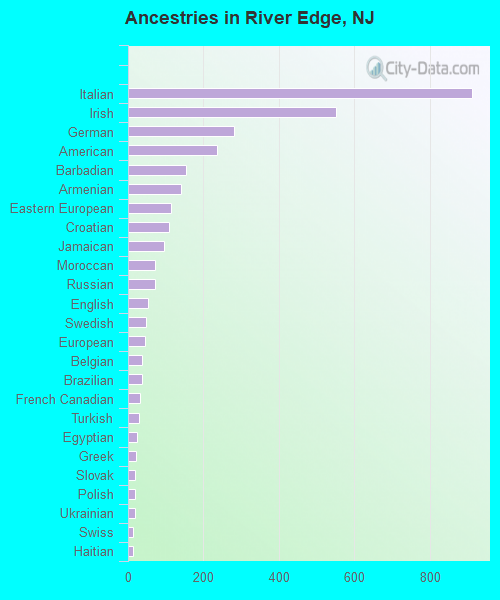
Ancestries in River Edge
911 13.6% Italian550 8.2% Irish282 4.2% German236 3.5% American153 2.3% Barbadian140 2.1% Armenian113 1.7% Eastern European108 1.6% Croatian95 1.4% Jamaican72 1.1% Moroccan71 1.1% Russian54 0.8% English47 0.7% Swedish45 0.7% European38 0.6% Belgian36 0.5% Brazilian32 0.5% French Canadian29 0.4% Turkish24 0.4% Egyptian21 0.3% Greek19 0.3% Slovak18 0.3% Polish18 0.3% Ukrainian14 0.2% Swiss14 0.2% Haitian8 0.1% Afghan8 0.1% Syrian8 0.1% Scottish5 0.07% Norwegian
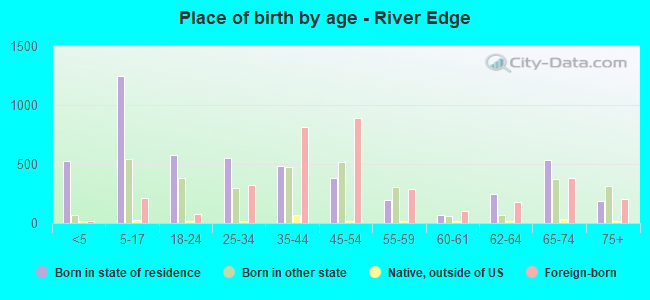
Children Nativity (place of birth) in River Edge
Children under 6 years - Living with two parents Both parents native 353 100.0% NativeBoth parents foreign-born 142 100.0% NativeOne native, one foreign-born parent 166 100.0% NativeChildren under 6 years - Living with one parent Native parent 33 100.0% NativeChildren 6 to 17 years - Living with two parents Both parents native 594 97.5% Native15 2.5% Foreign-bornBoth parents foreign-born 439 69.3% Native194 30.7% Foreign-bornOne native, one foreign-born parent 457 100.0% NativeChildren 6 to 17 years - Living with one parent Native parent 104 100.0% NativeForeign-born parent 105 49.5% Native107 50.5% Foreign-born