Races in Purcellville, Virginia (VA) Detailed Stats
Data:
Races - White alone (%)
Races - White alone (% change since 2000)
Races - Black alone (%)
Races - Black alone (% change since 2000)
Races - American Indian alone (%)
Races - American Indian alone (% change since 2000)
Races - Asian alone (%)
Races - Asian alone (% change since 2000)
Races - Hispanic (%)
Races - Hispanic (% change since 2000)
Races - Native Hawaiian and Other Pacific Islander alone (%)
Races - Native Hawaiian and Other Pacific Islander alone (% change since 2000)
Races - Two or more races(%)
Races - Two or more races(% change since 2000)
Races - Other race alone (%)
Races - Other race alone (% change since 2000)
Racial diversity
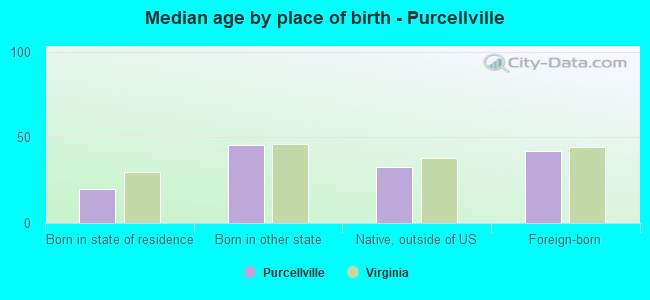
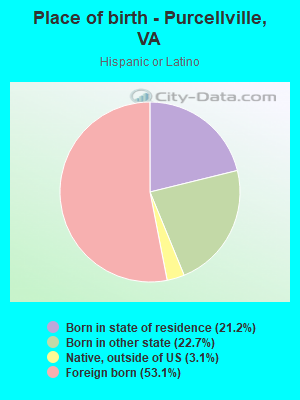
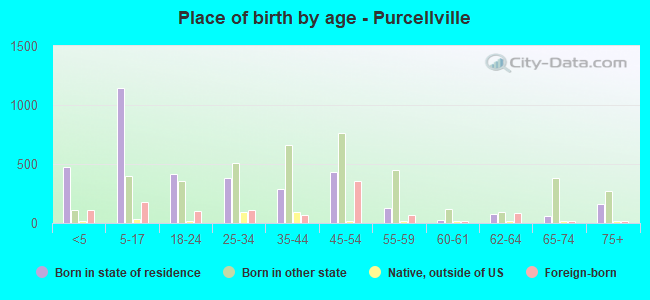
Place of birth - Born in state of residence (%)
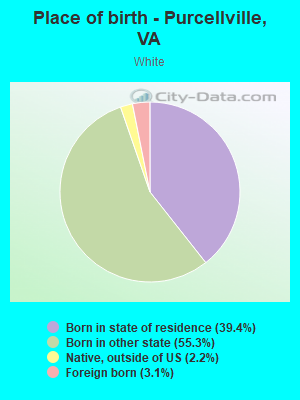
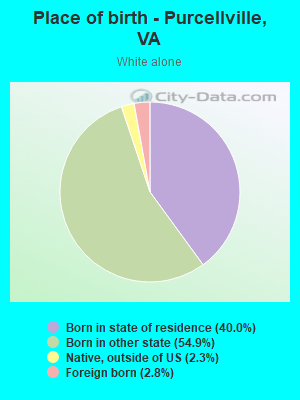
Place of birth - Born in state of residence (%) - White
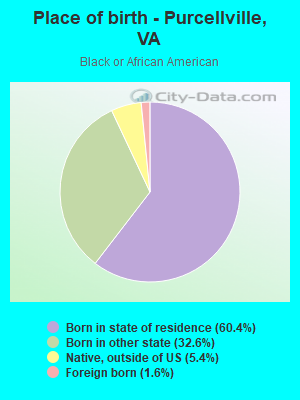
Place of birth - Born in state of residence (%) - Black or African American
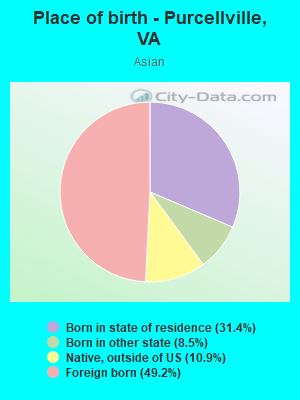
Place of birth - Born in state of residence (%) - Asian
Place of birth - Born in state of residence (%) - Hispanic or Latino
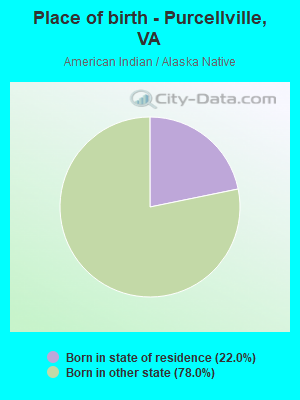
Place of birth - Born in state of residence (%) - American Indian and Alaska Native
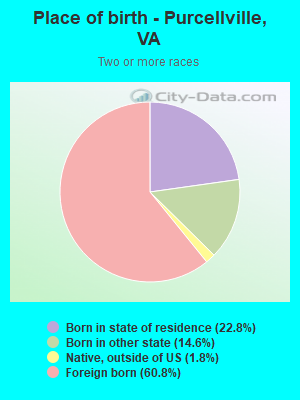
Place of birth - Born in state of residence (%) - Multirace
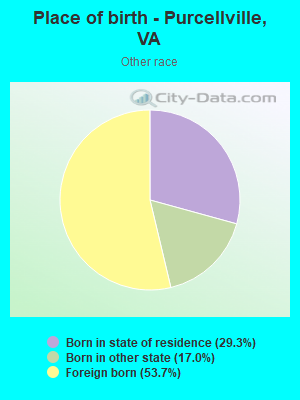
Place of birth - Born in state of residence (%) - Other Race
Place of birth - Born in other state (%)
Place of birth - Born in other state (%) - White
Place of birth - Born in other state (%) - Black or African American
Place of birth - Born in other state (%) - Asian
Place of birth - Born in other state (%) - Hispanic or Latino
Place of birth - Born in other state (%) - American Indian and Alaska Native
Place of birth - Born in other state (%) - Multirace
Place of birth - Born in other state (%) - Other Race
Place of birth - Native, outside of US (%)
Place of birth - Native, outside of US (%) - White
Place of birth - Native, outside of US (%) - Black or African American
Place of birth - Native, outside of US (%) - Asian
Place of birth - Native, outside of US (%) - Hispanic or Latino
Place of birth - Native, outside of US (%) - American Indian and Alaska Native
Place of birth - Native, outside of US (%) - Multirace
Place of birth - Native, outside of US (%) - Other Race
Place of birth - Foreign born (%)
Place of birth - Foreign born (%) - White
Place of birth - Foreign born (%) - Black or African American
Place of birth - Foreign born (%) - Asian
Place of birth - Foreign born (%) - Hispanic or Latino
Place of birth - Foreign born (%) - American Indian and Alaska Native
Place of birth - Foreign born (%) - Multirace
Place of birth - Foreign born (%) - Other Race
Residents speaking English at home (%)
Residents speaking English at home - Born in the United States (%)
Residents speaking English at home - Native, born elsewhere (%)
Residents speaking English at home - Foreign born (%)
Residents speaking Spanish at home (%)
Residents speaking Spanish at home - Born in the United States (%)
Residents speaking Spanish at home - Native, born elsewhere (%)
Residents speaking Spanish at home - Foreign born (%)
Residents speaking other language at home (%)
Residents speaking other language at home - Born in the United States (%)
Residents speaking other language at home - Native, born elsewhere (%)
Residents speaking other language at home - Foreign born (%)
Marital status - Never married (%)
Marital status - Now married (%)
Marital status - Separated (%)
Marital status - Widowed (%)
Marital status - Divorced (%)
Ancestries Reported - Arab (%)
Ancestries Reported - Czech (%)
Ancestries Reported - Danish (%)
Ancestries Reported - Dutch (%)
Ancestries Reported - English (%)
Ancestries Reported - French (%)
Ancestries Reported - French Canadian (%)
Ancestries Reported - German (%)
Ancestries Reported - Greek (%)
Ancestries Reported - Hungarian (%)
Ancestries Reported - Irish (%)
Ancestries Reported - Italian (%)
Ancestries Reported - Lithuanian (%)
Ancestries Reported - Norwegian (%)
Ancestries Reported - Polish (%)
Ancestries Reported - Portuguese (%)
Ancestries Reported - Russian (%)
Ancestries Reported - Scotch-Irish (%)
Ancestries Reported - Scottish (%)
Ancestries Reported - Slovak (%)
Ancestries Reported - Subsaharan African (%)
Ancestries Reported - Swedish (%)
Ancestries Reported - Swiss (%)
Ancestries Reported - Ukrainian (%)
Ancestries Reported - United States (%)
Ancestries Reported - Welsh (%)
Ancestries Reported - West Indian (%)
Ancestries Reported - Other (%)
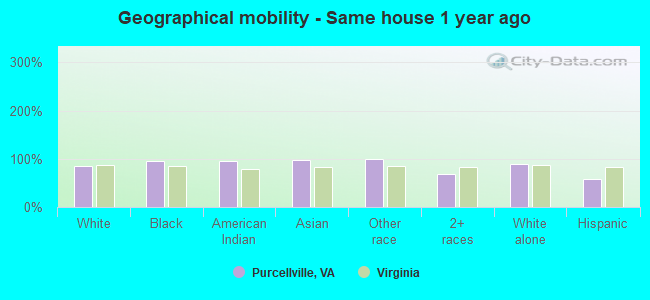
Geographical mobility - Same house 1 year ago (%)
Geographical mobility - Same house 1 year ago (%) - White
Geographical mobility - Same house 1 year ago (%) - Black or African American
Geographical mobility - Same house 1 year ago (%) - Asian
Geographical mobility - Same house 1 year ago (%) - Hispanic or Latino
Geographical mobility - Same house 1 year ago (%) - American Indian and Alaska Native
Geographical mobility - Same house 1 year ago (%) - Multirace
Geographical mobility - Same house 1 year ago (%) - Other Race
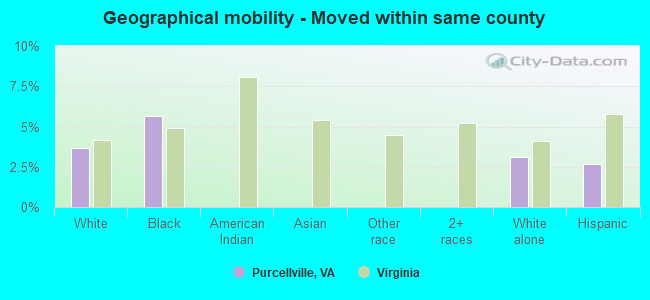
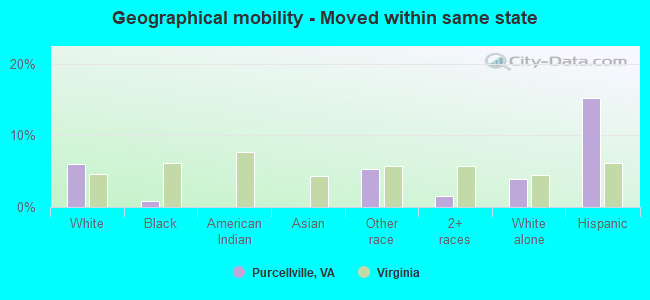
Geographical mobility - Moved within same county (%)
Geographical mobility - Moved within same county (%) - White
Geographical mobility - Moved within same county (%) - Black or African American
Geographical mobility - Moved within same county (%) - Asian
Geographical mobility - Moved within same county (%) - Hispanic or Latino
Geographical mobility - Moved within same county (%) - American Indian and Alaska Native
Geographical mobility - Moved within same county (%) - Multirace
Geographical mobility - Moved within same county (%) - Other Race
Geographical mobility - Moved from different county within same state (%)
Geographical mobility - Moved from different county within same state (%) - White
Geographical mobility - Moved from different county within same state (%) - Black or African American
Geographical mobility - Moved from different county within same state (%) - Asian
Geographical mobility - Moved from different county within same state (%) - Hispanic or Latino
Geographical mobility - Moved from different county within same state (%) - American Indian and Alaska Native
Geographical mobility - Moved from different county within same state (%) - Multirace
Geographical mobility - Moved from different county within same state (%) - Other Race
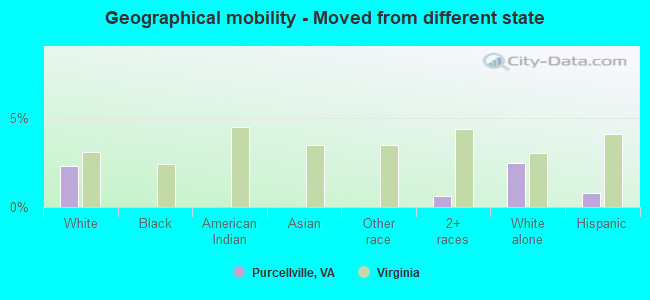
Geographical mobility - Moved from different state (%)
Geographical mobility - Moved from different state (%) - White
Geographical mobility - Moved from different state (%) - Black or African American
Geographical mobility - Moved from different state (%) - Asian
Geographical mobility - Moved from different state (%) - Hispanic or Latino
Geographical mobility - Moved from different state (%) - American Indian and Alaska Native
Geographical mobility - Moved from different state (%) - Multirace
Geographical mobility - Moved from different state (%) - Other Race
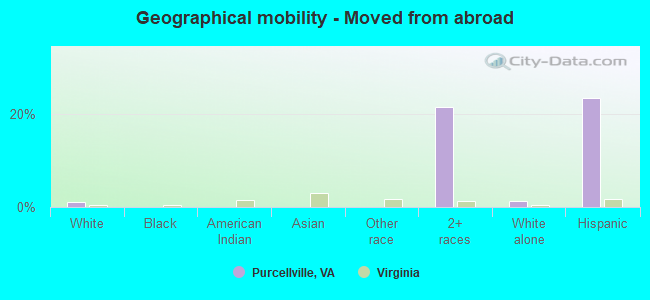
Geographical mobility - Moved from abroad (%)
Geographical mobility - Moved from abroad (%) - White
Geographical mobility - Moved from abroad (%) - Black or African American
Geographical mobility - Moved from abroad (%) - Asian
Geographical mobility - Moved from abroad (%) - Hispanic or Latino
Geographical mobility - Moved from abroad (%) - American Indian and Alaska Native
Geographical mobility - Moved from abroad (%) - Multirace
Geographical mobility - Moved from abroad (%) - Other Race
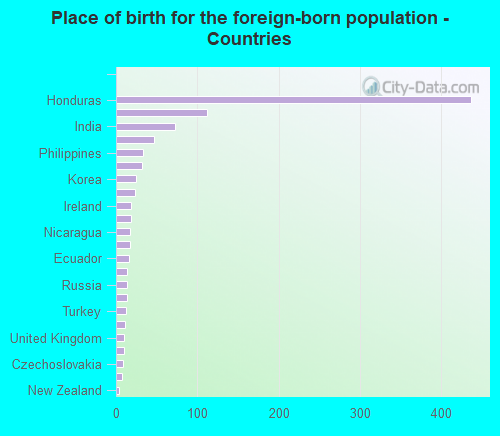
Place of birth for the foreign-born population - Ireland (%)
Place of birth for the foreign-born population - Denmark (%)
Place of birth for the foreign-born population - Norway (%)
Place of birth for the foreign-born population - Sweden (%)
Place of birth for the foreign-born population - United Kingdom (%)
Place of birth for the foreign-born population - England (%)
Place of birth for the foreign-born population - Scotland (%)
Place of birth for the foreign-born population - Other Northern Europe (%)
Place of birth for the foreign-born population - Austria (%)
Place of birth for the foreign-born population - Belgium (%)
Place of birth for the foreign-born population - France (%)
Place of birth for the foreign-born population - Germany (%)
Place of birth for the foreign-born population - Netherlands (%)
Place of birth for the foreign-born population - Switzerland (%)
Place of birth for the foreign-born population - Other Western Europe (%)
Place of birth for the foreign-born population - Greece (%)
Place of birth for the foreign-born population - Italy (%)
Place of birth for the foreign-born population - Portugal (%)
Place of birth for the foreign-born population - Spain (%)
Place of birth for the foreign-born population - Other Southern Europe (%)
Place of birth for the foreign-born population - Albania (%)
Place of birth for the foreign-born population - Belarus (%)
Place of birth for the foreign-born population - Bosnia and Herzegovina (%)
Place of birth for the foreign-born population - Bulgaria (%)
Place of birth for the foreign-born population - Croatia (%)
Place of birth for the foreign-born population - Czechoslovakia (%)
Place of birth for the foreign-born population - Hungary (%)
Place of birth for the foreign-born population - Latvia (%)
Place of birth for the foreign-born population - Lithuania (%)
Place of birth for the foreign-born population - North Macedonia (Macedonia) (%)
Place of birth for the foreign-born population - Moldova (%)
Place of birth for the foreign-born population - Poland (%)
Place of birth for the foreign-born population - Romania (%)
Place of birth for the foreign-born population - Russia (%)
Place of birth for the foreign-born population - Serbia (%)
Place of birth for the foreign-born population - Ukraine (%)
Place of birth for the foreign-born population - Other Eastern Europe (%)
Place of birth for the foreign-born population - China (%)
Place of birth for the foreign-born population - Hong Kong (%)
Place of birth for the foreign-born population - Taiwan (%)
Place of birth for the foreign-born population - Japan (%)
Place of birth for the foreign-born population - Korea (%)
Place of birth for the foreign-born population - Other Eastern Asia (%)
Place of birth for the foreign-born population - Afghanistan (%)
Place of birth for the foreign-born population - Bangladesh (%)
Place of birth for the foreign-born population - India (%)
Place of birth for the foreign-born population - Iran (%)
Place of birth for the foreign-born population - Kazakhstan (%)
Place of birth for the foreign-born population - Nepal (%)
Place of birth for the foreign-born population - Pakistan (%)
Place of birth for the foreign-born population - Sri Lanka (%)
Place of birth for the foreign-born population - Uzbekistan (%)
Place of birth for the foreign-born population - Other South Central Asia (%)
Place of birth for the foreign-born population - Burma (%)
Place of birth for the foreign-born population - Cambodia (%)
Place of birth for the foreign-born population - Indonesia (%)
Place of birth for the foreign-born population - Laos (%)
Place of birth for the foreign-born population - Malaysia (%)
Place of birth for the foreign-born population - Philippines (%)
Place of birth for the foreign-born population - Singapore (%)
Place of birth for the foreign-born population - Thailand (%)
Place of birth for the foreign-born population - Vietnam (%)
Place of birth for the foreign-born population - Other South Eastern Asia (%)
Place of birth for the foreign-born population - Armenia (%)
Place of birth for the foreign-born population - Iraq (%)
Place of birth for the foreign-born population - Israel (%)
Place of birth for the foreign-born population - Jordan (%)
Place of birth for the foreign-born population - Kuwait (%)
Place of birth for the foreign-born population - Lebanon (%)
Place of birth for the foreign-born population - Saudi Arabia (%)
Place of birth for the foreign-born population - Syria (%)
Place of birth for the foreign-born population - Turkey (%)
Place of birth for the foreign-born population - Yemen (%)
Place of birth for the foreign-born population - Other Western Asia (%)
Place of birth for the foreign-born population - Eritrea (%)
Place of birth for the foreign-born population - Ethiopia (%)
Place of birth for the foreign-born population - Kenya (%)
Place of birth for the foreign-born population - Somalia (%)
Place of birth for the foreign-born population - Uganda (%)
Place of birth for the foreign-born population - Zimbabwe (%)
Place of birth for the foreign-born population - Other Eastern Africa (%)
Place of birth for the foreign-born population - Cameroon (%)
Place of birth for the foreign-born population - Congo (%)
Place of birth for the foreign-born population - Democratic Republic of Congo (Zaire) (%)
Place of birth for the foreign-born population - Other Middle Africa (%)
Place of birth for the foreign-born population - Egypt (%)
Place of birth for the foreign-born population - Morocco (%)
Place of birth for the foreign-born population - Sudan (%)
Place of birth for the foreign-born population - Other Northern Africa (%)
Place of birth for the foreign-born population - South Africa (%)
Place of birth for the foreign-born population - Other Southern Africa (%)
Place of birth for the foreign-born population - Cabo Verde (%)
Place of birth for the foreign-born population - Ghana (%)
Place of birth for the foreign-born population - Liberia (%)
Place of birth for the foreign-born population - Nigeria (%)
Place of birth for the foreign-born population - Senegal (%)
Place of birth for the foreign-born population - Sierra Leone (%)
Place of birth for the foreign-born population - Other Western Africa (%)
Place of birth for the foreign-born population - Australia (%)
Place of birth for the foreign-born population - New Zealand (%)
Place of birth for the foreign-born population - Fiji (%)
Place of birth for the foreign-born population - Micronesia (%)
Place of birth for the foreign-born population - Bahamas (%)
Place of birth for the foreign-born population - Barbados (%)
Place of birth for the foreign-born population - Cuba (%)
Place of birth for the foreign-born population - Dominica (%)
Place of birth for the foreign-born population - Dominican Republic (%)
Place of birth for the foreign-born population - Grenada (%)
Place of birth for the foreign-born population - Haiti (%)
Place of birth for the foreign-born population - Jamaica (%)
Place of birth for the foreign-born population - St. Vincent and the Grenadines (%)
Place of birth for the foreign-born population - Trinidad and Tobago (%)
Place of birth for the foreign-born population - West Indies (%)
Place of birth for the foreign-born population - Other Caribbean (%)
Place of birth for the foreign-born population - Belize (%)
Place of birth for the foreign-born population - Costa Rica (%)
Place of birth for the foreign-born population - El Salvador (%)
Place of birth for the foreign-born population - Guatemala (%)
Place of birth for the foreign-born population - Honduras (%)
Place of birth for the foreign-born population - Mexico (%)
Place of birth for the foreign-born population - Nicaragua (%)
Place of birth for the foreign-born population - Panama (%)
Place of birth for the foreign-born population - Other Central America (%)
Place of birth for the foreign-born population - Argentina (%)
Place of birth for the foreign-born population - Bolivia (%)
Place of birth for the foreign-born population - Brazil (%)
Place of birth for the foreign-born population - Chile (%)
Place of birth for the foreign-born population - Colombia (%)
Place of birth for the foreign-born population - Ecuador (%)
Place of birth for the foreign-born population - Guyana (%)
Place of birth for the foreign-born population - Peru (%)
Place of birth for the foreign-born population - Uruguay (%)
Place of birth for the foreign-born population - Venezuela (%)
Place of birth for the foreign-born population - Other South America (%)
Place of birth for the foreign-born population - Canada (%)
Place of birth for the foreign-born population - Other Northern America (%)
Place of birth for the foreign-born population - Other (%)
Latest news about races in Purcellville, VA collected exclusively by city-data.com from local newspapers, TV, and radio stations
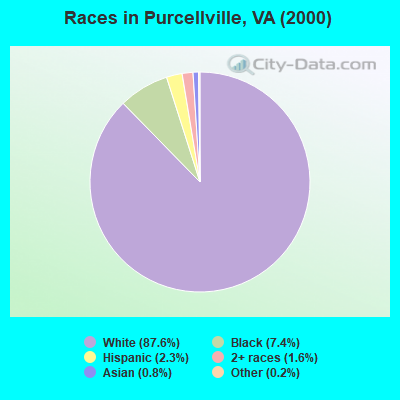
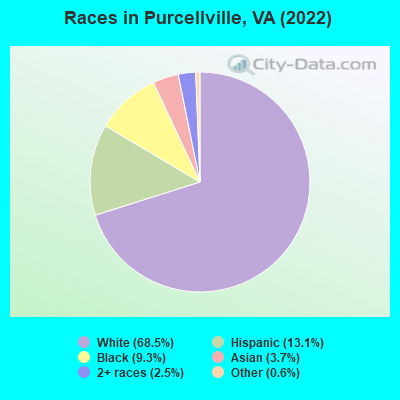
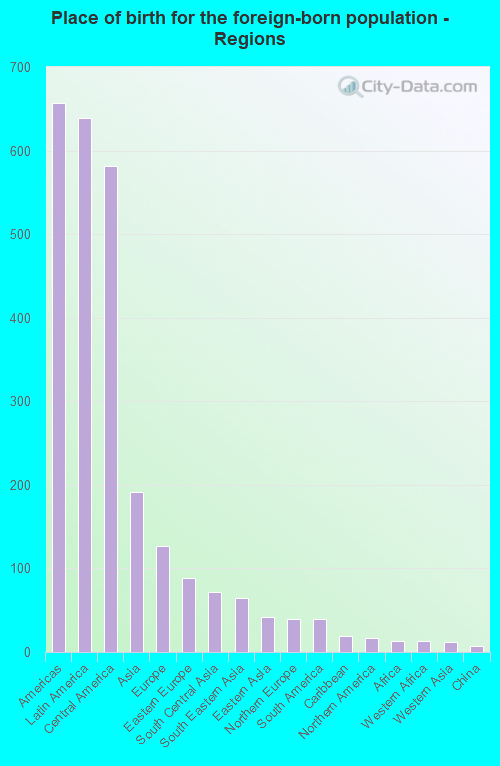
According to 2022 data, the most numerous races in Purcellville, VA are White alone (6,278 residents), Black alone (849 residents), and Hispanic (1,204 residents). 83.5% of Purcellville residents speak English at home. 10.8% of Purcellville, VA residents are foreign-born (7.1% born in Latin America, 2.1% born in Asia, 1.4% born in Europe), which is 10.7% less than the foreign-born rate of 12.0% across the entire state of Virginia.
Race distribution in Purcellville
2000 2022
4,965,637 70.2% White alone 1,376,378 19.4% Black alone 329,540 4.7% Hispanic 259,277 3.7% Asian alone 114,022 1.6% Two or more races 18,596 0.3% American Indian alone 11,685 0.2% Other race alone 3,380 0.05% Native Hawaiian and Other
5,095,130 58.7% White alone 1,594,785 18.4% Black alone 905,750 10.4% Hispanic 602,881 6.9% Asian alone 406,047 4.7% Two or more races 60,419 0.7% Other race alone 11,738 0.1% American Indian alone 6,869 0.08% Native Hawaiian and Other
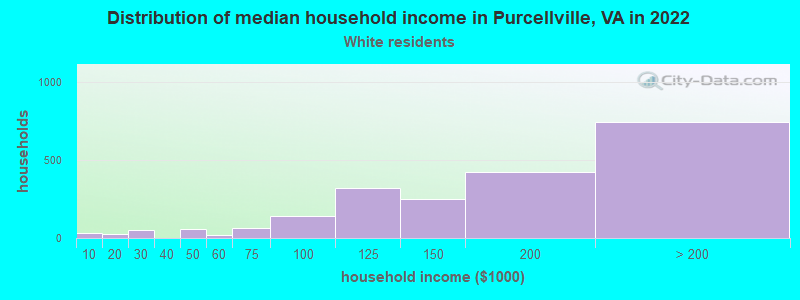
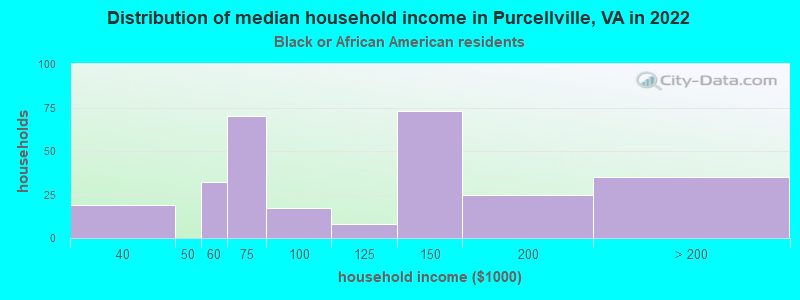
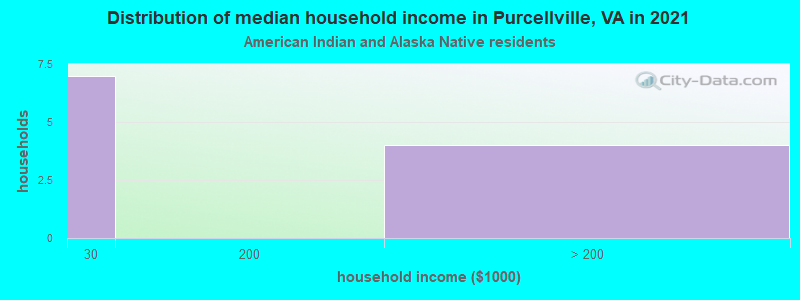
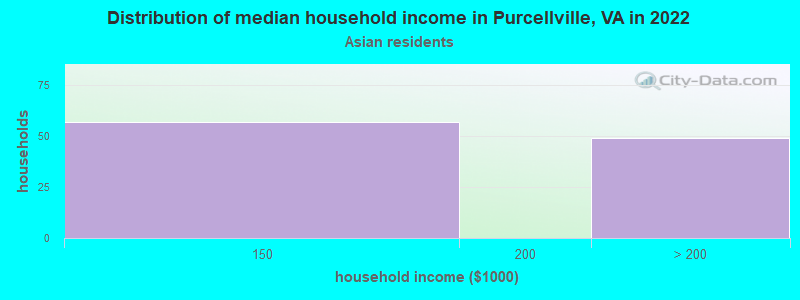
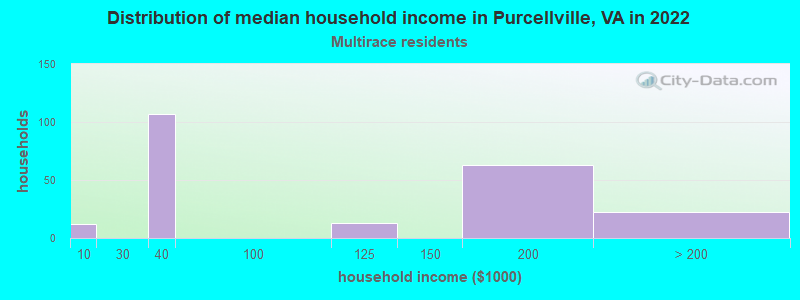
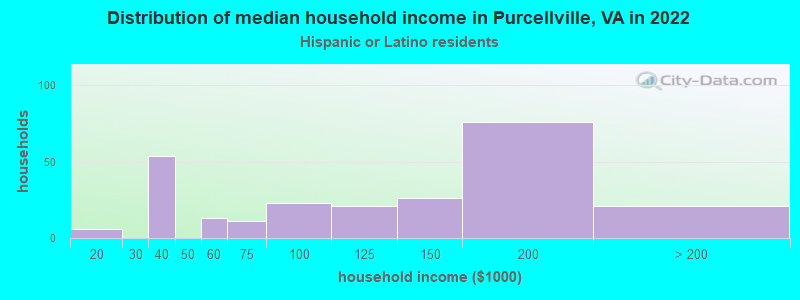
Income and house value in Purcellville Median household income in 2022 $165,484 White non-Hispanic householders$134,008 Black householdersover $200,000 Asian householders$100,454 Hispanic or Latino race householdersMedian 2022 house value $622,497 White Non-Hispanic householders$582,326 Black or African American householders$530,723 Two or more races householders$898,147 Hispanic or Latino householders
Median age by race in Purcellville
36.5 Median age for White residents37.0 36.3 58.2 Median age for Black or African American residents53.3 69.0 50.5 Median age for American Indian / Alaska Native residents-862,921,347.5 -673,154,906.1 45.1 Median age for Asian residents46.1 21.2 -1,157,453,935.2 Median age for Native Hawaiian / Pacific Islander residents-541,531,822.5 -714,150,046.8 19.3 Median age for Other race residents20.7 32.2 26.6 Median age for Two or more races residents25.4 30.1 37.1 Median age for White alone residents37.5 36.5 23.8 Median age for Hispanic or Latino residents23.3 26.9
Owner/renter occupied households by race in Purcellville
House owners and renters - White residents 1,893 89.0% Owner occupied233 11.0% Renter occupiedHouse owners and renters - Black or African American residents 275 90.2% Owner occupied30 9.8% Renter occupiedHouse owners and renters - American Indian / Alaska Native residents 9 100.0% Owner occupiedHouse owners and renters - Asian residents 100 100.0% Owner occupiedHouse owners and renters - Other race residents 11 100.0% Owner occupiedHouse owners and renters - Two or more races residents 112 58.7% Owner occupied79 41.3% Renter occupiedHouse owners and renters - White alone residents 1,859 89.6% Owner occupied215 10.4% Renter occupiedHouse owners and renters - Hispanic or Latino residents 161 59.9% Owner occupied107 40.1% Renter occupied
Language usage in Purcellville
English speakers - Total 83.5% of residents of Purcellville speak English at home.
9.5% of residents speak Spanish at home 382 47.2% Speak English very well427 52.8% Speak English less than very well2.9% of residents speak other language at home 232 94.3% Speak English very well14 5.7% Speak English less than very well
English speakers - Born in the United States 94.0% of residents of Purcellville speak English at home.
3.6% of residents speak Spanish at home 146 100.0% Speak English very well0.9% of residents speak other language at home 37 100.0% Speak English very well
English speakers - Native, born elsewhere 60.6% of residents of Purcellville speak English at home.
22.7% of residents speak Spanish at home 60 100.0% Speak English very well7.6% of residents speak other language at home 20 100.0% Speak English very well
English speakers - Foreign-born 17.4% of residents of Purcellville speak English at home.
52.7% of residents speak Spanish at home 91 17.5% Speak English very well429 82.5% Speak English less than very well18.8% of residents speak other language at home 173 93.0% Speak English very well13 7.0% Speak English less than very well
White (Caucasian) - Speak only English Native:
96.0% (5,555)Foreign-born:
23.6% (47)
White (Caucasian) - Speak another language Native:
4.0% (230)Foreign-born:
75.7% (151)
Black or African American - Speak another language Native:
1.3% (11)Foreign-born:
100.0% (13)
Asian - Speak only English Native:
91.4% (146)Foreign-born:
62.2% (109)
Other race - Speak only English Native:
72.4% (48)Foreign-born:
28.3% (20)
Other race - Speak another language Native:
26.8% (18)Foreign-born:
69.1% (49)
Two or more races - Speak only English Native:
82.6% (293)Foreign-born:
0.9% (5)
Two or more races - Speak another language Native:
12.4% (44)Foreign-born:
98.3% (566)
White alone - Speak only English Native:
96.2% (5,439)Foreign-born:
27.3% (47)
White alone - Speak another language Native:
3.2% (178)Foreign-born:
69.0% (120)
Hispanic or Latino - Speak another language Native:
37.1% (158)Foreign-born:
99.2% (562)
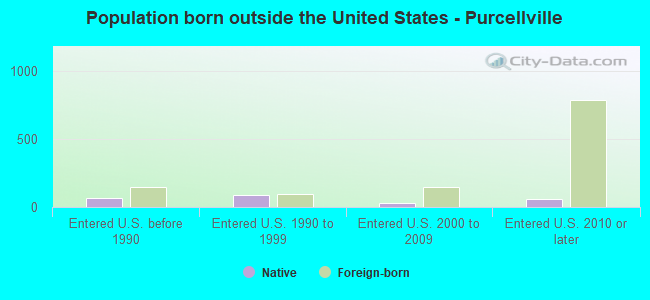
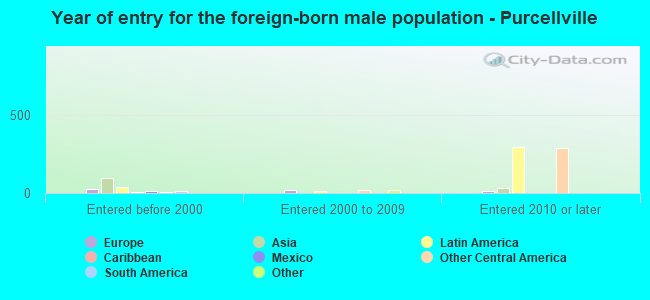
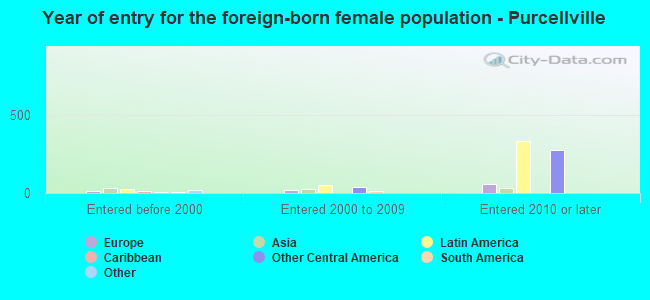
Foreign-born residents in Purcellville 994 residents are foreign born (7.1% Latin America , 2.1% Asia , 1.4% Europe ).
This city:
10.8%Virginia:
12.6%
Marital status for residents in Purcellville Marital status - White (Caucasian) population 15 years and over
Males 25.2% Never married68.0% Now married0.6% Separated0.4% Widowed5.8% DivorcedFemales 24.0% Never married64.3% Now married0.1% Separated4.8% Widowed6.8% DivorcedWomen who gave birth in the past 12 months Now married:
85.3% (59)Unmarried:
14.7% (10)
Women who did not give birth in the past 12 months Now married:
60.9% (983)Unmarried:
39.1% (632)
Marital status - Black or African American population 15 years and over
Males 48.8% Never married38.8% Now married0.0% Separated0.0% Widowed12.4% DivorcedFemales 24.4% Never married42.1% Now married0.0% Separated27.7% Widowed5.9% DivorcedWomen who did not give birth in the past 12 months Now married:
28.4% (25)Unmarried:
71.6% (62)
Marital status - American Indian / Alaska Native population 15 years and over
Males 100.0% Never married0.0% Now married0.0% Separated0.0% Widowed0.0% DivorcedFemales 0.0% Never married62.5% Now married0.0% Separated0.0% Widowed37.5% DivorcedWomen who did not give birth in the past 12 months Now married:
0.0% (0)Unmarried:
100.0% (3)
Marital status - Asian population 15 years and over
Males 7.8% Never married92.2% Now married0.0% Separated0.0% Widowed0.0% DivorcedFemales 47.7% Never married52.3% Now married0.0% Separated0.0% Widowed0.0% DivorcedWomen who did not give birth in the past 12 months Now married:
42.3% (57)Unmarried:
57.7% (78)
Marital status - Other race population 15 years and over
Males 48.9% Never married51.1% Now married0.0% Separated0.0% Widowed0.0% DivorcedFemales 25.0% Never married28.6% Now married0.0% Separated0.0% Widowed46.4% DivorcedWomen who did not give birth in the past 12 months Now married:
28.6% (10)Unmarried:
71.4% (25)
Marital status - Two or more races population 15 years and over
Males 22.9% Never married74.3% Now married0.0% Separated0.0% Widowed2.9% DivorcedFemales 44.3% Never married52.3% Now married0.0% Separated0.0% Widowed3.4% DivorcedWomen who gave birth in the past 12 months Now married:
10.5% (10)Unmarried:
89.5% (87)
Women who did not give birth in the past 12 months Now married:
66.4% (121)Unmarried:
33.6% (61)
Marital status - White alone, not Hispanic / Latino population 15 years and over
Males 25.3% Never married67.7% Now married0.6% Separated0.4% Widowed6.0% DivorcedFemales 24.6% Never married64.0% Now married0.1% Separated4.2% Widowed7.1% DivorcedWomen who gave birth in the past 12 months Now married:
100.0% (62)Unmarried:
0.0% (0)
Women who did not give birth in the past 12 months Now married:
59.6% (966)Unmarried:
40.4% (654)
Marital status - Hispanic or Latino population 15 years and over
Males 13.4% Never married86.6% Now married0.0% Separated0.0% Widowed0.0% DivorcedFemales 35.8% Never married54.6% Now married0.0% Separated6.0% Widowed3.6% DivorcedWomen who gave birth in the past 12 months Now married:
9.2% (8)Unmarried:
90.8% (81)
Women who did not give birth in the past 12 months Now married:
69.9% (162)Unmarried:
30.1% (70)
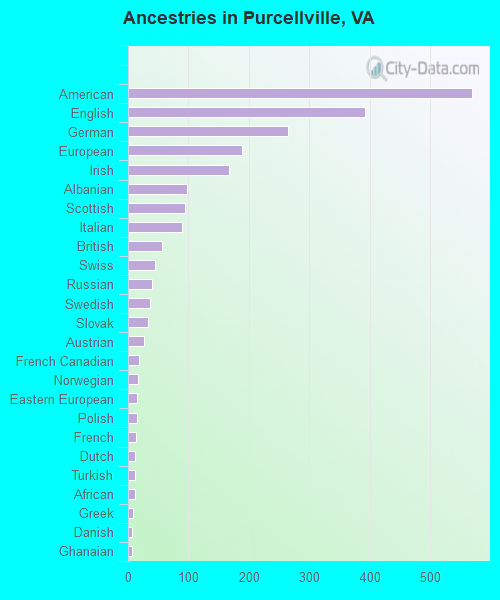
Ancestries in Purcellville
569 14.5% American393 10.0% English265 6.7% German189 4.8% European167 4.3% Irish98 2.5% Albanian94 2.4% Scottish89 2.3% Italian57 1.5% British44 1.1% Swiss40 1.0% Russian37 0.9% Swedish33 0.8% Slovak26 0.7% Austrian18 0.5% French Canadian17 0.4% Norwegian15 0.4% Eastern European15 0.4% Polish14 0.4% French12 0.3% Dutch12 0.3% Turkish11 0.3% African8 0.2% Greek7 0.2% Danish7 0.2% Ghanaian4 0.1% Canadian
Children Nativity (place of birth) in Purcellville
Children under 6 years - Living with two parents Both parents native 441 100.0% NativeBoth parents foreign-born 14 100.0% NativeOne native, one foreign-born parent 68 100.0% NativeChildren under 6 years - Living with one parent Native parent 96 100.0% NativeForeign-born parent 23 100.0% NativeChildren 6 to 17 years - Living with two parents Both parents native 1,189 99.7% Native4 0.3% Foreign-bornBoth parents foreign-born 37 25.1% Native109 74.9% Foreign-bornOne native, one foreign-born parent 119 100.0% NativeChildren 6 to 17 years - Living with one parent Native parent 195 100.0% Native
Grandparents responsible for own grandchildren in Purcellville
Grandparents (30 to 59 years) White / Caucasian 30 100.0% Not responsible for grandchildrenWhite alone, not Hispanic / Latino 18 100.0% Not responsible for grandchildrenHispanic or Latino 15 100.0% Not responsible for grandchildrenGrandparents (60 years and over) White / Caucasian 5 12.2% Responsible for grandchildren34 87.8% Not responsible for grandchildrenWhite alone, not Hispanic / Latino 5 11.7% Responsible for grandchildren36 88.3% Not responsible for grandchildren