Races in Pocatello, Idaho (ID) Detailed Stats
Data:
Races - White alone (%)
Races - White alone (% change since 2000)
Races - Black alone (%)
Races - Black alone (% change since 2000)
Races - American Indian alone (%)
Races - American Indian alone (% change since 2000)
Races - Asian alone (%)
Races - Asian alone (% change since 2000)
Races - Hispanic (%)
Races - Hispanic (% change since 2000)
Races - Native Hawaiian and Other Pacific Islander alone (%)
Races - Native Hawaiian and Other Pacific Islander alone (% change since 2000)
Races - Two or more races(%)
Races - Two or more races(% change since 2000)
Races - Other race alone (%)
Races - Other race alone (% change since 2000)
Racial diversity
Place of birth - Born in state of residence (%)
Place of birth - Born in state of residence (%) - White
Place of birth - Born in state of residence (%) - Black or African American
Place of birth - Born in state of residence (%) - Asian
Place of birth - Born in state of residence (%) - Hispanic or Latino
Place of birth - Born in state of residence (%) - American Indian and Alaska Native
Place of birth - Born in state of residence (%) - Multirace
Place of birth - Born in state of residence (%) - Other Race
Place of birth - Born in other state (%)
Place of birth - Born in other state (%) - White
Place of birth - Born in other state (%) - Black or African American
Place of birth - Born in other state (%) - Asian
Place of birth - Born in other state (%) - Hispanic or Latino
Place of birth - Born in other state (%) - American Indian and Alaska Native
Place of birth - Born in other state (%) - Multirace
Place of birth - Born in other state (%) - Other Race
Place of birth - Native, outside of US (%)
Place of birth - Native, outside of US (%) - White
Place of birth - Native, outside of US (%) - Black or African American
Place of birth - Native, outside of US (%) - Asian
Place of birth - Native, outside of US (%) - Hispanic or Latino
Place of birth - Native, outside of US (%) - American Indian and Alaska Native
Place of birth - Native, outside of US (%) - Multirace
Place of birth - Native, outside of US (%) - Other Race
Place of birth - Foreign born (%)
Place of birth - Foreign born (%) - White
Place of birth - Foreign born (%) - Black or African American
Place of birth - Foreign born (%) - Asian
Place of birth - Foreign born (%) - Hispanic or Latino
Place of birth - Foreign born (%) - American Indian and Alaska Native
Place of birth - Foreign born (%) - Multirace
Place of birth - Foreign born (%) - Other Race
Residents speaking English at home (%)
Residents speaking English at home - Born in the United States (%)
Residents speaking English at home - Native, born elsewhere (%)
Residents speaking English at home - Foreign born (%)
Residents speaking Spanish at home (%)
Residents speaking Spanish at home - Born in the United States (%)
Residents speaking Spanish at home - Native, born elsewhere (%)
Residents speaking Spanish at home - Foreign born (%)
Residents speaking other language at home (%)
Residents speaking other language at home - Born in the United States (%)
Residents speaking other language at home - Native, born elsewhere (%)
Residents speaking other language at home - Foreign born (%)
Marital status - Never married (%)
Marital status - Now married (%)
Marital status - Separated (%)
Marital status - Widowed (%)
Marital status - Divorced (%)
Ancestries Reported - Arab (%)
Ancestries Reported - Czech (%)
Ancestries Reported - Danish (%)
Ancestries Reported - Dutch (%)
Ancestries Reported - English (%)
Ancestries Reported - French (%)
Ancestries Reported - French Canadian (%)
Ancestries Reported - German (%)
Ancestries Reported - Greek (%)
Ancestries Reported - Hungarian (%)
Ancestries Reported - Irish (%)
Ancestries Reported - Italian (%)
Ancestries Reported - Lithuanian (%)
Ancestries Reported - Norwegian (%)
Ancestries Reported - Polish (%)
Ancestries Reported - Portuguese (%)
Ancestries Reported - Russian (%)
Ancestries Reported - Scotch-Irish (%)
Ancestries Reported - Scottish (%)
Ancestries Reported - Slovak (%)
Ancestries Reported - Subsaharan African (%)
Ancestries Reported - Swedish (%)
Ancestries Reported - Swiss (%)
Ancestries Reported - Ukrainian (%)
Ancestries Reported - United States (%)
Ancestries Reported - Welsh (%)
Ancestries Reported - West Indian (%)
Ancestries Reported - Other (%)
Geographical mobility - Same house 1 year ago (%)
Geographical mobility - Same house 1 year ago (%) - White
Geographical mobility - Same house 1 year ago (%) - Black or African American
Geographical mobility - Same house 1 year ago (%) - Asian
Geographical mobility - Same house 1 year ago (%) - Hispanic or Latino
Geographical mobility - Same house 1 year ago (%) - American Indian and Alaska Native
Geographical mobility - Same house 1 year ago (%) - Multirace
Geographical mobility - Same house 1 year ago (%) - Other Race
Geographical mobility - Moved within same county (%)
Geographical mobility - Moved within same county (%) - White
Geographical mobility - Moved within same county (%) - Black or African American
Geographical mobility - Moved within same county (%) - Asian
Geographical mobility - Moved within same county (%) - Hispanic or Latino
Geographical mobility - Moved within same county (%) - American Indian and Alaska Native
Geographical mobility - Moved within same county (%) - Multirace
Geographical mobility - Moved within same county (%) - Other Race
Geographical mobility - Moved from different county within same state (%)
Geographical mobility - Moved from different county within same state (%) - White
Geographical mobility - Moved from different county within same state (%) - Black or African American
Geographical mobility - Moved from different county within same state (%) - Asian
Geographical mobility - Moved from different county within same state (%) - Hispanic or Latino
Geographical mobility - Moved from different county within same state (%) - American Indian and Alaska Native
Geographical mobility - Moved from different county within same state (%) - Multirace
Geographical mobility - Moved from different county within same state (%) - Other Race
Geographical mobility - Moved from different state (%)
Geographical mobility - Moved from different state (%) - White
Geographical mobility - Moved from different state (%) - Black or African American
Geographical mobility - Moved from different state (%) - Asian
Geographical mobility - Moved from different state (%) - Hispanic or Latino
Geographical mobility - Moved from different state (%) - American Indian and Alaska Native
Geographical mobility - Moved from different state (%) - Multirace
Geographical mobility - Moved from different state (%) - Other Race
Geographical mobility - Moved from abroad (%)
Geographical mobility - Moved from abroad (%) - White
Geographical mobility - Moved from abroad (%) - Black or African American
Geographical mobility - Moved from abroad (%) - Asian
Geographical mobility - Moved from abroad (%) - Hispanic or Latino
Geographical mobility - Moved from abroad (%) - American Indian and Alaska Native
Geographical mobility - Moved from abroad (%) - Multirace
Geographical mobility - Moved from abroad (%) - Other Race
Place of birth for the foreign-born population - Ireland (%)
Place of birth for the foreign-born population - Denmark (%)
Place of birth for the foreign-born population - Norway (%)
Place of birth for the foreign-born population - Sweden (%)
Place of birth for the foreign-born population - United Kingdom (%)
Place of birth for the foreign-born population - England (%)
Place of birth for the foreign-born population - Scotland (%)
Place of birth for the foreign-born population - Other Northern Europe (%)
Place of birth for the foreign-born population - Austria (%)
Place of birth for the foreign-born population - Belgium (%)
Place of birth for the foreign-born population - France (%)
Place of birth for the foreign-born population - Germany (%)
Place of birth for the foreign-born population - Netherlands (%)
Place of birth for the foreign-born population - Switzerland (%)
Place of birth for the foreign-born population - Other Western Europe (%)
Place of birth for the foreign-born population - Greece (%)
Place of birth for the foreign-born population - Italy (%)
Place of birth for the foreign-born population - Portugal (%)
Place of birth for the foreign-born population - Spain (%)
Place of birth for the foreign-born population - Other Southern Europe (%)
Place of birth for the foreign-born population - Albania (%)
Place of birth for the foreign-born population - Belarus (%)
Place of birth for the foreign-born population - Bosnia and Herzegovina (%)
Place of birth for the foreign-born population - Bulgaria (%)
Place of birth for the foreign-born population - Croatia (%)
Place of birth for the foreign-born population - Czechoslovakia (%)
Place of birth for the foreign-born population - Hungary (%)
Place of birth for the foreign-born population - Latvia (%)
Place of birth for the foreign-born population - Lithuania (%)
Place of birth for the foreign-born population - North Macedonia (Macedonia) (%)
Place of birth for the foreign-born population - Moldova (%)
Place of birth for the foreign-born population - Poland (%)
Place of birth for the foreign-born population - Romania (%)
Place of birth for the foreign-born population - Russia (%)
Place of birth for the foreign-born population - Serbia (%)
Place of birth for the foreign-born population - Ukraine (%)
Place of birth for the foreign-born population - Other Eastern Europe (%)
Place of birth for the foreign-born population - China (%)
Place of birth for the foreign-born population - Hong Kong (%)
Place of birth for the foreign-born population - Taiwan (%)
Place of birth for the foreign-born population - Japan (%)
Place of birth for the foreign-born population - Korea (%)
Place of birth for the foreign-born population - Other Eastern Asia (%)
Place of birth for the foreign-born population - Afghanistan (%)
Place of birth for the foreign-born population - Bangladesh (%)
Place of birth for the foreign-born population - India (%)
Place of birth for the foreign-born population - Iran (%)
Place of birth for the foreign-born population - Kazakhstan (%)
Place of birth for the foreign-born population - Nepal (%)
Place of birth for the foreign-born population - Pakistan (%)
Place of birth for the foreign-born population - Sri Lanka (%)
Place of birth for the foreign-born population - Uzbekistan (%)
Place of birth for the foreign-born population - Other South Central Asia (%)
Place of birth for the foreign-born population - Burma (%)
Place of birth for the foreign-born population - Cambodia (%)
Place of birth for the foreign-born population - Indonesia (%)
Place of birth for the foreign-born population - Laos (%)
Place of birth for the foreign-born population - Malaysia (%)
Place of birth for the foreign-born population - Philippines (%)
Place of birth for the foreign-born population - Singapore (%)
Place of birth for the foreign-born population - Thailand (%)
Place of birth for the foreign-born population - Vietnam (%)
Place of birth for the foreign-born population - Other South Eastern Asia (%)
Place of birth for the foreign-born population - Armenia (%)
Place of birth for the foreign-born population - Iraq (%)
Place of birth for the foreign-born population - Israel (%)
Place of birth for the foreign-born population - Jordan (%)
Place of birth for the foreign-born population - Kuwait (%)
Place of birth for the foreign-born population - Lebanon (%)
Place of birth for the foreign-born population - Saudi Arabia (%)
Place of birth for the foreign-born population - Syria (%)
Place of birth for the foreign-born population - Turkey (%)
Place of birth for the foreign-born population - Yemen (%)
Place of birth for the foreign-born population - Other Western Asia (%)
Place of birth for the foreign-born population - Eritrea (%)
Place of birth for the foreign-born population - Ethiopia (%)
Place of birth for the foreign-born population - Kenya (%)
Place of birth for the foreign-born population - Somalia (%)
Place of birth for the foreign-born population - Uganda (%)
Place of birth for the foreign-born population - Zimbabwe (%)
Place of birth for the foreign-born population - Other Eastern Africa (%)
Place of birth for the foreign-born population - Cameroon (%)
Place of birth for the foreign-born population - Congo (%)
Place of birth for the foreign-born population - Democratic Republic of Congo (Zaire) (%)
Place of birth for the foreign-born population - Other Middle Africa (%)
Place of birth for the foreign-born population - Egypt (%)
Place of birth for the foreign-born population - Morocco (%)
Place of birth for the foreign-born population - Sudan (%)
Place of birth for the foreign-born population - Other Northern Africa (%)
Place of birth for the foreign-born population - South Africa (%)
Place of birth for the foreign-born population - Other Southern Africa (%)
Place of birth for the foreign-born population - Cabo Verde (%)
Place of birth for the foreign-born population - Ghana (%)
Place of birth for the foreign-born population - Liberia (%)
Place of birth for the foreign-born population - Nigeria (%)
Place of birth for the foreign-born population - Senegal (%)
Place of birth for the foreign-born population - Sierra Leone (%)
Place of birth for the foreign-born population - Other Western Africa (%)
Place of birth for the foreign-born population - Australia (%)
Place of birth for the foreign-born population - New Zealand (%)
Place of birth for the foreign-born population - Fiji (%)
Place of birth for the foreign-born population - Micronesia (%)
Place of birth for the foreign-born population - Bahamas (%)
Place of birth for the foreign-born population - Barbados (%)
Place of birth for the foreign-born population - Cuba (%)
Place of birth for the foreign-born population - Dominica (%)
Place of birth for the foreign-born population - Dominican Republic (%)
Place of birth for the foreign-born population - Grenada (%)
Place of birth for the foreign-born population - Haiti (%)
Place of birth for the foreign-born population - Jamaica (%)
Place of birth for the foreign-born population - St. Vincent and the Grenadines (%)
Place of birth for the foreign-born population - Trinidad and Tobago (%)
Place of birth for the foreign-born population - West Indies (%)
Place of birth for the foreign-born population - Other Caribbean (%)
Place of birth for the foreign-born population - Belize (%)
Place of birth for the foreign-born population - Costa Rica (%)
Place of birth for the foreign-born population - El Salvador (%)
Place of birth for the foreign-born population - Guatemala (%)
Place of birth for the foreign-born population - Honduras (%)
Place of birth for the foreign-born population - Mexico (%)
Place of birth for the foreign-born population - Nicaragua (%)
Place of birth for the foreign-born population - Panama (%)
Place of birth for the foreign-born population - Other Central America (%)
Place of birth for the foreign-born population - Argentina (%)
Place of birth for the foreign-born population - Bolivia (%)
Place of birth for the foreign-born population - Brazil (%)
Place of birth for the foreign-born population - Chile (%)
Place of birth for the foreign-born population - Colombia (%)
Place of birth for the foreign-born population - Ecuador (%)
Place of birth for the foreign-born population - Guyana (%)
Place of birth for the foreign-born population - Peru (%)
Place of birth for the foreign-born population - Uruguay (%)
Place of birth for the foreign-born population - Venezuela (%)
Place of birth for the foreign-born population - Other South America (%)
Place of birth for the foreign-born population - Canada (%)
Place of birth for the foreign-born population - Other Northern America (%)
Place of birth for the foreign-born population - Other (%)
Latest news about races in Pocatello, ID collected exclusively by city-data.com from local newspapers, TV, and radio stations
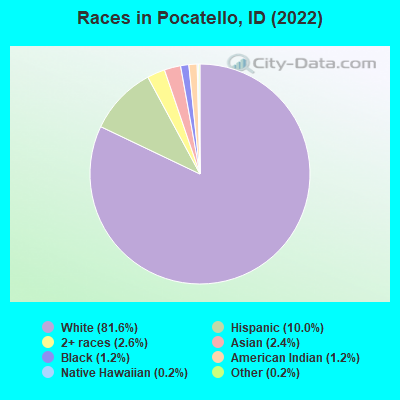
According to 2022 data, the most numerous races in Pocatello, ID are White alone (47,261 residents), Hispanic (5,792 residents), and Two or more races (1,531 residents). 92.8% of Pocatello residents speak English at home. 3.9% of Pocatello, ID residents are foreign-born (1.6% born in Asia, 0.9% born in Europe, 0.8% born in Latin America), which is 28.6% less than the foreign-born rate of 5.0% across the entire state of Idaho.
Race distribution in Pocatello
2000 2022
1,139,291 88.0% White alone 101,690 7.9% Hispanic 18,261 1.4% Two or more races 15,789 1.2% American Indian alone 11,641 0.9% Asian alone 4,889 0.4% Black alone 1,192 0.09% Other race alone 1,200 0.09% Native Hawaiian and Other
1,531,219 79.0% White alone 261,921 13.5% Hispanic 81,112 4.2% Two or more races 25,174 1.3% Asian alone 15,825 0.8% American Indian alone 11,868 0.6% Black alone 8,752 0.5% Other race alone 3,162 0.2% Native Hawaiian and Other
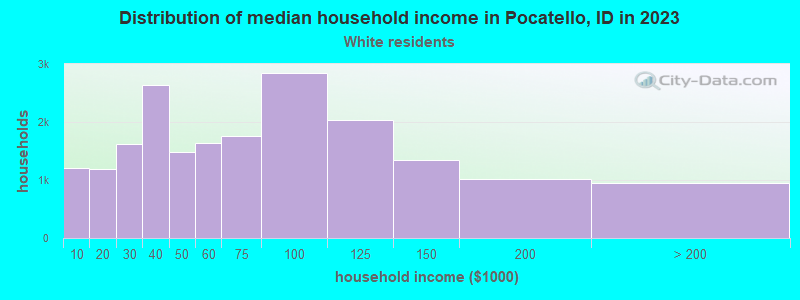
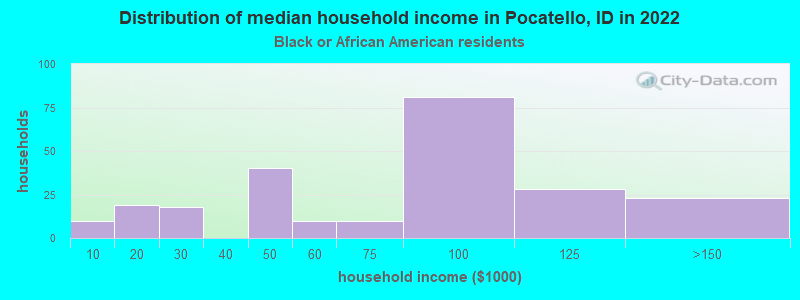
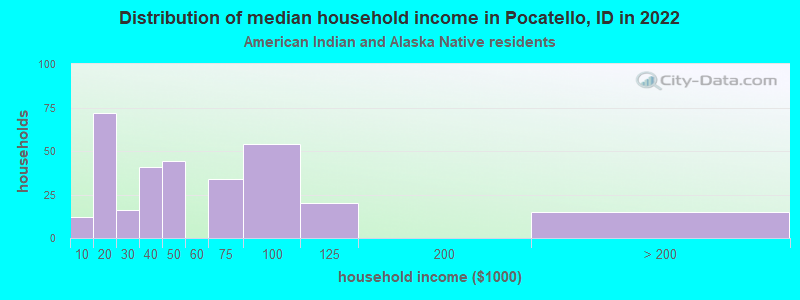
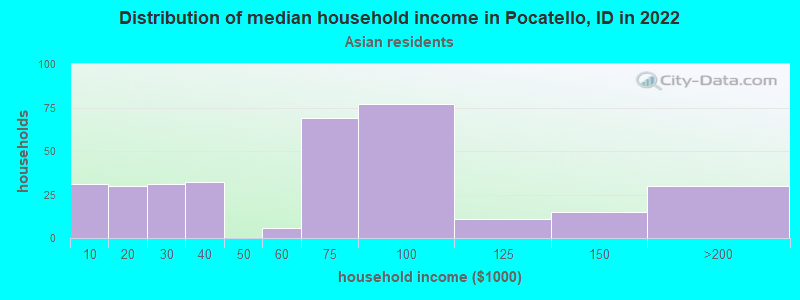
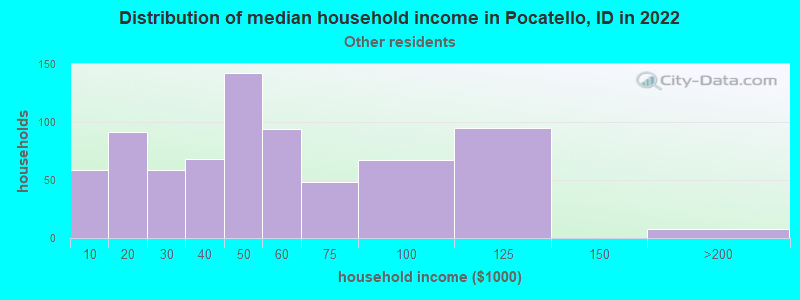
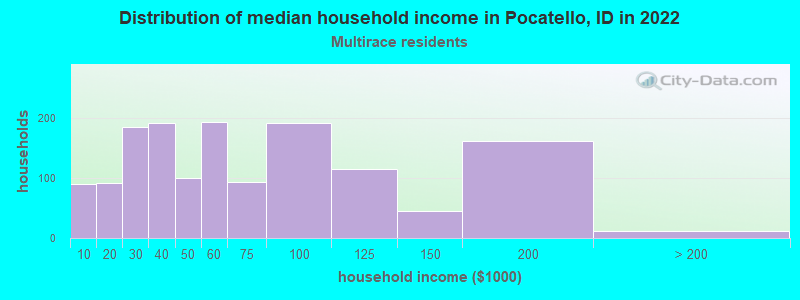
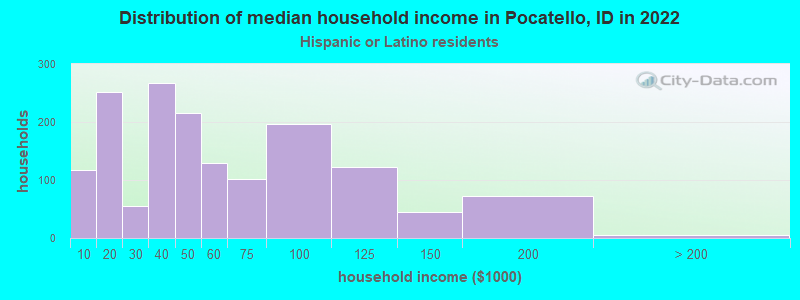
Income and house value in Pocatello Median household income in 2022 $57,899 White non-Hispanic householders$56,614 Black householders$45,474 American Indian and Alaska Native householders$77,226 Asian householders$50,598 Some other race householders$55,030 Two or more races householders$48,744 Hispanic or Latino race householdersMedian 2022 house value $291,040 White Non-Hispanic householders$246,136 Black or African American householders$255,782 American Indian or Alaska Native householders $339,935 Asian householders$429,741 Native Hawaiian and other Pacific Islander householders$255,450 Some other race householders$294,699 Two or more races householders$249,795 Hispanic or Latino householders
Median age by race in Pocatello
34.7 Median age for White residents33.6 35.1 33.0 Median age for Black or African American residents37.4 33.2 33.0 Median age for American Indian / Alaska Native residents23.0 48.6 36.3 Median age for Asian residents29.0 30.2 12.0 Median age for Native Hawaiian / Pacific Islander residents-355,119,825.4 20.7 33.8 Median age for Other race residents34.2 32.9 25.7 Median age for Two or more races residents29.9 20.1 35.4 Median age for White alone residents35.0 35.5 25.2 Median age for Hispanic or Latino residents24.7 27.0
Owner/renter occupied households by race in Pocatello
House owners and renters - White residents 13,069 67.2% Owner occupied6,367 32.8% Renter occupiedHouse owners and renters - Black or African American residents 154 42.7% Owner occupied207 57.3% Renter occupiedHouse owners and renters - American Indian / Alaska Native residents 158 35.1% Owner occupied292 64.9% Renter occupiedHouse owners and renters - Asian residents 284 53.0% Owner occupied252 47.0% Renter occupiedHouse owners and renters - Native Hawaiian / Pacific Islander residents 5 100.0% Renter occupiedHouse owners and renters - Other race residents 292 33.5% Owner occupied581 66.5% Renter occupiedHouse owners and renters - Two or more races residents 682 72.2% Owner occupied262 27.8% Renter occupiedHouse owners and renters - White alone residents 12,857 66.9% Owner occupied6,349 33.1% Renter occupiedHouse owners and renters - Hispanic or Latino residents 971 56.6% Owner occupied745 43.4% Renter occupied
Language usage in Pocatello
English speakers - Total 92.8% of residents of Pocatello speak English at home.
4.6% of residents speak Spanish at home 2,029 82.0% Speak English very well444 18.0% Speak English less than very well2.1% of residents speak other language at home 760 67.5% Speak English very well366 32.5% Speak English less than very well
English speakers - Born in the United States 95.5% of residents of Pocatello speak English at home.
4.0% of residents speak Spanish at home 800 96.4% Speak English very well30 3.6% Speak English less than very well0.8% of residents speak other language at home 103 60.9% Speak English very well66 39.1% Speak English less than very well
English speakers - Native, born elsewhere 84.1% of residents of Pocatello speak English at home.
15.3% of residents speak Spanish at home 28 28.3% Speak English very well71 71.7% Speak English less than very well9.4% of residents speak other language at home 47 77.0% Speak English very well14 23.0% Speak English less than very well
English speakers - Foreign-born 45.9% of residents of Pocatello speak English at home.
22.2% of residents speak Spanish at home 378 60.0% Speak English very well252 40.0% Speak English less than very well27.2% of residents speak other language at home 483 62.7% Speak English very well287 37.3% Speak English less than very well
White (Caucasian) - Speak only English Native:
98.0% (43,960)Foreign-born:
73.4% (658)
White (Caucasian) - Speak another language Native:
2.0% (894)Foreign-born:
25.3% (227)
Black or African American - Speak only English Native:
100.0% (549)Foreign-born:
28.0% (47)
Black or African American - Speak another language Native:
1.3% (7)Foreign-born:
72.2% (122)
American Indian / Alaska Native - Speak only English Native:
84.7% (712)Foreign-born:
100.0% (2)
Asian - Speak only English Native:
71.0% (446)Foreign-born:
47.3% (434)
Asian - Speak another language Native:
26.6% (167)Foreign-born:
54.0% (496)
Native Hawaiian / Pacific Islander - Speak only English Native:
69.7% (45)Foreign-born:
96.3% (24)
Other race - Speak only English Native:
65.5% (803)Foreign-born:
21.0% (56)
Other race - Speak another language Native:
36.2% (444)Foreign-born:
80.1% (211)
Two or more races - Speak only English Native:
90.8% (3,758)Foreign-born:
7.3% (8)
Two or more races - Speak another language Native:
6.6% (273)Foreign-born:
91.9% (104)
White alone - Speak only English Native:
98.1% (42,945)Foreign-born:
74.4% (651)
White alone - Speak another language Native:
1.8% (792)Foreign-born:
23.7% (207)
Hispanic or Latino - Speak only English Native:
72.3% (3,033)Foreign-born:
26.6% (243)
Hispanic or Latino - Speak another language Native:
25.2% (1,055)Foreign-born:
69.8% (637)
Foreign-born residents in Pocatello 2,253 residents are foreign born (1.6% Asia , 0.9% Europe , 0.8% Latin America ).
Marital status for residents in Pocatello Marital status - White (Caucasian) population 15 years and over
Males 35.7% Never married47.5% Now married0.5% Separated2.7% Widowed13.6% DivorcedFemales 30.0% Never married47.1% Now married1.2% Separated7.8% Widowed13.8% DivorcedWomen who gave birth in the past 12 months Now married:
90.4% (539)Unmarried:
9.6% (57)
Women who did not give birth in the past 12 months Now married:
43.9% (4,975)Unmarried:
56.1% (6,354)
Marital status - Black or African American population 15 years and over
Males 65.8% Never married29.2% Now married0.0% Separated1.4% Widowed3.7% DivorcedFemales 38.5% Never married44.5% Now married0.0% Separated0.0% Widowed17.0% DivorcedWomen who did not give birth in the past 12 months Now married:
50.3% (87)Unmarried:
49.7% (86)
Marital status - American Indian / Alaska Native population 15 years and over
Males 68.3% Never married30.5% Now married0.0% Separated0.0% Widowed1.2% DivorcedFemales 47.0% Never married19.8% Now married0.9% Separated8.3% Widowed24.0% DivorcedWomen who gave birth in the past 12 months Now married:
100.0% (3)Unmarried:
0.0% (0)
Women who did not give birth in the past 12 months Now married:
23.5% (58)Unmarried:
76.5% (190)
Marital status - Asian population 15 years and over
Males 31.1% Never married57.4% Now married7.4% Separated0.0% Widowed4.1% DivorcedFemales 43.7% Never married43.7% Now married2.0% Separated5.8% Widowed4.9% DivorcedWomen who did not give birth in the past 12 months Now married:
37.0% (222)Unmarried:
63.0% (379)
Marital status - Other race population 15 years and over
Males 67.6% Never married9.8% Now married8.9% Separated4.4% Widowed9.4% DivorcedFemales 48.5% Never married15.2% Now married7.7% Separated4.1% Widowed24.6% DivorcedWomen who did not give birth in the past 12 months Now married:
14.0% (55)Unmarried:
86.0% (337)
Marital status - Two or more races population 15 years and over
Males 43.2% Never married44.6% Now married0.0% Separated2.5% Widowed9.7% DivorcedFemales 39.3% Never married33.9% Now married0.5% Separated18.1% Widowed8.3% DivorcedWomen who gave birth in the past 12 months Now married:
100.0% (12)Unmarried:
0.0% (0)
Women who did not give birth in the past 12 months Now married:
34.4% (476)Unmarried:
65.6% (907)
Marital status - White alone, not Hispanic / Latino population 15 years and over
Males 35.2% Never married47.7% Now married0.3% Separated2.8% Widowed14.0% DivorcedFemales 28.9% Never married48.1% Now married1.2% Separated8.0% Widowed13.8% DivorcedWomen who gave birth in the past 12 months Now married:
92.7% (528)Unmarried:
7.3% (42)
Women who did not give birth in the past 12 months Now married:
45.2% (5,080)Unmarried:
54.8% (6,153)
Marital status - Hispanic or Latino population 15 years and over
Males 53.9% Never married33.0% Now married4.4% Separated2.1% Widowed6.6% DivorcedFemales 49.0% Never married20.0% Now married3.5% Separated13.0% Widowed14.5% DivorcedWomen who gave birth in the past 12 months Now married:
62.2% (30)Unmarried:
37.8% (18)
Women who did not give birth in the past 12 months Now married:
17.5% (243)Unmarried:
82.5% (1,147)
Ancestries in Pocatello
5,066 21.6% English2,859 12.2% American1,831 7.8% German1,296 5.5% European1,187 5.1% Irish488 2.1% Norwegian486 2.1% Scottish460 2.0% Swedish326 1.4% Danish293 1.2% Italian249 1.1% Welsh177 0.8% Polish163 0.7% French162 0.7% Scandinavian138 0.6% British130 0.6% Scotch-Irish112 0.5% Dutch94 0.4% Northern European81 0.3% Basque77 0.3% Iranian65 0.3% Swiss60 0.3% Belgian54 0.2% Ethiopian50 0.2% French Canadian44 0.2% Romanian44 0.2% Russian34 0.1% Armenian33 0.1% Afghan28 0.1% Portuguese28 0.1% Brazilian26 0.1% Eastern European26 0.1% Nigerian24 0.1% Greek23 0.10% Ghanaian21 0.09% Pennsylvania German17 0.07% New Zealander17 0.07% Czech16 0.07% Ukrainian13 0.06% Assyrian13 0.06% Canadian12 0.05% Icelander9 0.04% Egyptian9 0.04% Austrian9 0.04% African8 0.03% Lithuanian8 0.03% Slovak7 0.03% Croatian
Geographical mobility in Pocatello Same house 1 year ago 39,849 83.0% White (Caucasian)413 52.9% Black or African American816 85.3% American Indian / Alaska Native1,044 65.1% Asian19 21.7% Native Hawaiian / Pacific Islander888 59.9% Other race3,986 83.2% Two or more races38,749 83.1% White alone, not Hispanic / Latino4,311 77.4% Hispanic or LatinoMoved within same county 3,525 7.3% White / Caucasian377 48.3% Black or African American45 4.7% American Indian / Alaska Native80 5.0% Asian29 32.7% Native Hawaiian / Pacific Islander129 8.7% Other race348 7.3% Two or more races3,428 7.3% White alone, not Hispanic / Latino447 8.0% Hispanic or LatinoMoved within same state 2,193 4.6% White / Caucasian26 3.4% Black or African American37 3.8% American Indian / Alaska Native90 5.6% Asian329 22.2% Other race430 9.0% Two or more races2,026 4.3% White alone, not Hispanic / Latino600 10.8% Hispanic or LatinoMoved from different state 2,304 4.8% White / Caucasian44 5.6% Black or African American30 3.1% American Indian / Alaska Native67 4.2% Asian39 43.7% Native Hawaiian / Pacific Islander45 3.0% Other race81 1.7% Two or more races2,314 5.0% White alone, not Hispanic / Latino61 1.1% Hispanic or LatinoMoved from abroad 54 0.1% White252 15.7% Asian6 0.1% Two or more races42 0.1% White alone, not Hispanic / Latino12 0.2% Hispanic or Latino
Children Nativity (place of birth) in Pocatello
Children under 6 years - Living with two parents Both parents native 2,964 100.0% NativeBoth parents foreign-born 74 100.0% NativeOne native, one foreign-born parent 197 100.0% NativeChildren under 6 years - Living with one parent Native parent 1,080 100.0% NativeForeign-born parent 24 100.0% NativeChildren 6 to 17 years - Living with two parents Both parents native 5,905 99.9% Native9 0.1% Foreign-bornBoth parents foreign-born 275 91.9% Native24 8.1% Foreign-bornOne native, one foreign-born parent 309 91.8% Native28 8.2% Foreign-bornChildren 6 to 17 years - Living with one parent Native parent 2,525 100.0% NativeForeign-born parent 166 59.4% Native113 40.6% Foreign-born
Grandparents responsible for own grandchildren in Pocatello
Grandparents (30 to 59 years) White / Caucasian 49 33.0% Responsible for grandchildren99 67.0% Not responsible for grandchildrenBlack or African American 4 100.0% Responsible for grandchildrenOther race 26 100.0% Not responsible for grandchildrenTwo or more races 257 97.8% Responsible for grandchildren6 2.2% Not responsible for grandchildrenWhite alone, not Hispanic / Latino 11 10.1% Responsible for grandchildren100 89.9% Not responsible for grandchildrenHispanic or Latino 53 71.3% Responsible for grandchildren22 28.7% Not responsible for grandchildrenGrandparents (60 years and over) White / Caucasian 159 46.4% Responsible for grandchildren183 53.6% Not responsible for grandchildrenWhite alone, not Hispanic / Latino 146 44.9% Responsible for grandchildren180 55.1% Not responsible for grandchildrenHispanic or Latino 18 80.7% Responsible for grandchildren4 19.3% Not responsible for grandchildren